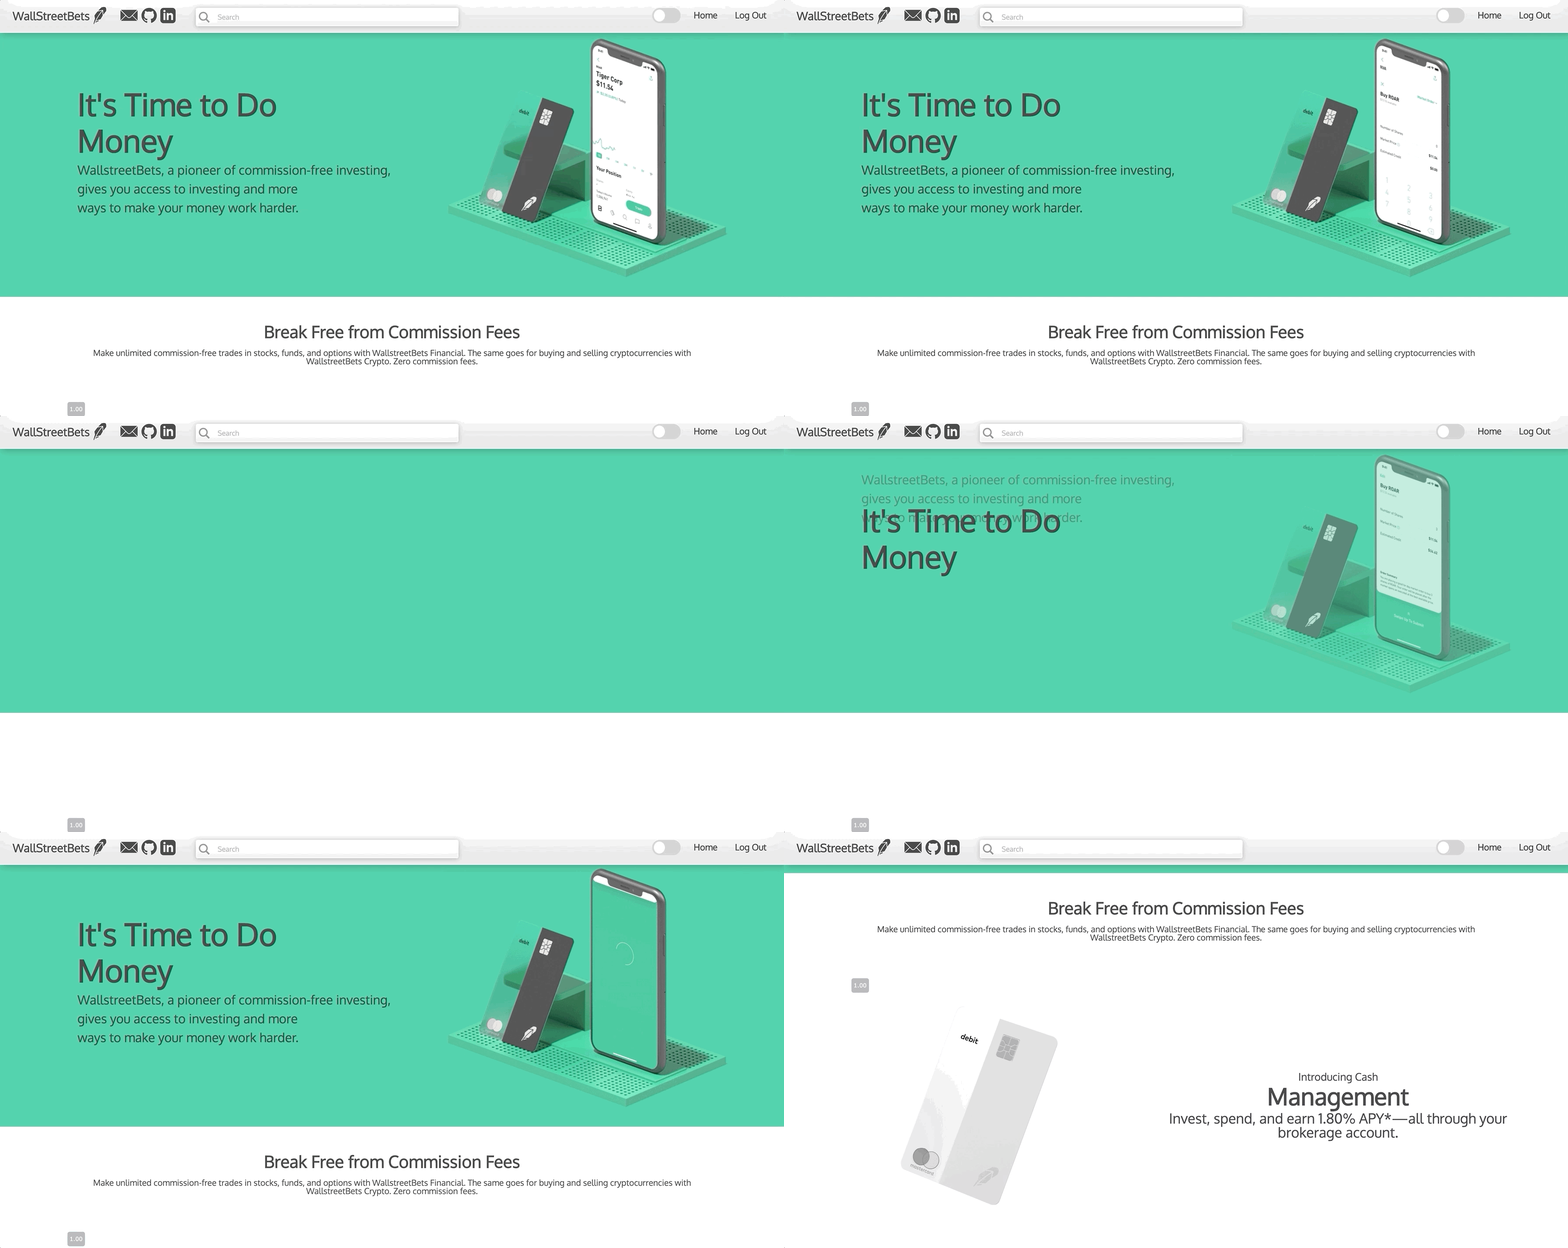
An investment app with a simple interactive design that allows new users to invest and trade stocks with no commission fees.
- Frontend: React/Redux, HTML5, CSS
- Backend: Ruby on Rails, PostgreSQL
- IEX Trading API
- News API
- Recharts JS
- Odometer JS
Wallstreet Bets was built with a Ruby on Rails framework, utilizing PostgresSQL for organized data storage, and the React Redux libraries for dynamic frontend, single-page app navigation and interactivity. It uses the Recharts data visualization library with the IEX Trading API to dynamically display real-time data.
- Secure frontend to backend user authentication using BCrypt
- Real-time and historical price data of all stocks traded on the NASDAQ
- Interactive dashboard showing a user's relavant owned as well as watched stocks
- Interactive charts displaying stock price and portfolio price fluctuation over time
- Users are able to purchase and sell their own stocks, as well as add/remove stocks from their watchlist
- Allow search for a specific stock by ticker symbol or company name
- Relevant news displayed for the general market on home page, and for specific stock on the stock's show page
Code was originally written using React Class. Components were then refactored with the use of hooks and functional components. Includes the use of useState and useEffect.
 const StockIndexItem = props => {
  let [currentIntradayData, setCurrentIntradayData] = useState([]);
  let [price, setPrice] = useState(0);
  let [loadingState, setLoadingState] = useState(true);

  const { symbol, type, shares } = props;
  let name = "stock-index-shares";
      if (type === 'watchedStock') {
        name = "stock-index-shares-hidden"
      }

  useEffect(() => {
    if (type === "ownedStock") {
      props.fetchStockIntradayData(symbol).then(() => {
        removeLoading();
      });
    } else if (type === "watchedStock") {
      props.fetchWatchIntradayData(symbol).then(() => {
        removeLoading();
      });
    }
  }, [])

  useEffect(() => {
    if (price === 0) renderLatestPrice();
  })

  const removeLoading = () => {
    setLoadingState(false)
  }

  const selectIntradayData = () => {
    let intradayData = [];
    if (type === "ownedStock") {
      intradayData = props.stocks[symbol].intradayData;
    } else if (type === "watchedStock") {
      intradayData = props.watches[symbol].intradayData
    }
    return intradayData;
  }

  const renderLatestPrice = () => {
    let latestPrice = 0;
    let intradayData = [];
    if (type === "ownedStock") {
      intradayData = props.stocks[symbol].intradayData;
    } else if (type === "watchedStock") {
      intradayData = props.watches[symbol].intradayData;
    }

    if (intradayData) {
      latestPrice = intradayData[intradayData.length - 1].close;
    }
    return parseFloatToDollars(latestPrice)
  }

  return (
    <Link to={`/stocks/${symbol}`} className="stock-show-link" >
      <div className="stock-index">
        <div className="stock-index-left">
          <div className="stock-index-symbol">
            {symbol}
          </div>
          <div className={name}>
            {shares} shares
          </div>
        </div>
        <div className="stock-index-chart">
          <StockMiniChart
            intradayData = {selectIntradayData()}
            loadingState = {loadingState}
          />
        </div>
        <div className="stock-index-current-price">
          {renderLatestPrice()}
        </div>
      </div>
    </Link>
  )

}Once a user logs in, they are able to view a visualization of their chart balance. They are also able to see general news, as well as stock/comapnies that they follow or own.
Using IEX Cloud to pull stock historical information in conjunction with Recharts to visualize the data, the data is parsed for each of the following dates; 1D, 1W, 3M, 1Y, 5Y each triggered by its own eventhandler. The data is stored in the redux state and each component modifies its original local state's data to fit the range that is indicated.
changeDate(range) {
   let newChartData;
   let fiveYearLength = this.state.fiveYearData.length;
   if (range === "1D") {
     newChartData = this.state.fiveYearData.slice(fiveYearLength - 5, fiveYearLength)
   } else if (range === "1W") {
     newChartData = this.state.fiveYearData.slice(fiveYearLength - 11, fiveYearLength)
   } else if (range === "1M") {
     newChartData = this.state.fiveYearData.slice(fiveYearLength - 21, fiveYearLength)
   } else if (range === "3M") {
     newChartData = this.state.fiveYearData.slice(fiveYearLength - 66, fiveYearLength)
   } else if (range === "1Y") {
     newChartData = this.state.fiveYearData.slice(fiveYearLength - 253, fiveYearLength)
   } else if (range === "5Y") {
     newChartData = this.state.fiveYearData
   }
}Eventhandler listeners used for a toggle switch to change the UI theme from dark to light or vice versa based on its option 'theme'. Global variables were created for each theme and shown depending on the selected option.
changeTheme() {
   const checkbox = document.querySelector('input[name=theme]');

   checkbox.addEventListener('change', function () {
     if (this.checked) {
       trans()
       document.documentElement.setAttribute('data-theme', 'dark')
     } else {
       trans()
       document.documentElement.setAttribute('data-theme', 'light')
     }
   })

   let trans = () => {
     document.documentElement.classList.add('transition');
     window.setTimeout(() => {
       document.documentElement.classList.remove('transition')
     }, 1000)
   }
}Once an order is placed, the order will be sent via an actions to the backend and frontend to update the user's stocks accordingly. User's are also able to add/remove stocks from their watchlist via the show page.
handleOrderTransaction(e) {
    e.preventDefault();
    const {stock, currentUser } = this.props;

    if (this.state.type === "BUY") {
      let order = {
        user_id: currentUser.id,
        symbol: stock.symbol,
        price: this.state.price,
        shares: this.state.shares,
        order_type: this.state.type
      }
      this.props.openModal('order');
      this.props.createOrder(order);
    }
}handleWatchClick(e) {
if (e.target.innerText === "Add To Watchlist") {
this.props.addToWatches({
symbol: this.props.stock.symbol
});
} else if (e.target.innerText === "Remove From Watchlist") {
debugger
this.props.removeFromWatches(
this.props.watches[this.props.stock.symbol].id,
this.props.stock.symbol
);
}
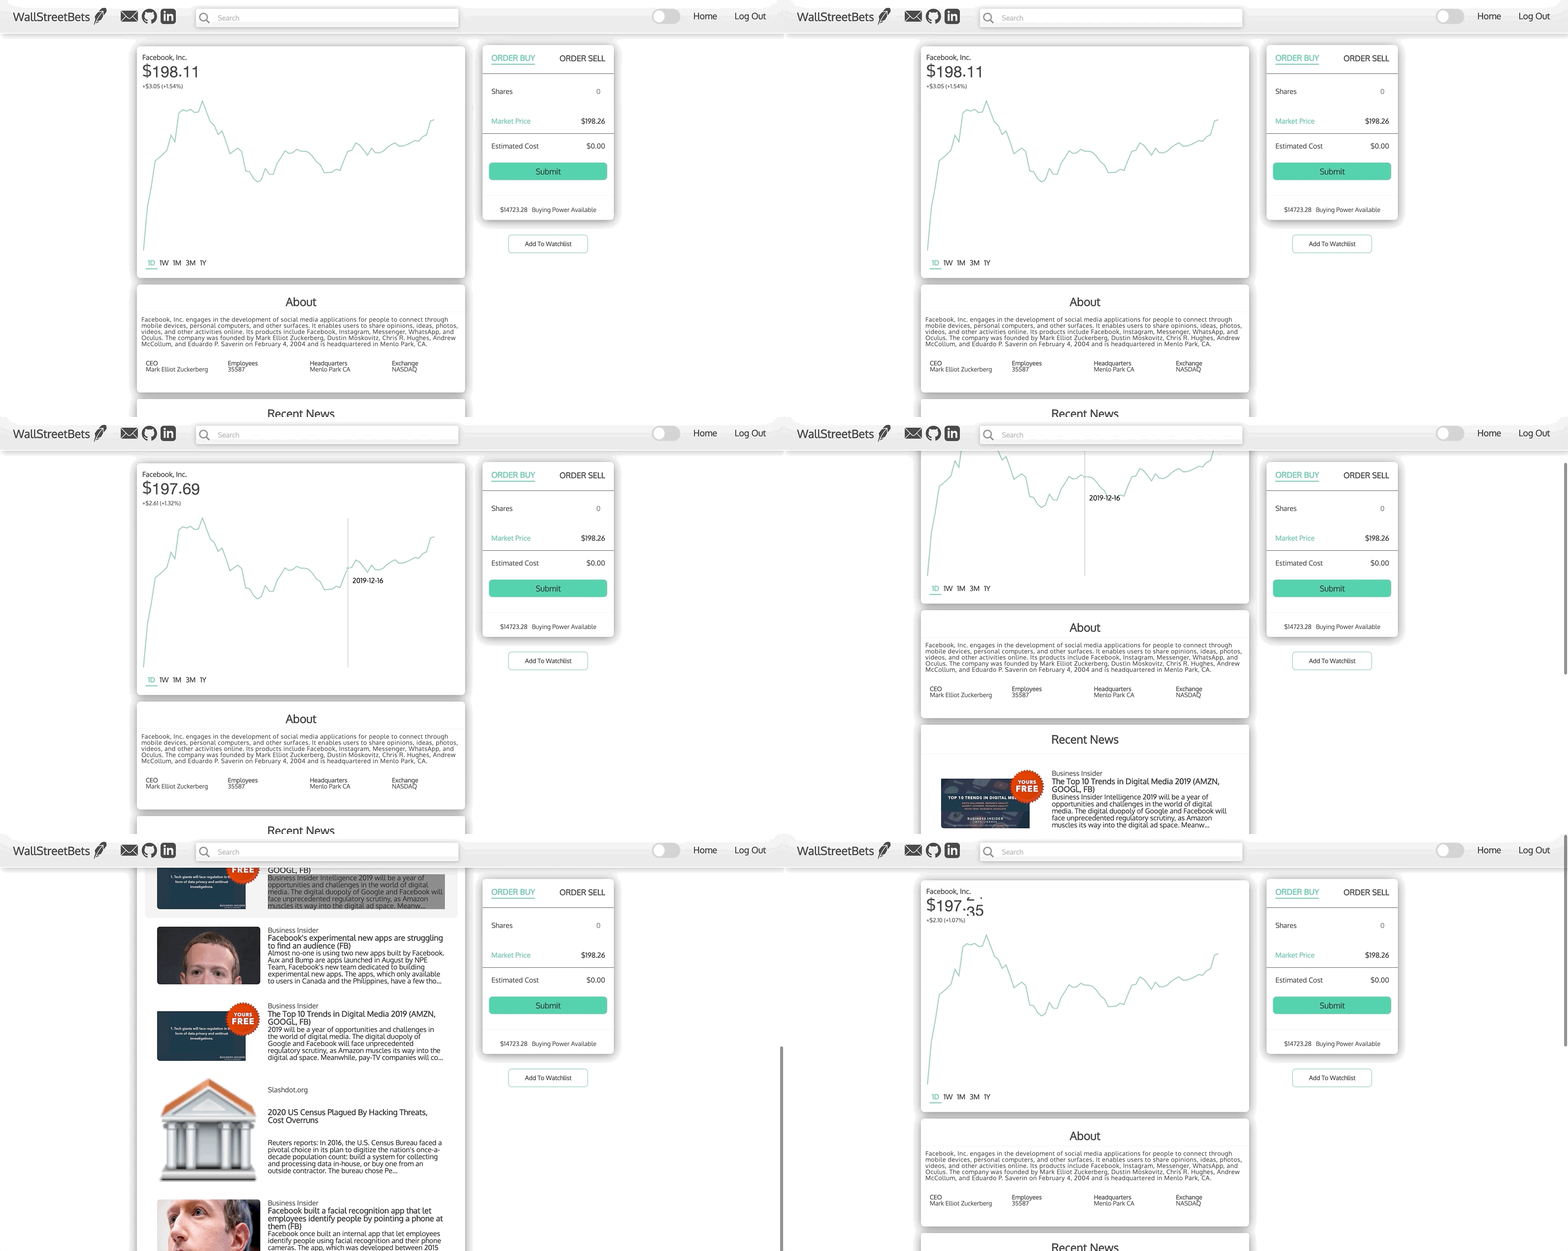
}The stock show page contains current and historical price information about the specific stock as well as general company information and relevant news. The order form allows the user to purchase and sell the stock at the most recent market price indicated. The chart is dynamically displayed by parsing historical information and colored elements; red and green are used to show a positive or negative price fluctuation over the given period.
When a page on the application is visited (Stock show, portfolio page), a variety of API calls are made from different endpoints; IEX Cloud and News API to fetch necessary information to the front end in order to be rendered by the user.
fetchStockIntradayData = symbol => dispatch => (
 StockAPIUtil.fetchStockIntradayData(symbol)
   .then( intradayData => dispatch(receiveStockIntradayData(symbol, intradayData)))
);

