The intersects relation is at the core of many geospatial operations. This project experiments with a few different permutations of JTS's prepared and regular geometry, with different geometry sizes for each.
mvn clean compile
mvn exec:exec
JTS has a concept of prepared geometries, which have some initial overhead of creation/indexing in tradeoff for faster relation operations (some - but intersects is one of the accelerated one).
So what kind of overhead are we looking at?
-----------------------------------------------
Sampled time to prepared geometry
Values are averaged for 100 repetitions
[NUM VERTICES] : [MSEC]  ± [RSD]
-----------------------------------------------
[100]          : 0.00167 ± 71.92%
[1,000]        : 0.00151 ± 100.72%
[10,000]       : 0.00087 ± 137.10%
[100,000]      : 0.00060 ± 89.96%
[1,000,000]    : 0.00180 ± 325.82%
[10,000,000]   : 0.00079 ± 473.74%
-----------------------------------------------
From this we can see that the time it takes to prepare a geometry (either with the PreparedGeometryFactory.create() method, or by the new method for PreparedGeometry) is pretty invariant with respect to number of vertices, at least up to 10,000,000 - and it's fast in an absolute sense as well. (units are in milliseconds).
My first stab at this involved generating random polygons for the test - which was fine in and of itself. Unfortunately I generated a new collection of random polygons every time I needed to increase the number of points. This resulted in some other factors influencing the results - specifically intersects with more points could actually run faster if the envelopes of the two geometries were disjoint.
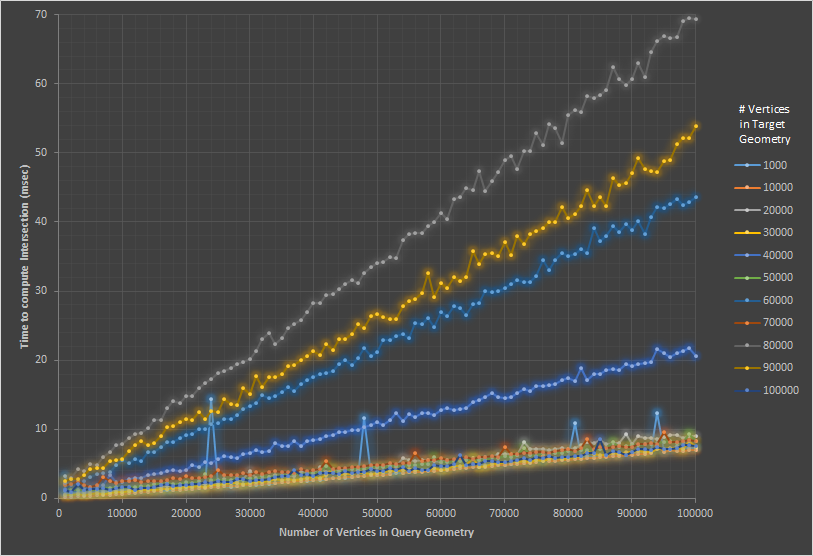
see the image below for an example fo the issue:
it doesn't make sense that a geometry with 80k vertices should take longer than a geometry with 100k vertices - which eventually lead to realization of the issues.
In order to correct this I generated a random colleciton of polygons (1000) once per run, and then in order to add more vertices I densified each polygon by a factor of 2 for each successive run. Basically a segment that looked like:
*-----------------------------*
became
*-------------*---------------*
then
*------*------*-------*-------*
etc.
The expectation is this should allow us to vary our data only on the number of vertices, and keep the shape relatively equivalent.
1000 random geometries were generated, and tested againt a randomly generated query region. For all tests the geometries and query region were kept the same - only the number of points was varied (as described above).
The average time to query each of the geometries was captured and reported as both a mean and relative standard deviation.
In the case of prepared geometry the PreparedGeometryFactor.create(Geometry g) method was used. Time measurements were taken immediately before and after the intersects call using System.nanoTime();
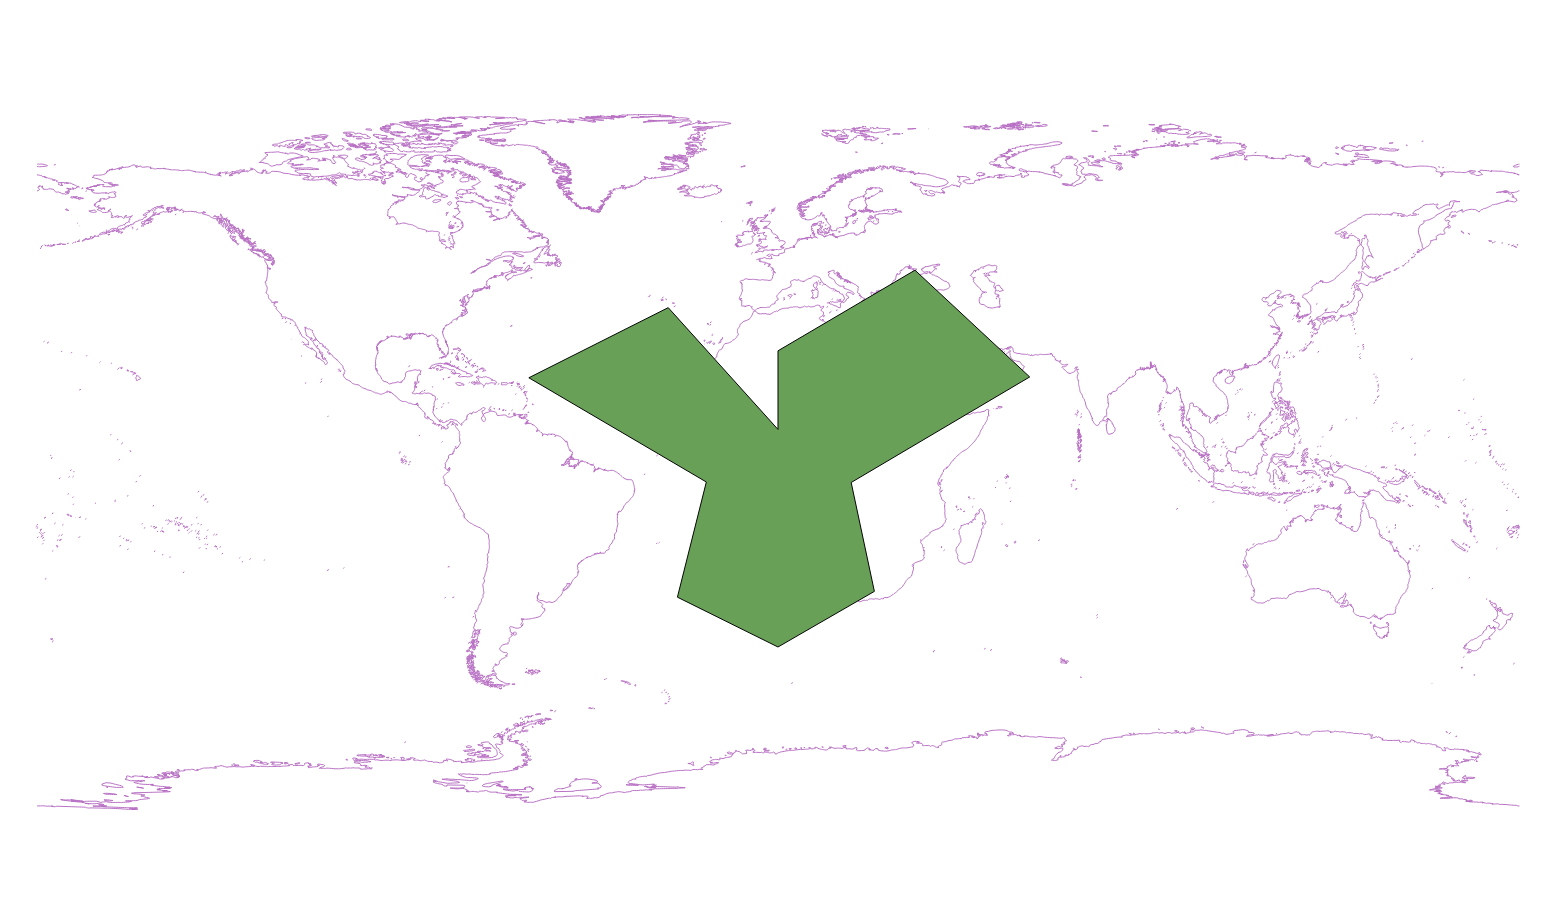
The query window for the data set looks like this:
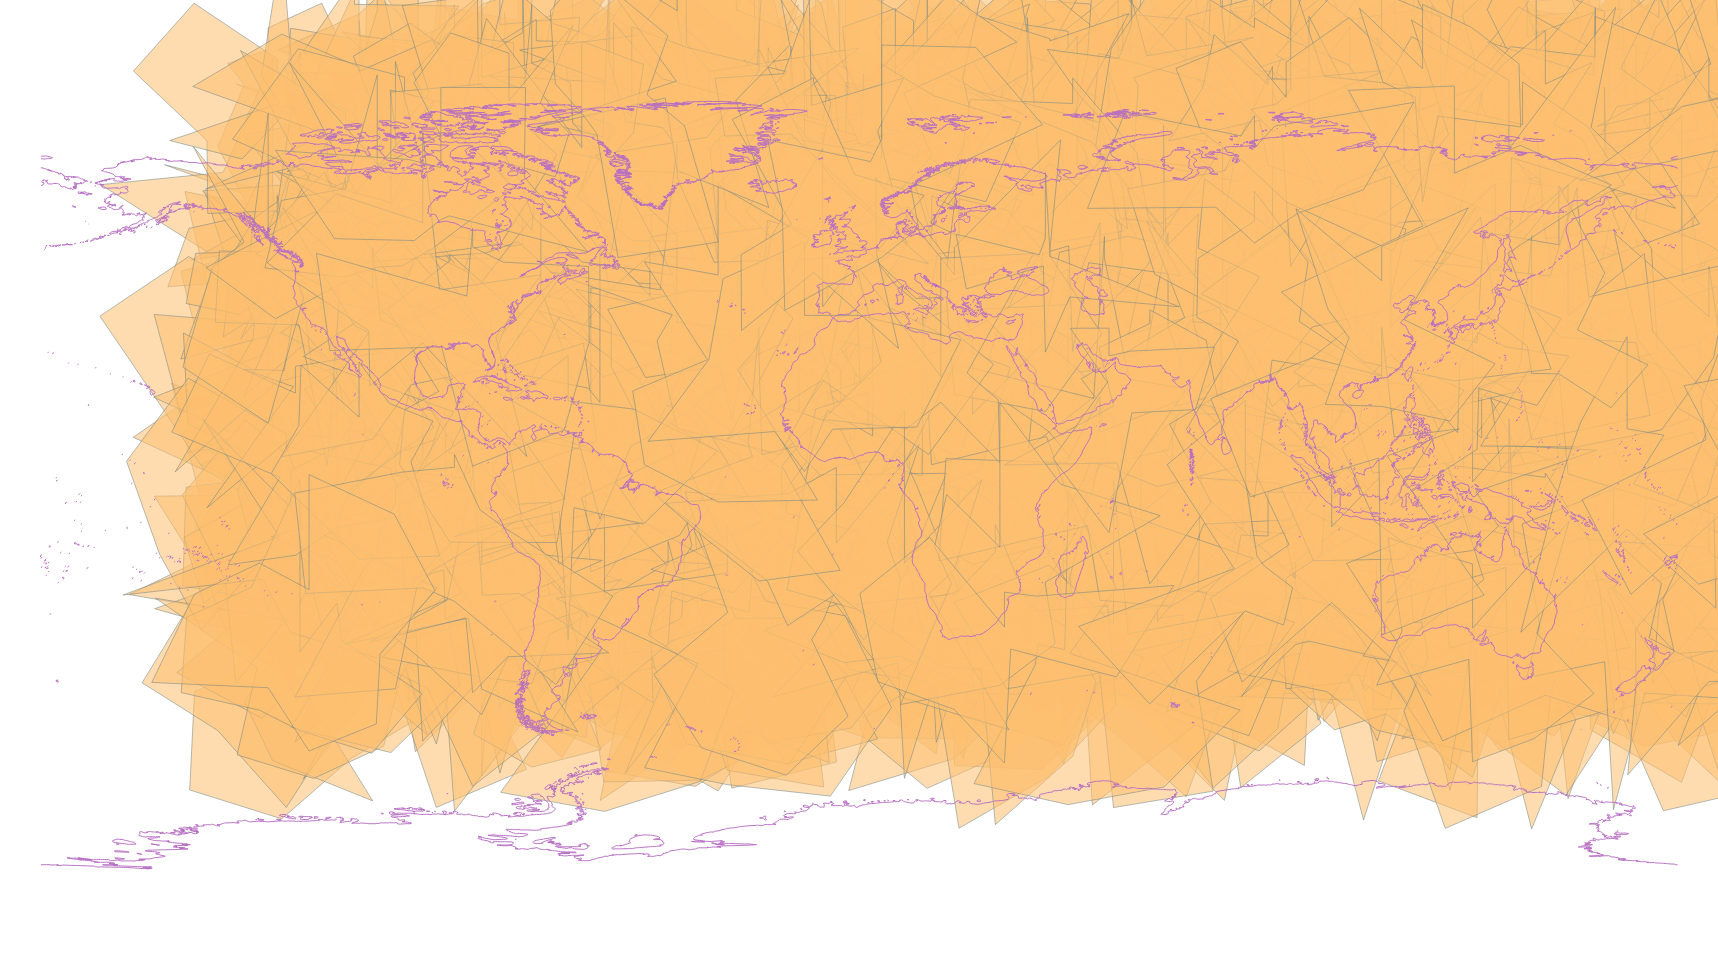
The target geometries (1000 of them at different densification levels) look like this:
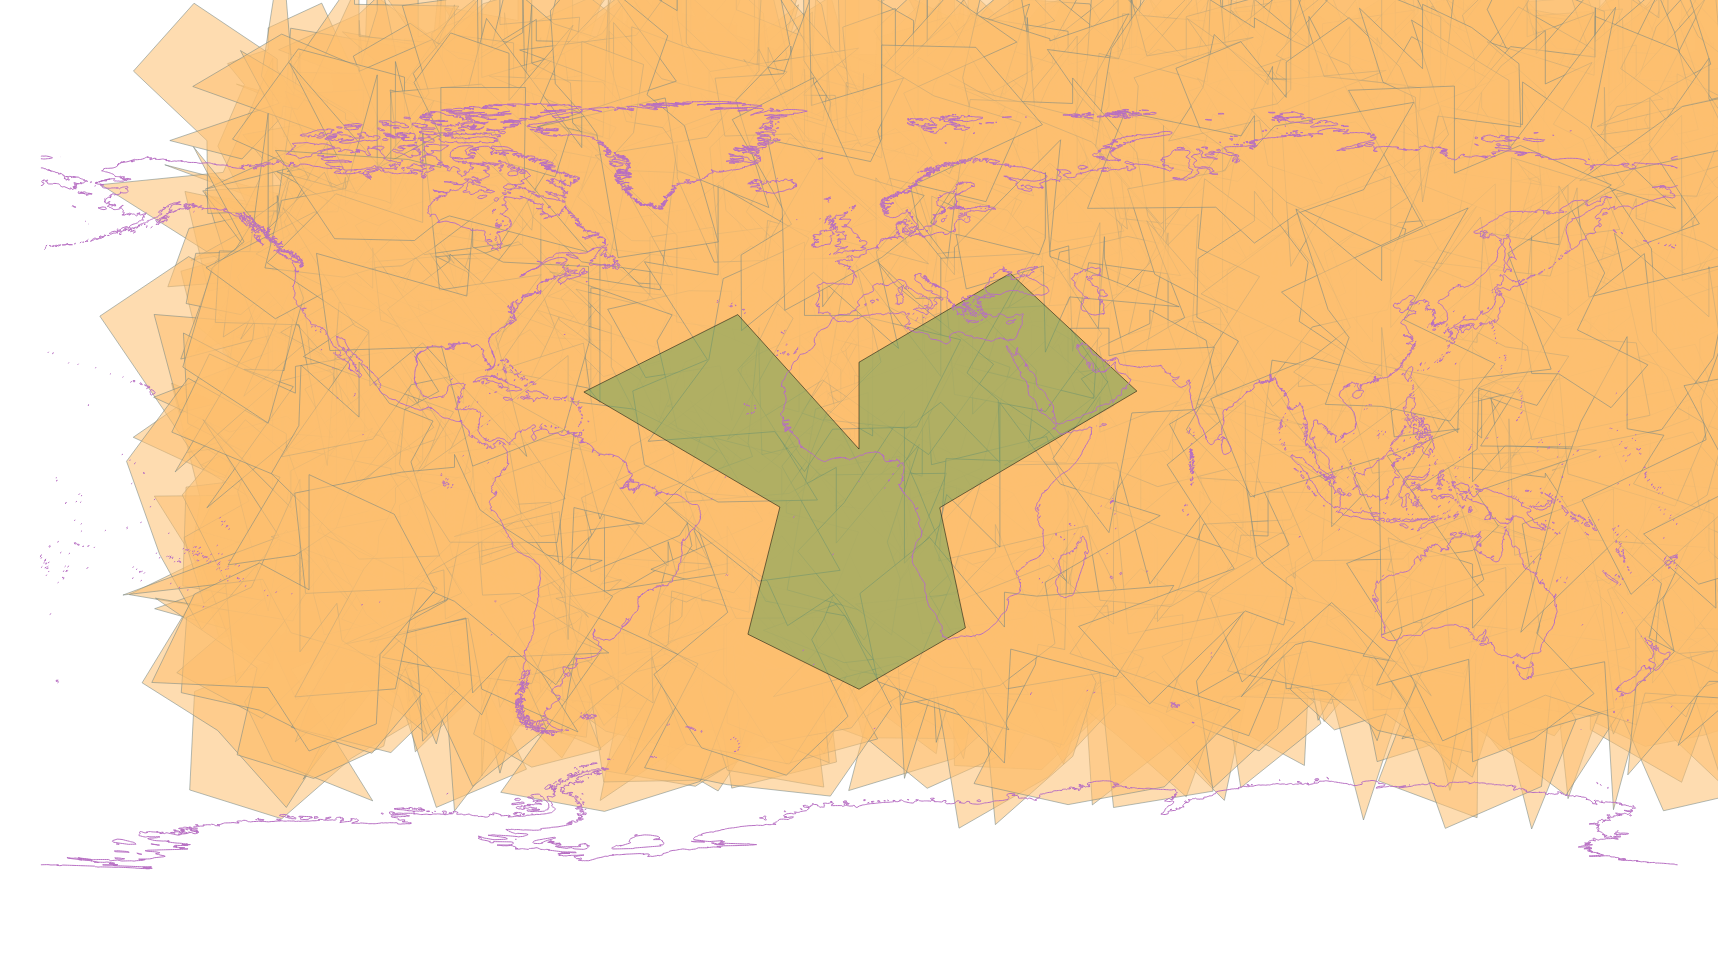
Both together look like this:
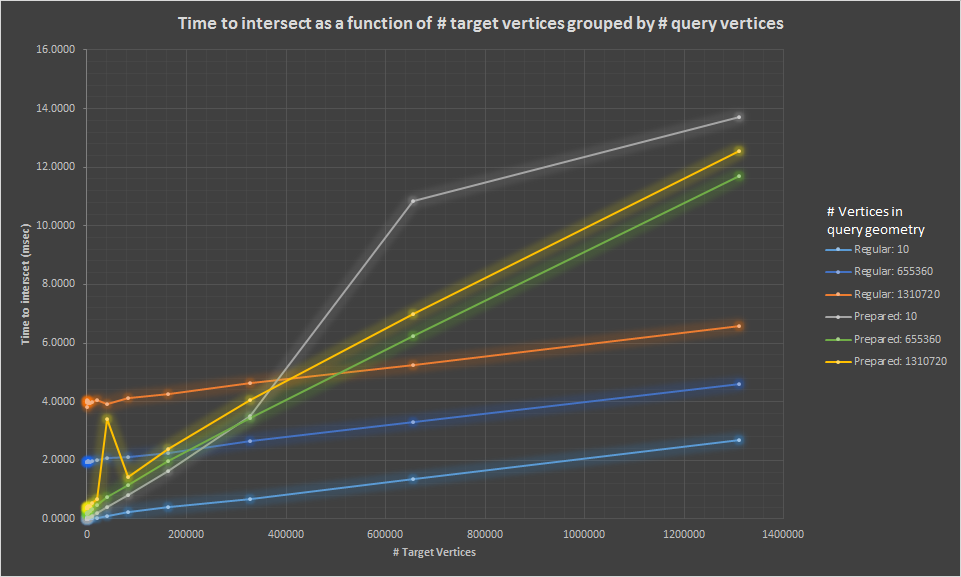
The first chart we have shows the time to intersects as a function of target verticies. There ar 6 series in the chart, and they represent the time regular and prepared geometries across a sampling of query geometry sizes.
We see first a few immediate trends.
- Despite the fact there are 5 orders of magnitude difference between Prepared: 10 and Prepared: 1,310,720 the time is fairly close. This indicates that for prepared geometries query time is mostly a function of target geometry size - which is what one would expect.
- Regular geometries scale pretty linearly with both target and query geometry size
- The plots intersect! This is significant in that, for a wide enough range of geometries, the choice to use a prepared or non prepared geometry does not always result in the same anwer.
- For a query geometry of 10 vertices the regular geometry is almost always faster
- For a query geometry of 1,310,720 vertices the prepared geometry is faster up until the target geometry hits ~ 500,000 vertices.
So there's obviously more to the story...
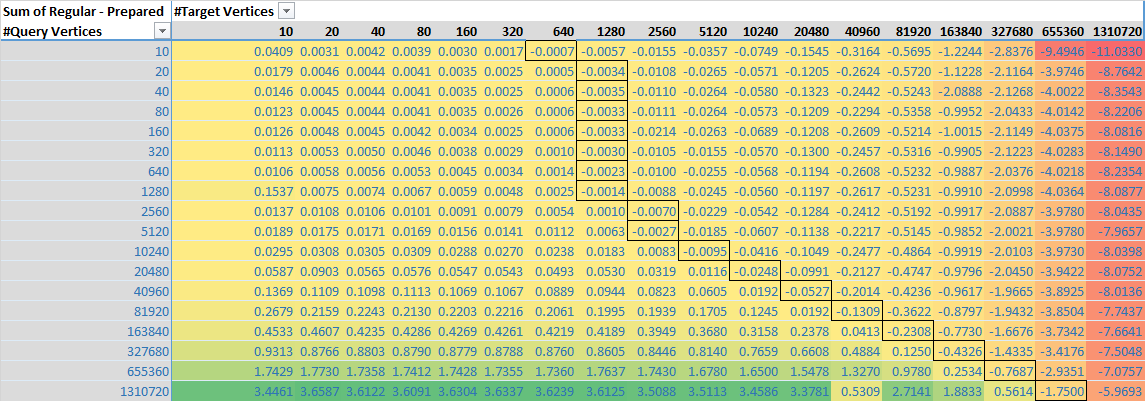
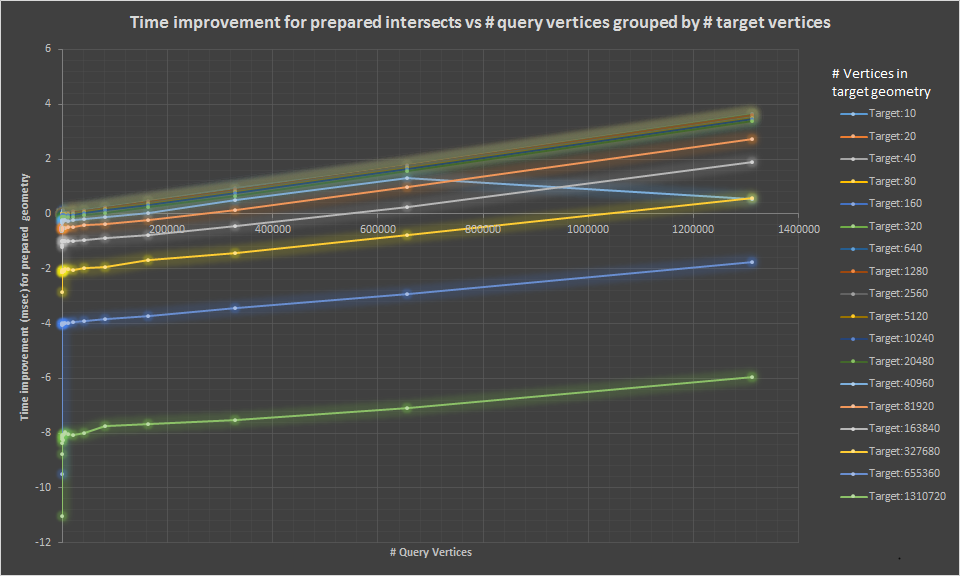
If we generate another data set that shows the difference (in msec) of regular vs prepared intersects time that might tell us a bit more. Here positive values (colored green) show places where the prepared geometry is faster. Negative values (colored red) show areas where the regular geometry is faster. Values are in msec.
The cells with the dark border show the rough inflection point (actually first negative value) - cells to the right of these represent configurations where the regular geometry is faster; cells to the left show configurations where the prepared geometry is faster.
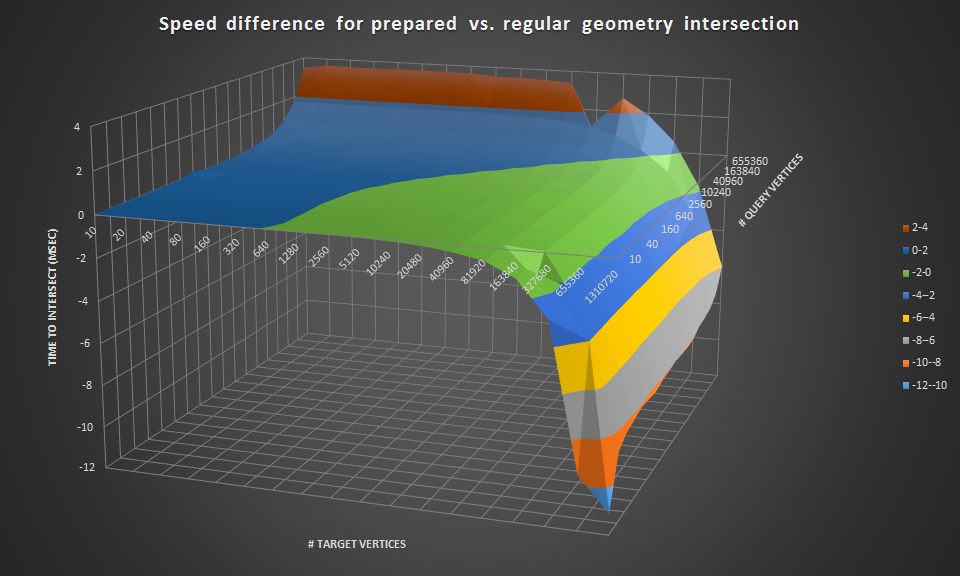
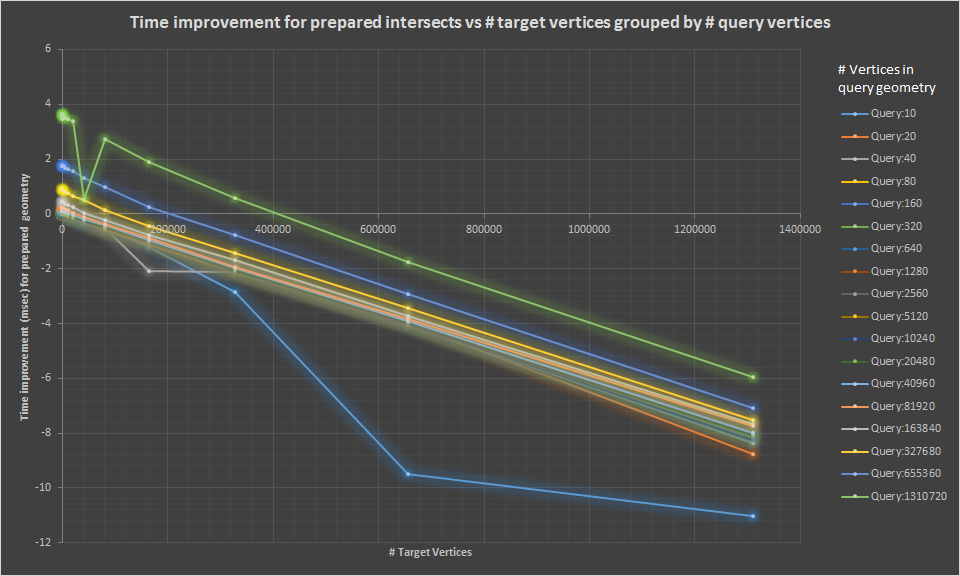
Here are some additional connected scatter plots that show the same data graphically
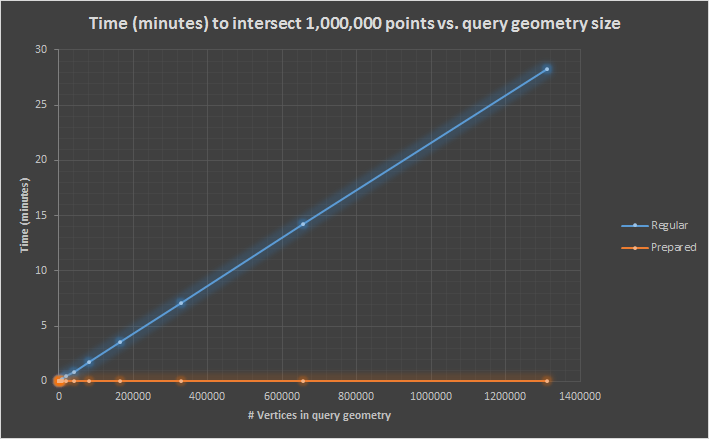
Points in polygon tests are a much clearer case. Here prepared geometries are always a net win
Regular (min/max):
| Query Vertices | Minutes for 1 mil geometries |
|---|---|
| 10 | 0.072951 |
| 1310720 | 28.31618 |
Prepared (min/max):
| Query Vertices | Minutes for 1 mil geometries |
|---|---|
| 10 | 0.00378 |
| 1310720 | 1.69770 |
Data file for regular intersection
Data file for prepared intersection
- Note - the setting of 1,310,720 max points required a heap size of 16gb. If you dont' have this reduce the max points to a value that fits.
Shapefile of query and target geometries
- Note this is only target geometries up to ~2800 points, and query geometries up to 360k points. Larger data sets can be generated with the supplied code, but the shapefiles become large quickly (360k point target collection is ~11GB uncompressed)
