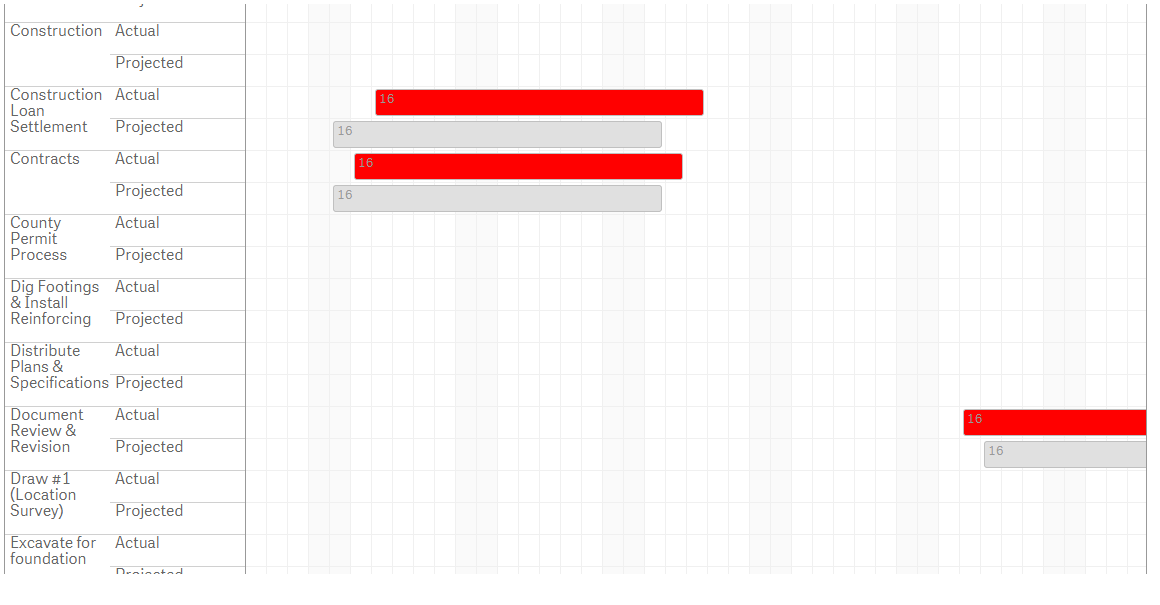
The Sense Gantt chart has been adapted from the jQuery-ganttView visualization here: https://github.com/thegrubbsian/jquery.ganttView
Currently you can specify the Projected Start/End dates and the Actual Start/End Dates in the dimensions as well as the name of the task and it will give you a Gantt layout with those 2 time series.
Get the QVF and Test data here (or get via git clone): https://github.com/chrislarsenqlik/GanttSense/tree/master/QVFandData
###Features:
- Display Projected/Actual Start/End dates in a gantt-style grid layout
- Mouseover the task and see the name and number of days
###Dimension/Measure configs:
- Dimension1: Task Name
- Dimension2: Actual Start Date field
- Dimension3: Actual End Date field
- Dimension4: Projected Start Date field
- Dimension5: Projected End Date field
###Shortcomings:
- Number of date types is not dynamic, currently can only have 2
- Scrolling not working properly
- Header row does not stay locked at the top
###TO DO:
- Make date series dynamic
- Fix scrolling & header row
**Any help on above ToDO's would be appreciated via Pull Request.
