The data I used for the analysis is from the 8a.nu dataset that can be downloaded on Kaggle. Analysis was done in Python using pandas. Visualization was done with pyplot.
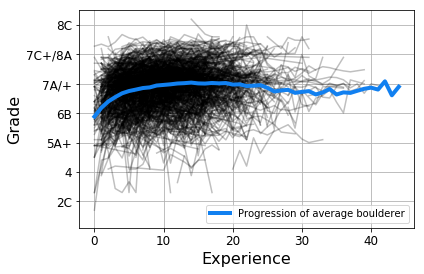
Analyse the progression of boulderers based on the average of the three hardest boulders each year. Experience is calculated as the difference between the year a user started climbing and the year of an ascent. The average progression of boulderers is presented in the following figure.
Climbers improve considerably in the first 4-5 years. After that, the progression slowly levels of. For climbers that climb for a long time, the average performance drops only slightly, but remains high.
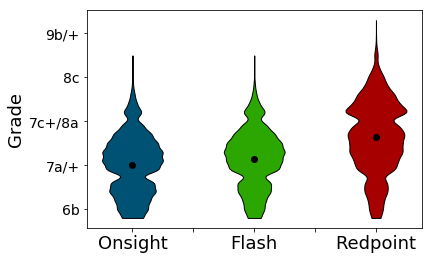
How much difference do different ascent methods have on the max grade climbers can climb?
- Onsight = climbed in first try without prior knowledge of the route
- Flash = climbed in first try with prior knowledge of the route
- Redpoint = climbed after x tries
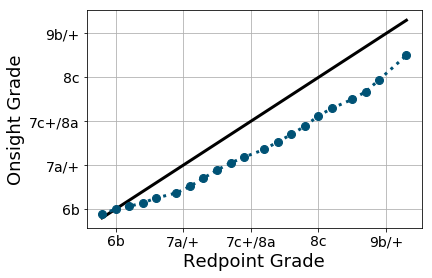
There is not much difference between onsighting and flashing a climb. Both are considerably harder than redpointing. This is also illustrated n the following figure.
The difference in diffulty is especially apparent for higher grades. For lower grades, the average onsight-level of climbers almost matches their redpoint level.


