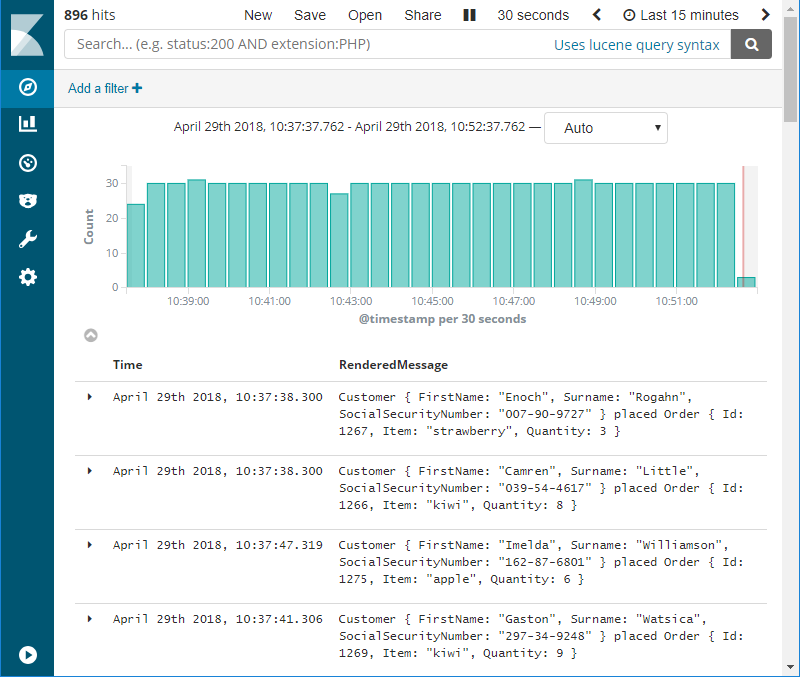
Elastic Stack is fantastic at collecting and visualizing log events. Serilog is fantastic at producing structured log events. This repository provides a sandbox where developers can explore the life of a log event starting with its birth in Serilog, its transport over the network to Logstash, its fields being indexed by Elasticsearch and finally its legacy being recorded as a historical event in Kibana.
With a running Elastic Stack and Serilog producing log events you are now ready to take it to the next level. If you fancy the producing part you'll dig deeper into Serilog and its configuration of log contexts, enrichers and message formatters. If you enjoy monitoring applications in production you'll explore Kibana with its visualizations and dashboards.
Start the stack using docker-compose:
PS> cd .\elastic-stack\
PS> docker-compose up
If this is the first time the stack is started, you'll have to create a Logstash index pattern. Give the stack some time to initialize and then run the following commands in PowerShell:
PS> $Headers = New-Object "System.Collections.Generic.Dictionary[[String],[String]]"
PS> $Headers.Add("Content-Type", "application/json")
PS> $Headers.Add("kbn-version", "6.8.0")
PS> Invoke-RestMethod "http://localhost:5601/api/saved_objects/index-pattern" `
      -Method Post `
      -Headers $Headers `
-Body '{"attributes":{"title":"logstash-*","timeFieldName":"@timestamp"}}'Run the following commands to publish log events to Logstash using Serilog:
PS> cd .\serilog\
PS> docker-compose upAccess the Kibana web UI by hitting http://localhost:5601 with a web browser.
Start the stack using docker-compose:
$ cd elastic-stack/
$ docker-compose up
If this is the first time the stack is started, you'll have to create a Logstash index pattern. Give the stack some time to initialize and then run the following commands:
$ curl -XPOST -D- 'http://localhost:5601/api/saved_objects/index-pattern' \
    -H 'Content-Type: application/json' \
    -H 'kbn-version: 6.8.0' \
-d '{"attributes":{"title":"logstash-*","timeFieldName":"@timestamp"}}'Run the following commands to publish log events to Logstash using Serilog:
$ cd serilog/
$ docker-compose upAccess the Kibana web UI by hitting http://localhost:5601 with a web browser.
The elastic-stack directory is a clone of docker-elk with minor modifications. Credit to deviantony for publishing the Elastic Stack boilerplate.
