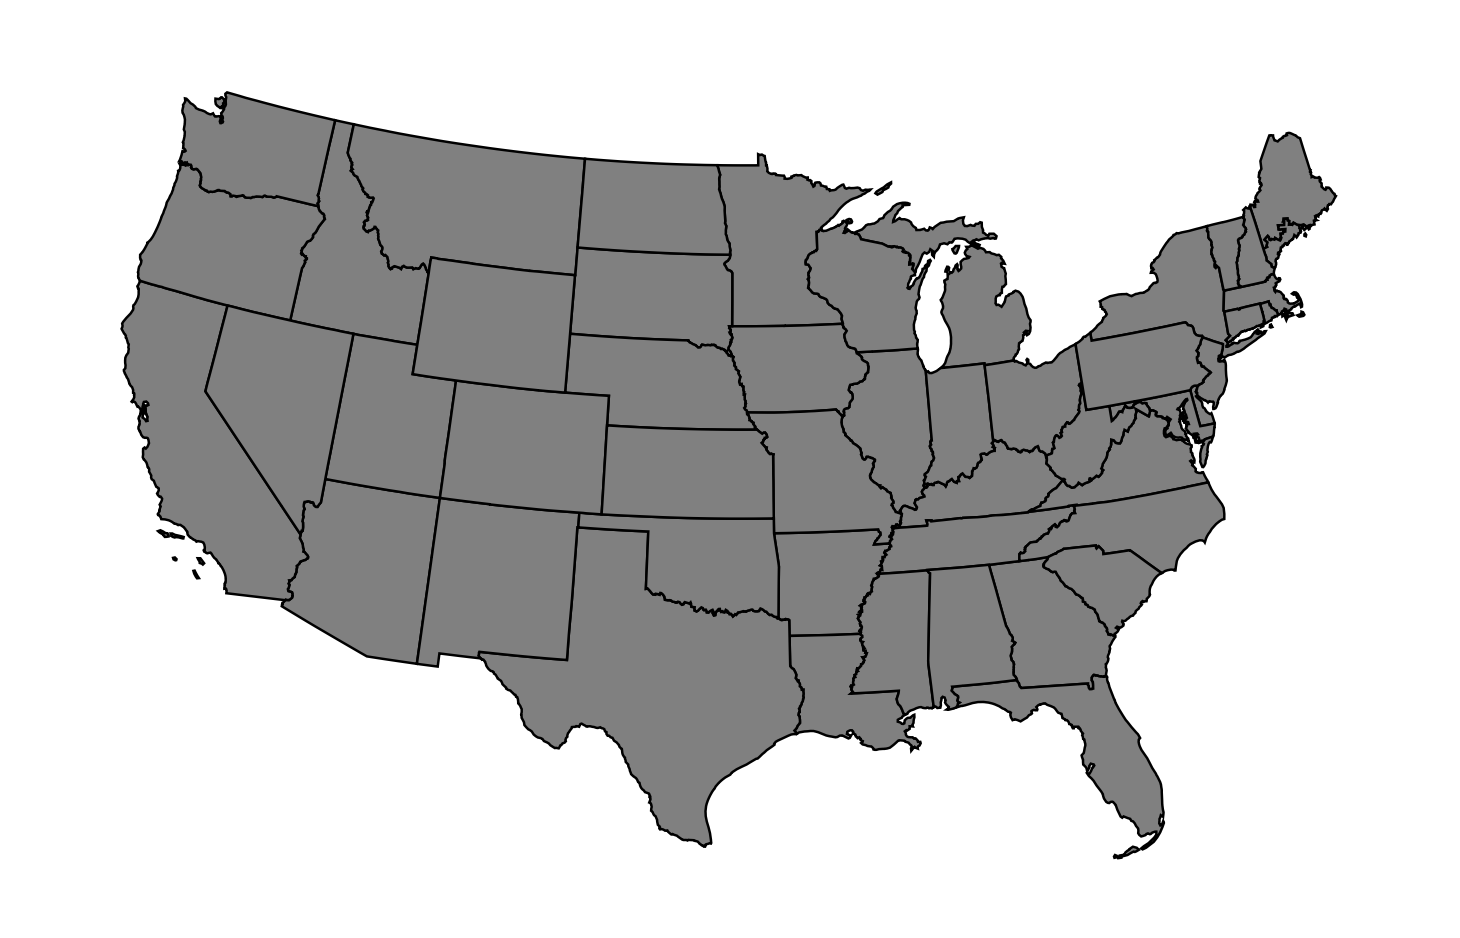
We present a fast cartogram generator written in C. It uses the flow-based algorithm devised by Gastner, Seguy & More.
This readme explains how to set up and use this software. In doing so, it uses data from the United States presidential election, 2016. This data is included in the repository.
Note: Any images generated using this software should be referenced to:
Gastner, M., Seguy, V., & More, P. (2018). Fast flow-based algorithm for creating density-equalizing map projections. Proceedings of the National Academy of Sciences USA, 115:E2156-E2164.
BibTeX Entry:
@article{gastner_seguy_more_2018,
	title={Fast flow-based algorithm for creating density-equalizing map projections},
	author={Gastner, Michael T. and Seguy, Vivien and More, Pratyush},
	DOI={10.1073/pnas.1712674115},
	journal={Proceedings of the National Academy of Sciences of the United States of America},
	year={2018},
	volume = {115},
	number = {10},
	pages = {E2156--E2164}
}
The cartogram expects two input files:
-
a
.genfile containing the Cartesian coordinates for the map regions under consideration. For example, for the 2016 US presidential election data we provideusa_low48splitME_conic.gen(in thesample_datafolder) which includes the coordinates for the boundaries of the different states. Here is a description of the file format. The content of the file is in the left block of text. The right block of text is a line-by-line explanation that is not part of the.genfile.2302 Maine02 ID for region followed by optional description. 0.302204 -0.188090 Pairs of x-, y-coordinates. Orientation along 0.302716 -0.187835 outer boundaries must be clockwise. If a ... polygon has a hole, the inner boundary must be 0.303897 -0.193159 anticlockwise. 0.302204 -0.188090 Regions are not permitted to overlap. This is END *not* checked by this code! 2301 Maine01 0.333358 -0.200693 ... 0.333358 -0.200693 END 2301 Maine01 IDs can repeat if a region consists of 0.334699 -0.204771 multiple polygons. ... 0.334699 -0.204771 END Each polygon terminates with END. END One more END signals the end of the file. -
a
.datfile containing the data (such as population) for each region, according to which these will be scaled. For the 2016 US presidential election data we provideusa_electors.dat(also in thesample_datafolder) which provides the number of electors for each state.
You must have Xcode Command Line Tools and the brew package manager installed (and updated) on your computer.
No additional dependencies. Your default apt-get package manager should work fine.
-
Open a terminal, clone the repository, and navigate to its root directory.
-
Run the provided automatic build script (you may need to grant sudo priveleges):
chmod a+x autobuild.sh && ./autobuild.sh
- You should have an executable by the name of
cartogramin your root directory.
Note: If you run into issues, look at the Troubleshooting section below.
-
Navigate to the directory with the
cartogramexecutable. By default, this should be the root directory of the project. -
Run the executable using the following command format:
./cartogram <.gen file> <.dat file>
For the provided 2016 US presidential election data, run the following command:
./cartogram sample_data/usa_low48splitME_conic.gen sample_data/usa_electors.dat
Note: In our repository, we also include data for India and China's GDP, segmented by their states/provinces.
To generate the India GDP cartogram, run:
./cartogram sample_data/india_noLD_conic.gen sample_data/india_gdp.dat
To generate the China GDP cartogram, run:
./cartogram sample_data/china_withSARandTWN_conic.gen sample_data/china_gdp.dat
- You should see two generated files -
map.epsshowing the original map, andcartogram.epsshowing the generated cartogram.
On macOS, open using
open <filename>.eps
On Linux, open using
evince <filename>.eps
Replace <filename> with the name of the file (map or cartogram) you wish to open.
For our 2016 US election example, map.eps should look like:
cartogram.eps should look like:
If you see the following line in your output, you may want to take a look at this solution. Once you have implemented the solution from the link, follow the standard build instructions above.
FATAL:/opt/local/bin/../libexec/as/x86_64/as: I don't understand 'm' flag!
In case you run into problems while building the generator using the automated script, you could try manually carrying out some of the steps.
- Install fftw and gcc.
brew install fftw && brew link fftw
brew install gcc
-
Note down the version of
gccinstalled. For example, ifgcc-7.1.0is installed, your version would be7(not 7.1.0). -
Go into the source code directory and open the
Makefile.
cd cartogram_generator
vi Makefile
-
Change the line
CC = gcctoCC = gcc-[your-version-number]where 'your-version-number' is the number you noted above. Then save the file using the vi command:wq. -
Go back to the root directory.
cd ..
- Run the remaining steps.
chmod a+x scripts/semi_autobuild.sh && scripts/semi_autobuild.sh
- Make sure everything is up to date. Then install fftw and gcc.
sudo apt-get update
sudo apt-get install libfftw3-3 libfftw3-dev
sudo apt-get install build-essential
- Make sure you are in the root directory, and then run the remaining steps.
chmod a+x scripts/semi_autobuild.sh && scripts/semi_autobuild.sh


