A tool to calculate and visualize persistence diagrams and its optimal cycles in the point cloud.
The following packages are needed to use the tool
- optiperlsp (can be downloaded here: https://bitbucket.org/remere/optiperslp/)
- python3.5 or above
- bokeh
The application is available online in this website.
The file input is a csv file with 4 columns, no header, the first three columns are the xyz coordinates
and the last coordinate is the radius of each point for the alpha shape filtration. It can be a
zero column. See the file sample.csv for an example.
Download the script files and save them in a folder called 3dPD. In the directory above this folder, run the following command
bokeh serve 3dPDAfter that there will be a local server running at http://localhost:5006/3dPD. The following page will open
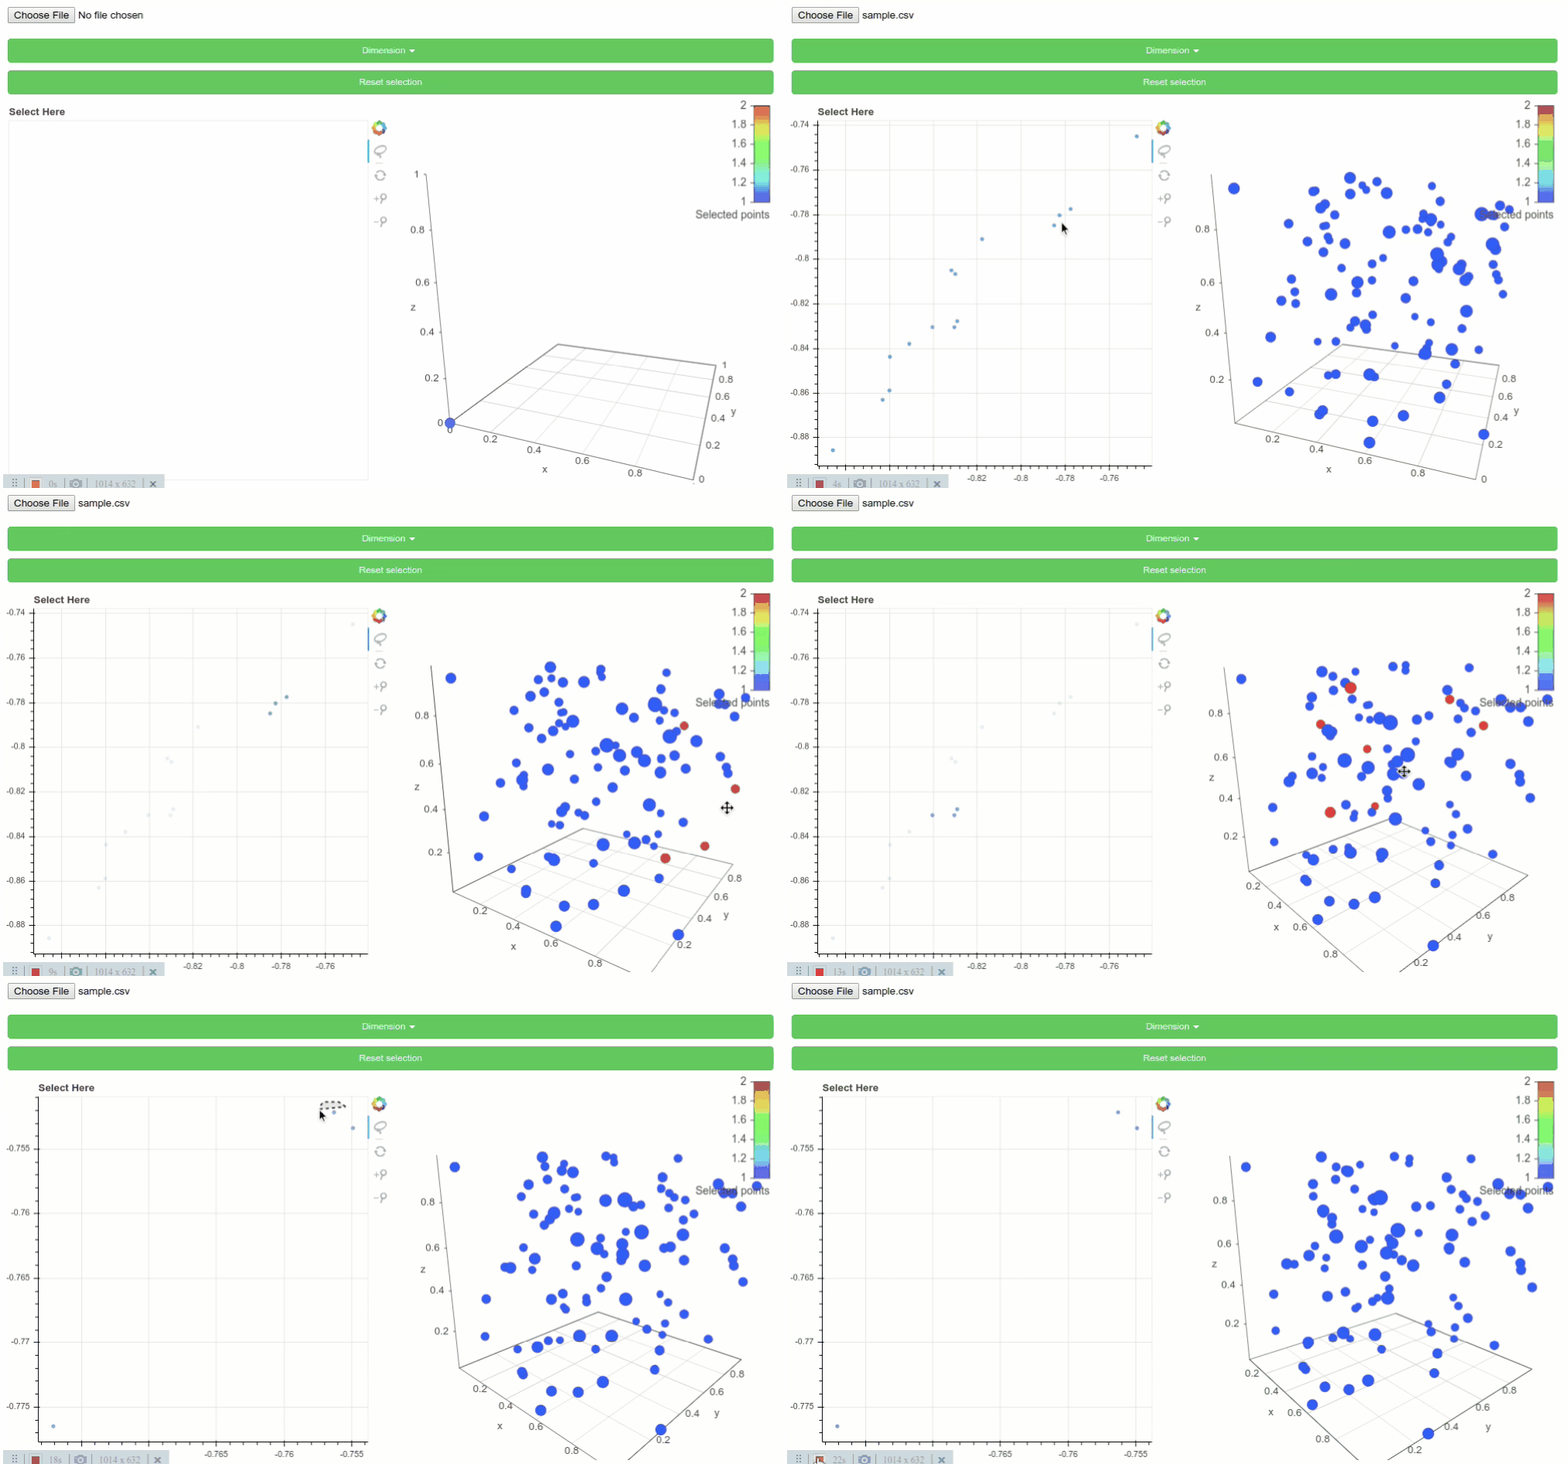
This web app accepts only csv files. Each file should contain 4 columns, the first three are the xyz coordinates and the last coordinate is the radius for the weighted alpha shape filtration (thus it can be a zero column). You can then select the dimension of the persistence diagram to be calculated, 1 or 2. After that, the corresponding persistence diagram will be ploted on the left and the coordinates on the right.
For each point in the persistence diagram there is an optimal cycle associated. You can visualize the vertices of each optimal cycle in the point cloud by selecting the points in the persistence diagram with the lasso tool (default). See gif below for an example.

