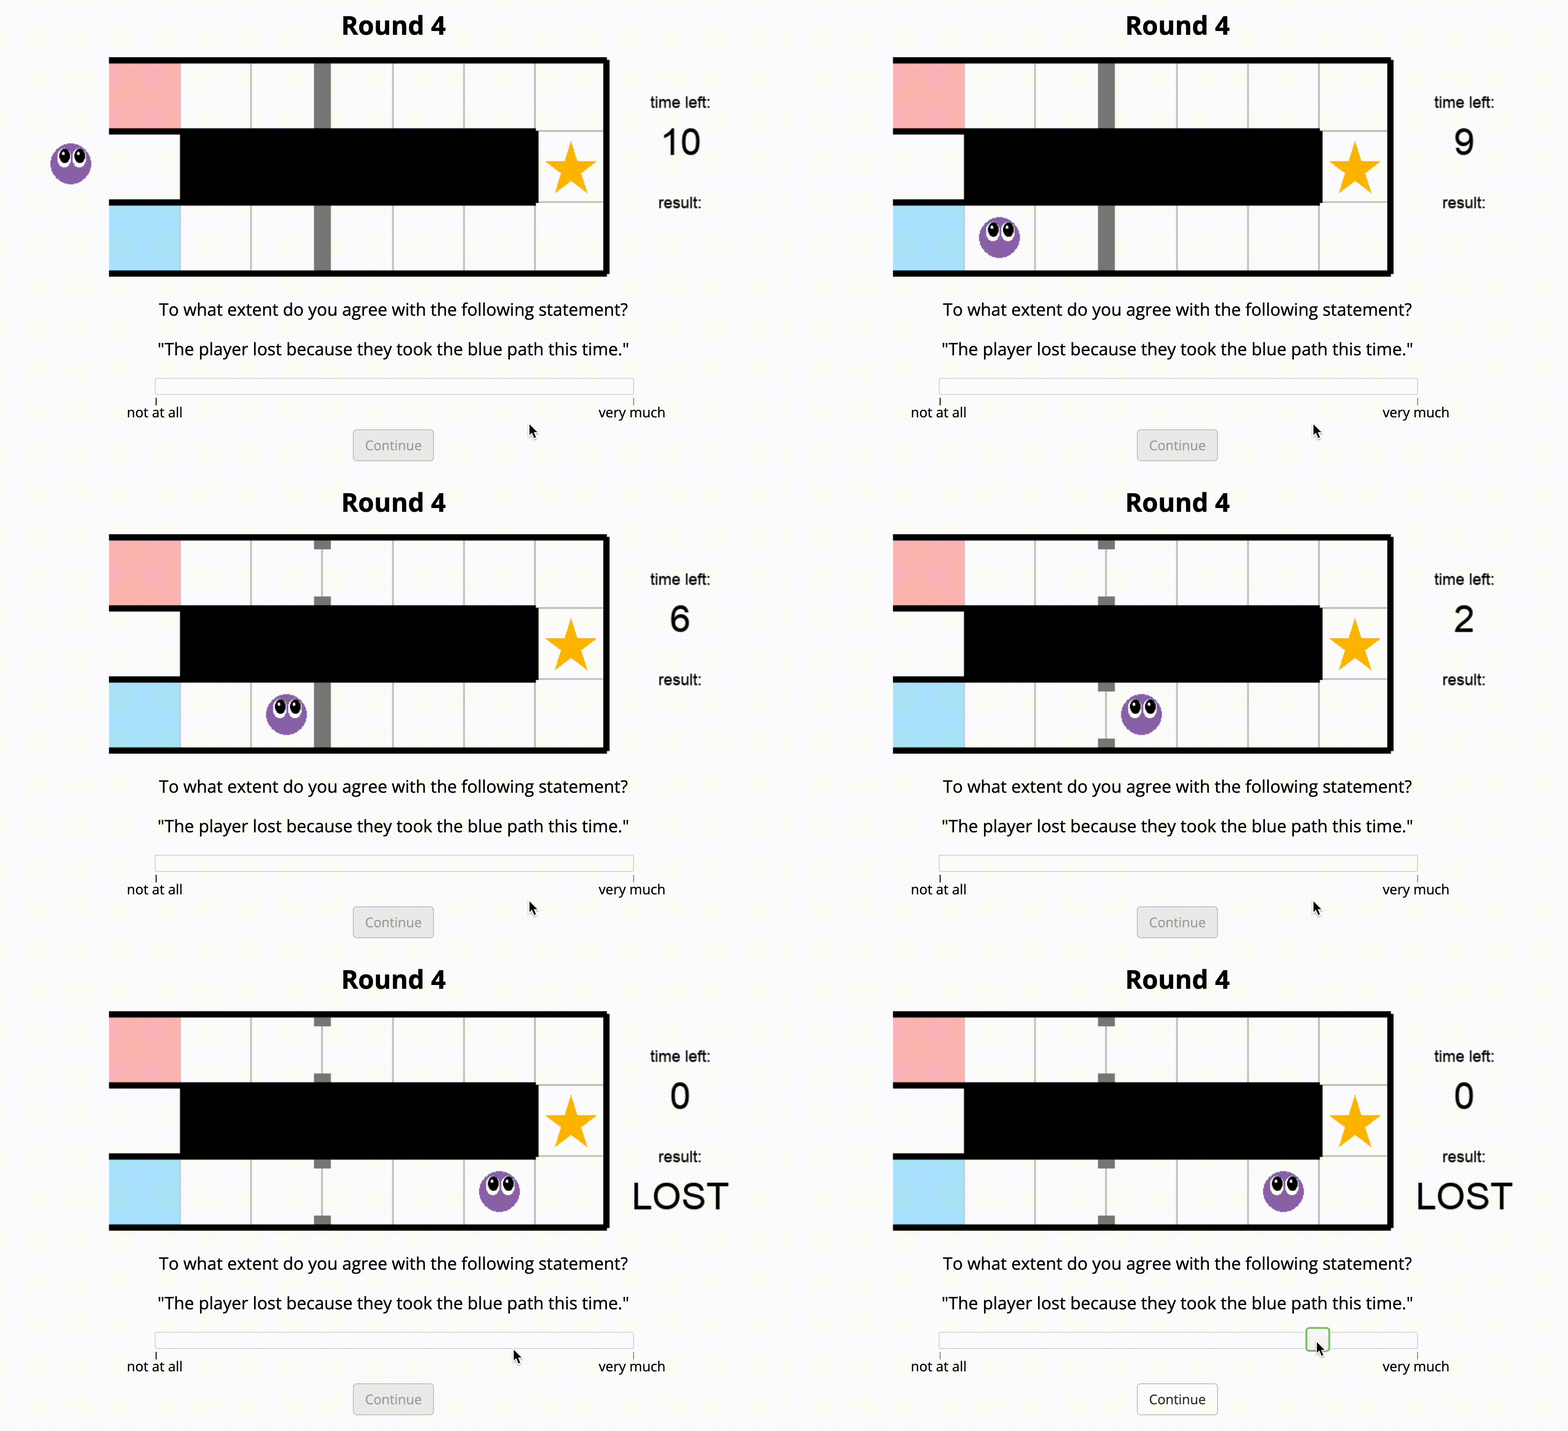
This repository contains the models, experiments, data, analyses, and figures for the paper "That was close! A counterfactual simulation model of causal judgments about decisions" by Sarah A. Wu, Shruti Sridhar, and Tobias Gerstenberg.
Presented at the 44th Annual Conference of the Cognitive Science Society (CogSci 2022), and published in the Conference Proceedings.
@inproceedings{wu2022that,
  title = {That was close! {A} counterfactual simulation model of causal judgments about decisions},
  booktitle = {Proceedings of the 44th {Annual} {Conference} of the {Cognitive} {Science} {Society}},
  author = {Wu, Sarah A. and Sridhar, Shruti and Gerstenberg, Tobias},
  year = {2022},
  pages = {3703--3710},
}
Contents:
How do people make causal judgments about other people's decisions? Prior work in psychology has argued that causal judgments are closely linked to counterfactual simulations. Accordingly, judging causation requires going beyond what actually happened and simulating what would have happened if things had played out differently. In the physical domain, recent work has shown how such a counterfactual simulation model accurately captures people's judgments about dynamic physical events. Here, we extend this model to explain people's causal judgments about other agents' decisions. We develop a novel experimental paradigm in which an agent needs to choose what path to take in order to reach a goal. The paths feature doors that can open and close over time. In Experiment 1, one group of participants made hypothetical judgments about whether the agent would succeed were it to take a certain path, and another group made counterfactual judgments about whether the agent would have succeeded had it taken a different path. In Experiment 2, participants made causal judgments about whether the agent succeeded or failed because of the path that it took. Our computational model accurately captures participants' judgments in both experiments and, in line with what has been shown in the physical domain, we find that causal judgments are better explained by counterfactual rather than hypothetical simulations.
├── code
│   ├── R
│   ├── experiments
│   └── python
├── data
├── docs
└── figures
code/R/contains all the code for analyzing data and generating figures (see a rendered file here).experiments/contains model predictions and info about the experiment trials.python/contains all the code for our environment and simulation models (see usage details below).
data/contains anonymized data from both experiments. For each experiment,participants.csvcontains demographic information and post-experiment feedback/comments from participants, andtrials.csvcontains the actual judgment data.docs/contains all the experiment code. You can preview the experiments below:figures/contains the two figures from the paper (generated using the script incode/R/) as well as gifs and still images of all the experiment trials.
Make sure you're in the code/python/experiment/ directory and can see main.py.
This is the primary file for generating trials and running the simulation models.
The basic command structure for running the models on a specific trial is:
python main.py --generate-trials --trial <trial> --cf --hyp
where <trial> is the trial number from 1 to 18. This flag can be left off to run all 18 trials.
--cf and --hyp indicate running the counterfactual and hypothetical simulation models, respectively.
Both, neither, or just one of these flags can be included.
For example, the command to run only the counterfactual model on all 18 trials is:
python main.py --generate-trials --cf
Other flags that can be added:
--visualizewill generate step-by-step images and a gif of the specified trial (or all trials), which will be saved intrials/under the corresponding trial number. However, don't visualize and run any models in the same command or pygame will break.--verbose(while running a model) will print out step-by-step information about each simulation as it's running, which can be useful for debugging.--save-trial-datawill record the outcomes and simulation results incode/experiment/experiment.csv. Note that this will override the current file.--n-simulations <n>specifies the number of simulations to run, default 1000.--prob-stall <p>specifies the probability that the agent stalls on any time step, default 0.12 (fitted to data).--prob-door <p>specifies the probability of a door switching on any time step, default 0.19 (fitted to data).--time-limit <t>specifies the maximum number of time steps in each trial, default 10.
The command --make-image can be used to generate and save an image of the gridworld
for a specific trial, in the grid_images/ directory:
python main.py --make-image --trial <trial>
This can be helpful especially if you want to modify any of the current grids
or create a new one and see what it looks like.
All the gridworlds are located in grids/ as text files. Each file has two parts separated by an empty line:
- The initial states of each door as
0(closed) or1(open) with each door on its own line. - The grid, which gets parsed into gridworld objects:
randb--> red and blue start squaresg--> goal square.--> placeholder divider between two floor squares|--> vertical door between two floor squaresX--> inaccessible square
For example, the code below on the left implements the grid on the right with two initially closed doors.
Door state changes are defined in code/experiment/experiment.json. Each JSON string contains:
"num": the trial number (1to18)"path": the path chosen ("red"or"blue")"door_changes": list of door state changes expressed as another JSON string with time steps as properties and a list of locations of doors that will switch states on that time step as values. Doors are marked by the square immediately to their left with the origin at the top left. For example, the two doors in the grid above are located at (5, 0) and (5, 2) and{"2": [[5, 0], [5, 2]]}means that both would open on the second time step.
Feel to make your own grids and trials, and test the simulation models on them!

