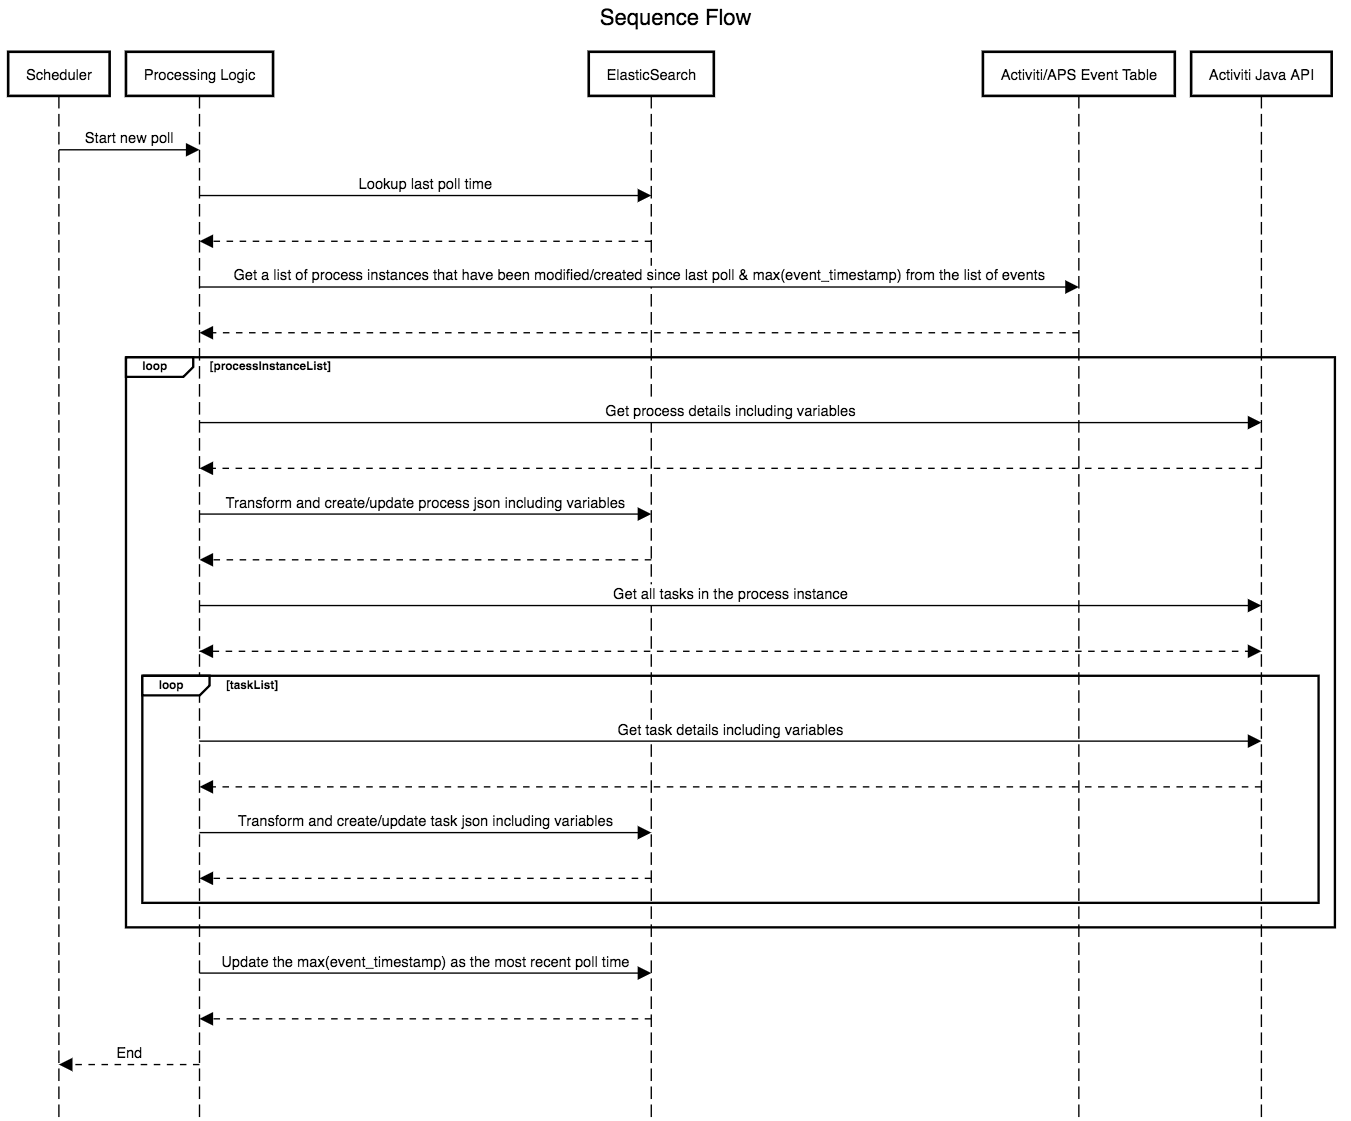
Please find below the solution diagram. The source of the diagram created using sequencediagram.org can be found here

Activiti must be running with both history and events turned on to have analytics data
-
Change the application.properties to match your activiti installation
-
Currently tested only against Activiti running on H2, Oracle, MySQL or Postgres databases.
-
Important: Depending on the database you are using for activiti, the data column definition in com.alfresco.activiti.analytics.entity.ActivitiEventAbstract will need to be adjusted as shown below
/* For PostgresSQL use the following */ @Column(name = "data_", columnDefinition = "clob") private byte[] data; /* For other DBs (tested for H2 & Oracle) use the following */ @Column(name = "data_") @Lob private byte[] data; -
If you are using Oracle DB, do the following to include oracle jdbc driver Download the Oracle jdbc driver and run the following commands to add driver to your local maven repository and aasociated pom.xml entry.
mvn install:install-file -DgroupId=<groupId> -DartifactId=<artifactId> -Dversion=<version> -Dpackaging=jar -Dfile=<jar-file-name and location> -DgeneratePom=truemvn install:install-file -DgroupId=com.oracle.jdbc -DartifactId=ojdbc8 -Dversion=12.2.0.1 -Dpackaging=jar -Dfile=ojdbc8.jar -DgeneratePom=true<dependency> <groupId>com.oracle.jdbc</groupId> <artifactId>ojdbc8</artifactId> <version>12.2.0.1</version> </dependency> -
If using MySQL, follow the instructions provided here
-
Run using the following command
mvn clean spring-boot:run -
Running using the packaged jar
mvn clean packagejava -jar target/activiti-analytics-spring-boot-1.0.0-SNAPSHOT.jar -
Create a docker network
docker network create mydockernetwork -
Run using docker (run command is just an example, adjust as per your env)
mvn clean packagedocker build -t activiti-analytics-spring-boot .docker run --name aps-analytics -v /tmp/activiti-analytics-spring-boot/confs:/conf --rm --net mydockernetwork activiti-analytics-spring-boot -
Prerequisite - Elasticsearch must be started prior to starting this app. Easiest way is to get it up and running is using Elastic docker.
docker run --name elasticsearch -p 9200:9200 -e "http.host=0.0.0.0" -e "transport.host=127.0.0.1" -e "xpack.security.enabled=false" --net mydockernetwork docker.elastic.co/elasticsearch/elasticsearch:6.2.4
- Easiest way to start an instance of Kibana is using docker!
docker run --name kibana-6.2.4 --net mydockernetwork -e XPACK_SECURITY_ENABLED=false -p 5601:5601 docker.elastic.co/kibana/kibana:6.2.4
-
Once you have Kibana running open http://localhost:5601/ (default host and port of Kibana unless you changed it) in your browser.
-
Run few processes in APS to make sure we have some data in Elasticsearch to create some dashboards. if you miss this step, you won't be able to create the following steps!
-
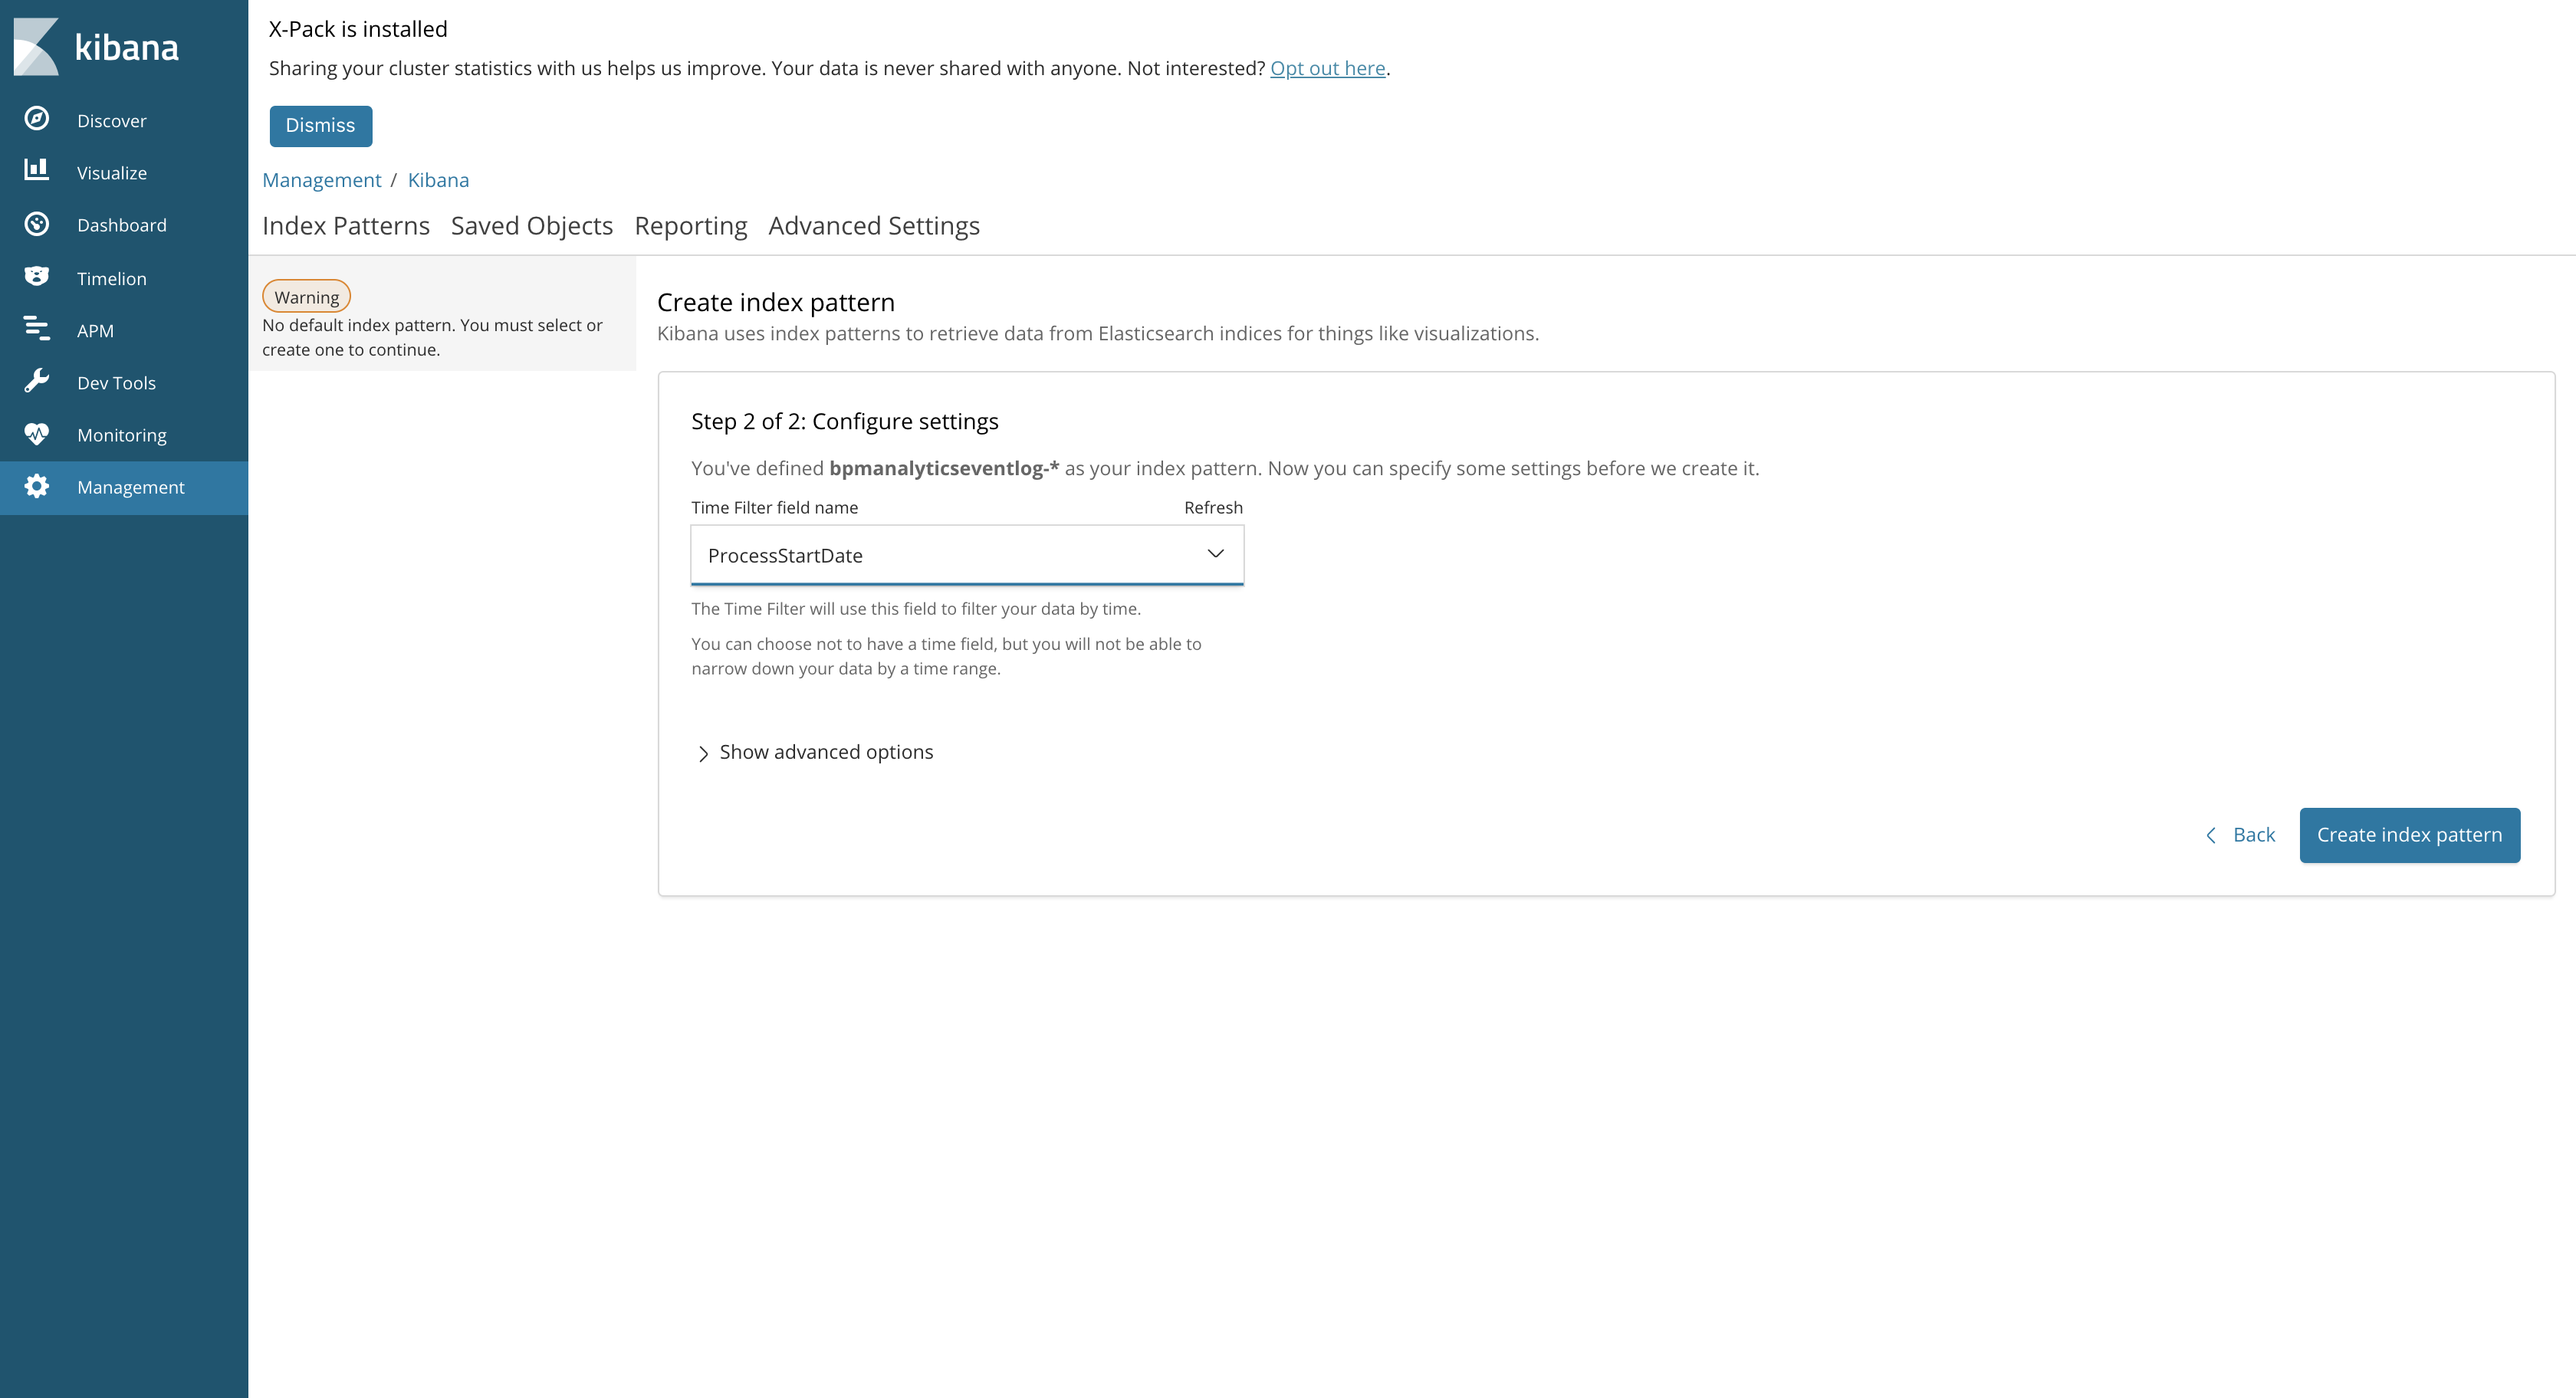
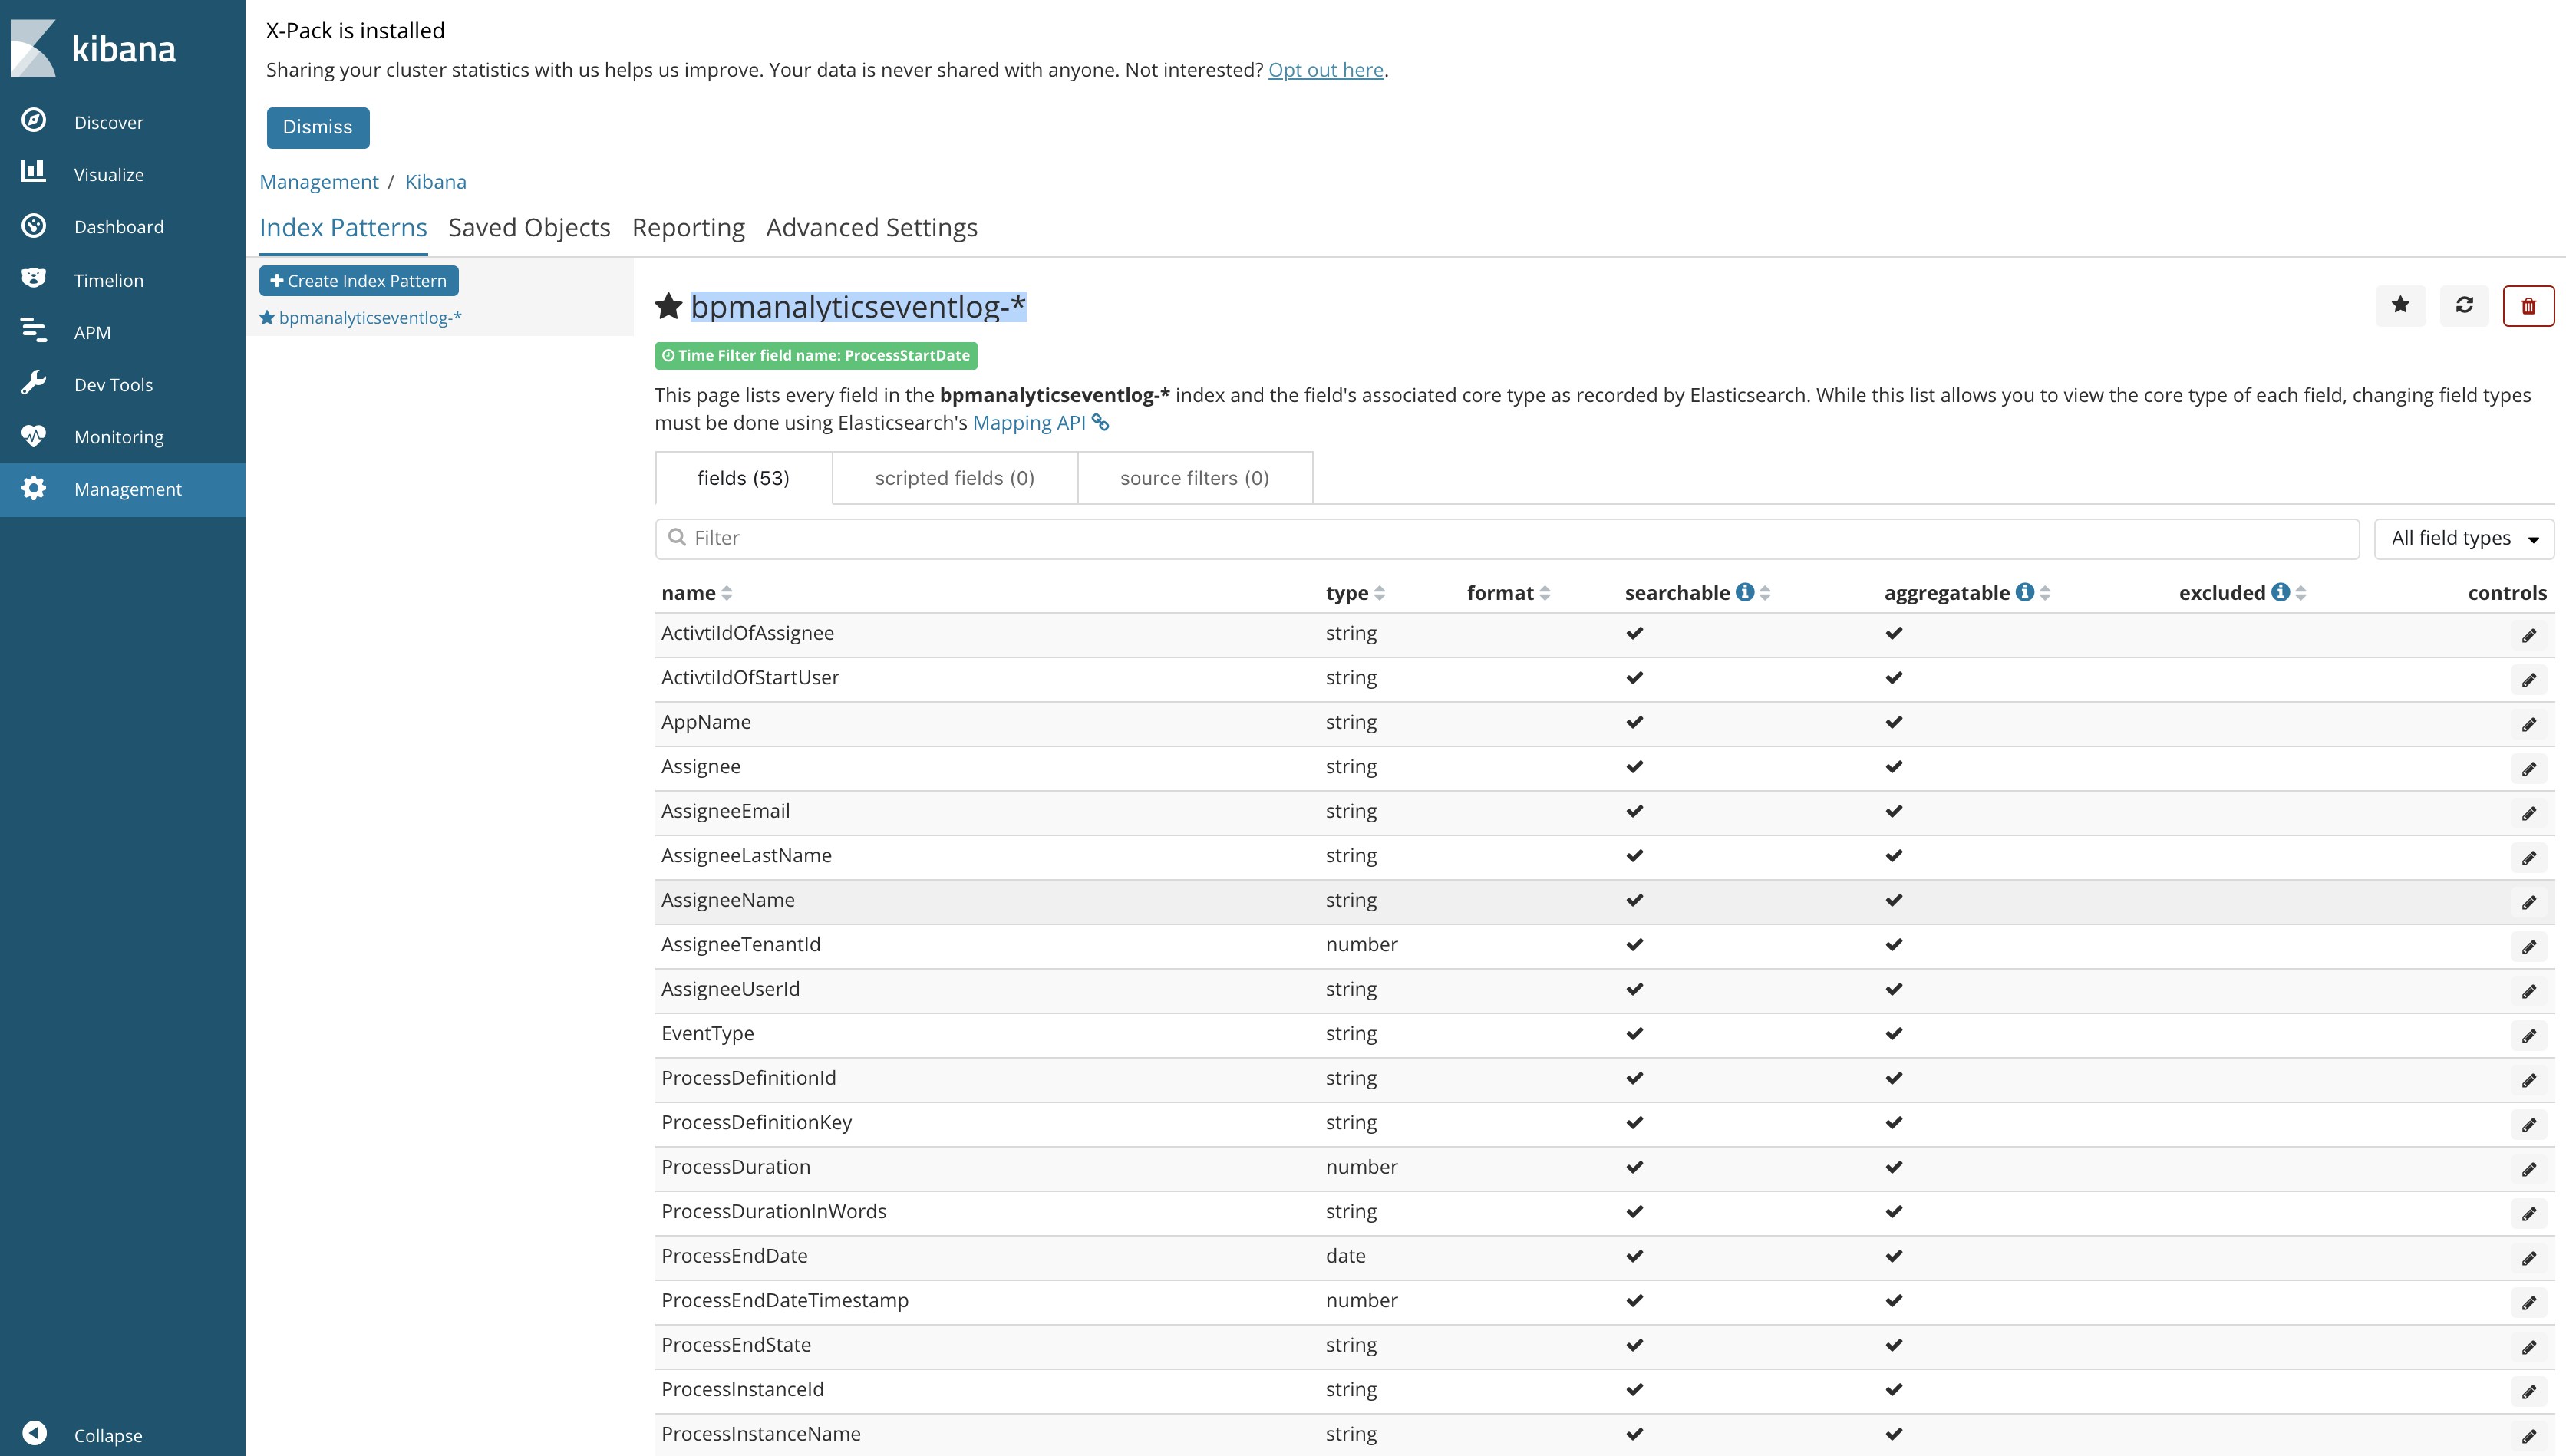
Create an index pattern "bpmanalyticseventlog-*" by going to Management -> Index Patterns -> Create index pattern -> bpmanalyticseventlog-* -> Select "ProcessStartDate" as the Time Filter field


- Import a task search object using the JSON file "task-search-kibana.json" present in kibana folder. Management -> Saved Objects -> Searches -> Import -> task-search-kibana.json
- After importing the task search, import the visualizations and dashboard built on top of the imported search using the file "task-dashboard-kibana.json". Management -> Saved Objects -> Searches -> Import ->-> task-dashboard-kibana.json
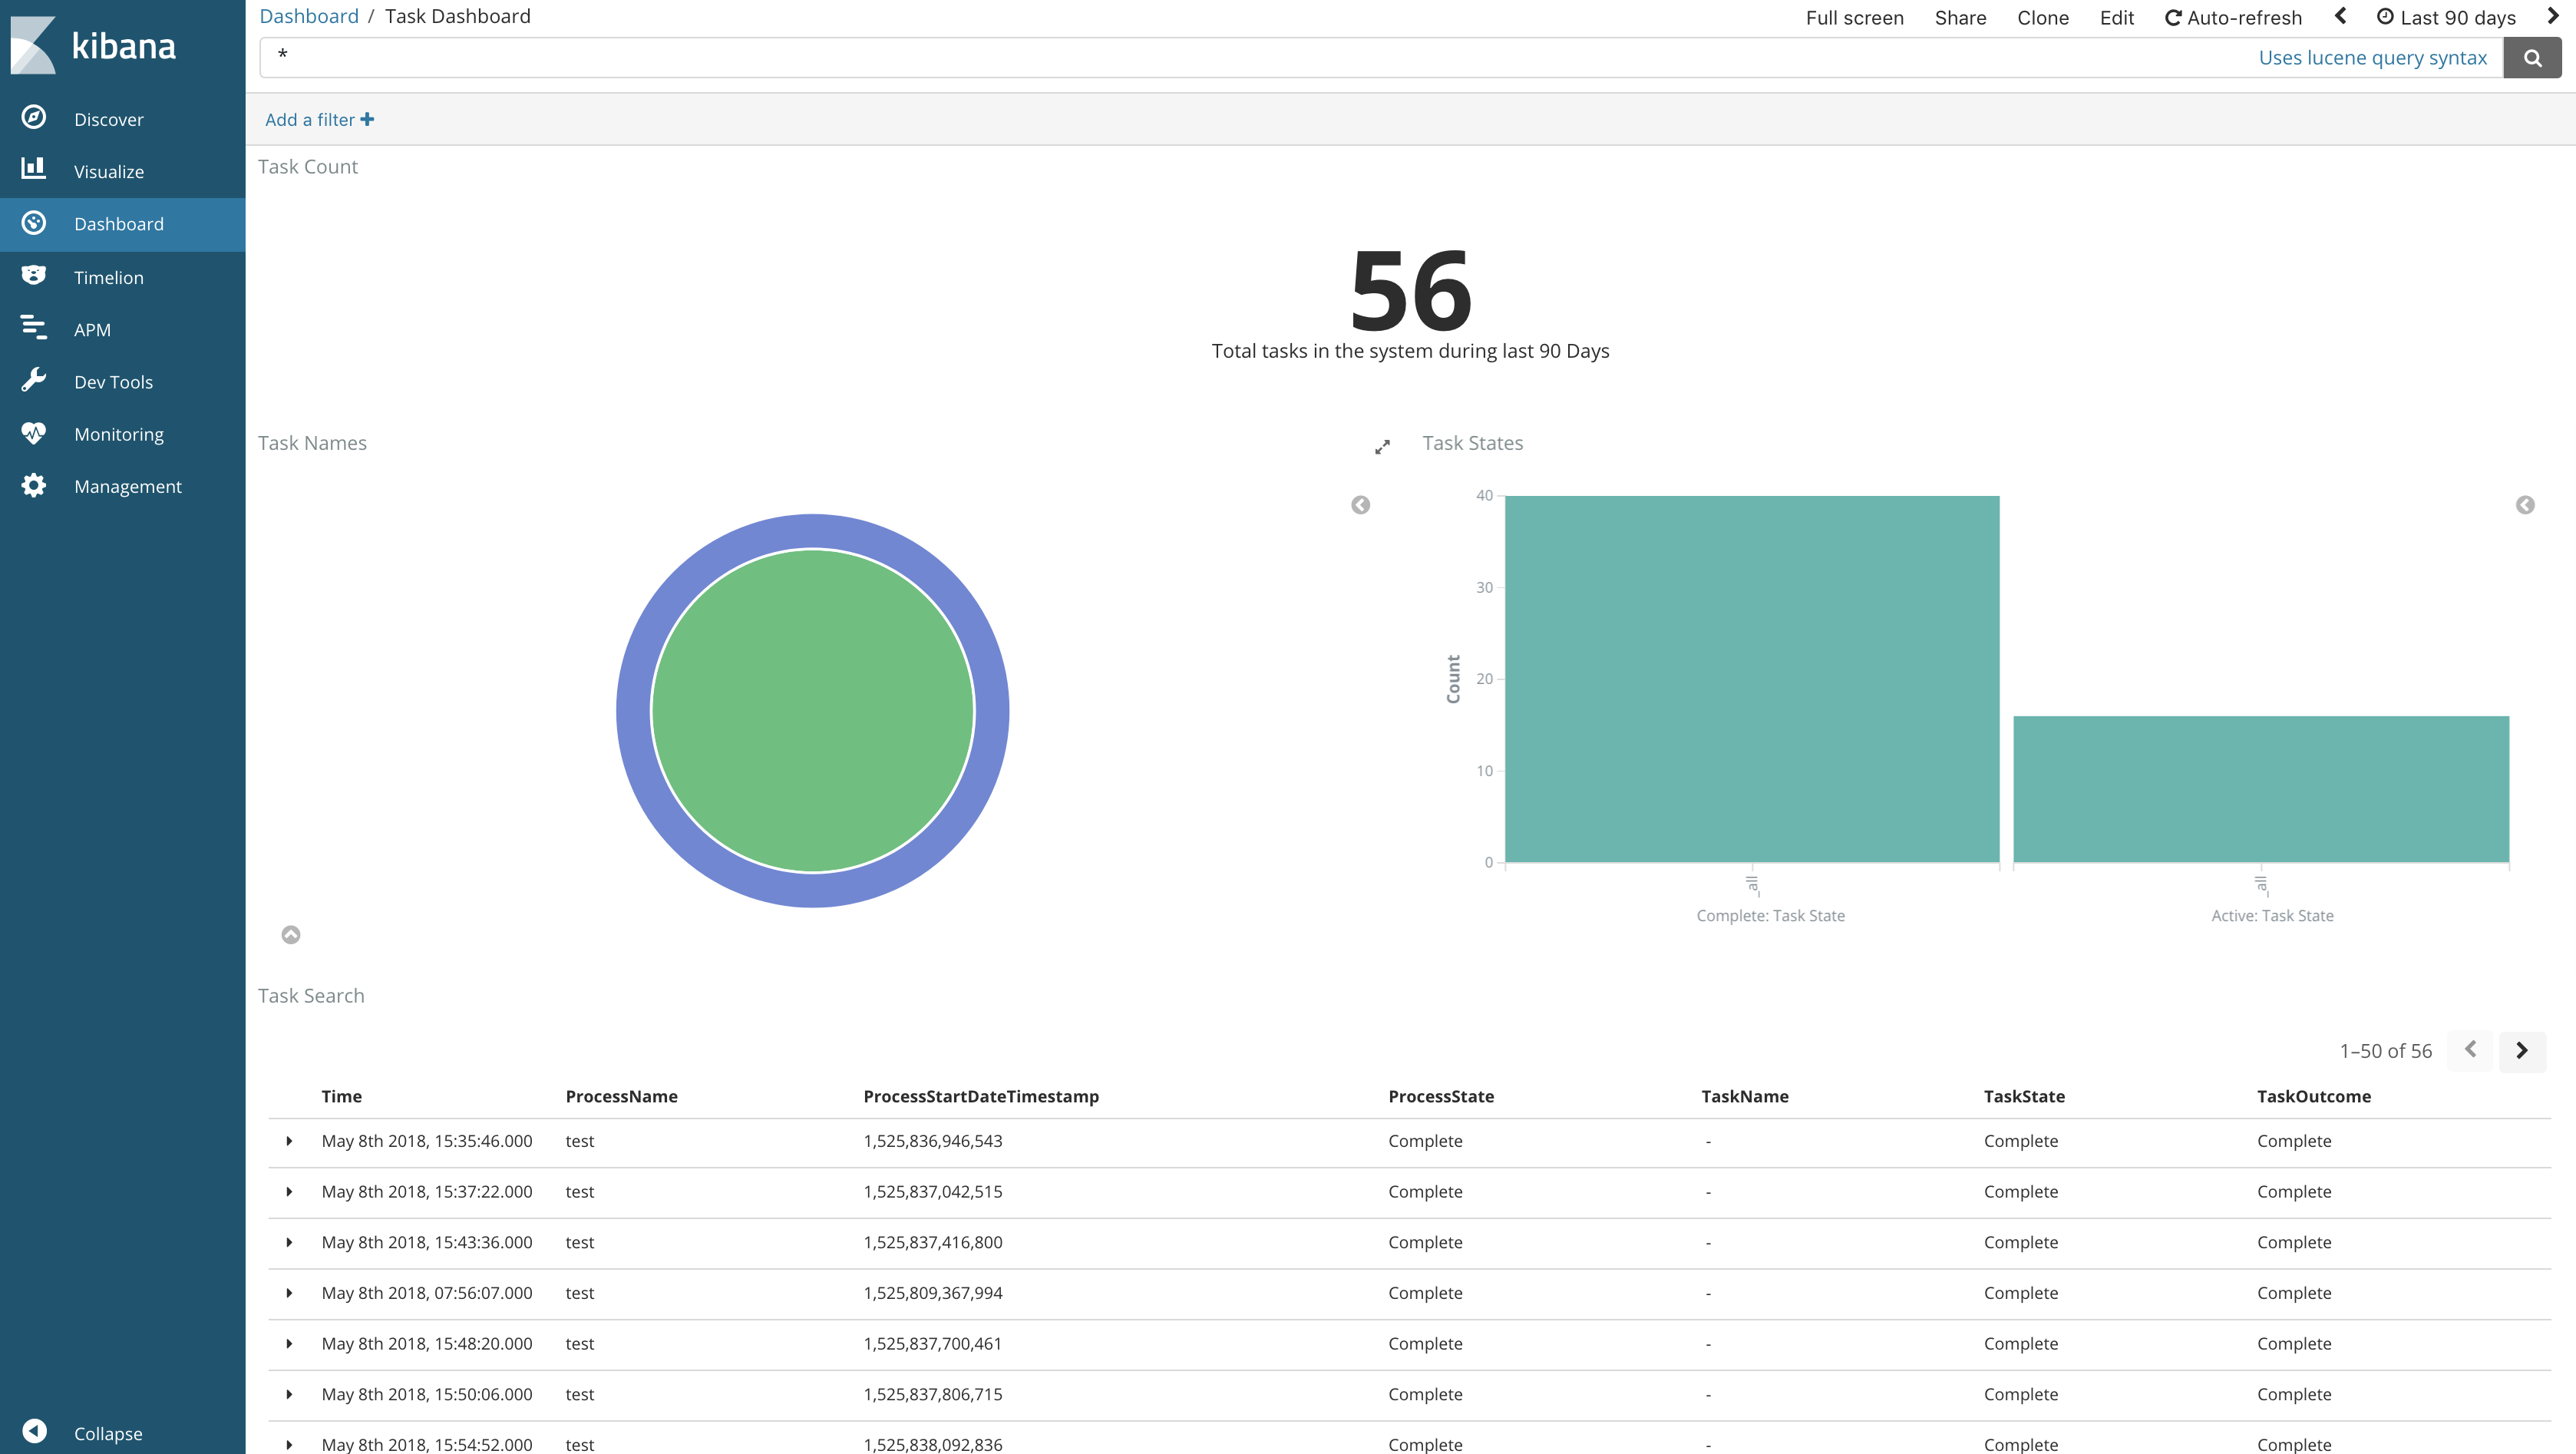
- Once you have done the above two steps, you now should have a task dashboard in your kibana as shown below
Similarly you can create more task/process dashboards and visualizations in Kibana!! It is now your turn to explore more!!
