Microprofile is a embeddable profiler in a few files, written in C++
Microprofile is hosted on
#include "microprofile.h"
{
	MICROPROFILE_SCOPEI("group","timername", MP_YELLOW);
	... code to be timed
}
And once each frame you should call
MicroProfileFlip(nullptr);
The implementation of microprofile is in microprofile.cpp, which you must include in your project.
The nullpointer is the void* device context passed for gpu timers.
MicroProfile can be used without calling MicroProfileFlip, in which case you should call MicroProfileDumpFileImmediately, to save the profile data as .html/.csv file on disk.
Gpu timers work like normal timers, except they are all put in a shared group, "GPU". To use them insert MICROPROFILE_SCOPEGPUI().
Gpu timers also supports multithreaded renderers - Please refer to demo_nouid3d12 for an example of how to use this.
Gpu timers are available for the following apis:
- OpenGL
- D3D11
- D3D12
- Vulkan
MicroProfile has support for tracking various counters, that will then be shown in the live & capture views.
	MICROPROFILE_COUNTER_ADD("memory/main", 1000);
	MICROPROFILE_COUNTER_SET("fisk/geder/", 42);
The Timeline view in a capture is intended to mark longer, unique timers. It can be used to show stuff like a level loading, with the levels name included.
- They are intended to mark state that last a long timer - Longer than a single frame
- They do not appear in the aggregation and cannot be viewed from the
- They are always active, and are all considered unique
- They can have fancy names with custom formatted strings.
There are two ways to use it. The first one uses unformatted static string literals:
	MICROPROFILE_TIMELINE_ENTER_STATIC(MP_DARKGOLDENROD, "one");
	MICROPROFILE_TIMELINE_LEAVE_STATIC("one");
The second option allows for arbitrary strings, but requires a token is stored, for the profiler to identify when leaving the marker:
	MICROPROFILE_TIMELINE_TOKEN(token);
	MICROPROFILE_TIMELINE_ENTERF(token, MP_YELLOW, "custom %d %6.2f", 10, 42.0f);
	MICROPROFILE_TIMELINE_LEAVE(token);
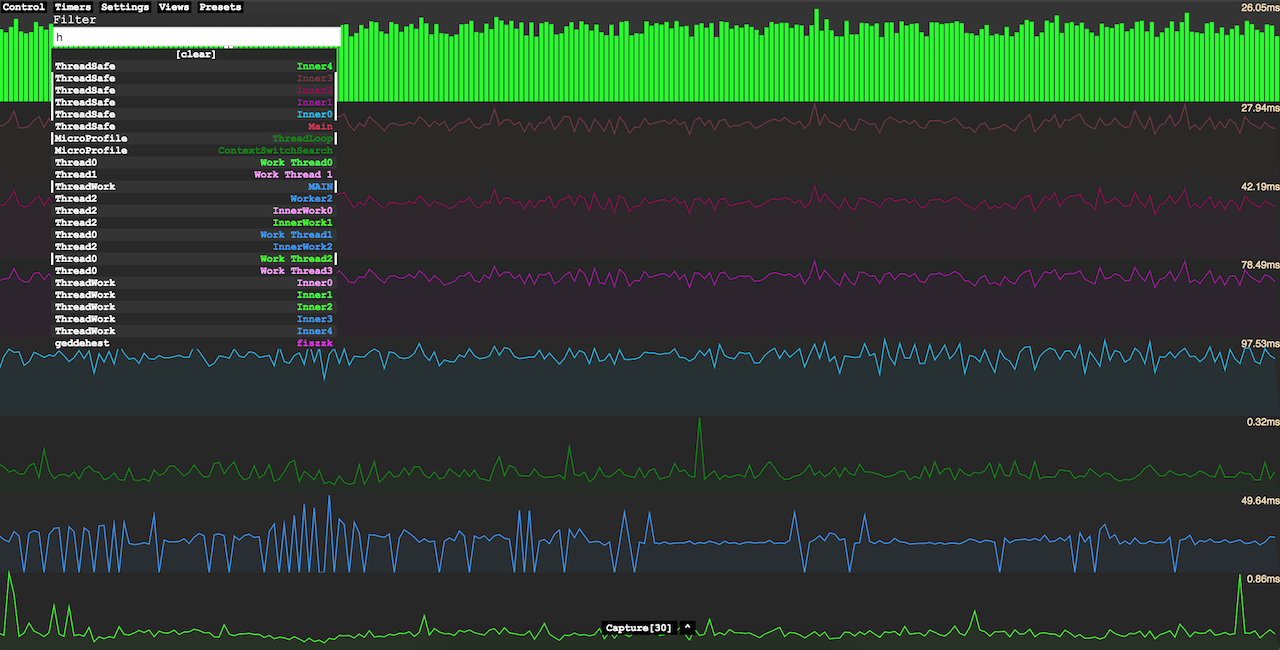
To start microprofile in live mode, simply point chrome to host:1338/ The live view can be used to enable different microprofile groups, using the Control menu. If no groups are enabled, no code is timed. Press the capture button to generate a capture. By default the last 30 frames are capture. The capture itself is a fully contained webpage, that can be saved and shared for further reference.
There are a few ways the webserver can be invoked
- host:1338/100 (capture 100 frames)
- host:1338/p/foo (start live view, load preset foo)
- host:1338/b/foo (start live view, load builtin preset foo)
Presets can be loaded and saved directly from the webbrowser. They are saved by the application in a file named mppresets.cfg. builtin presets are presets, that are loaded from mppresets.builtin.cfg. They work like presets, except they only be loaded. This is intended to be used to do predefined, non-overwriteable configurations.
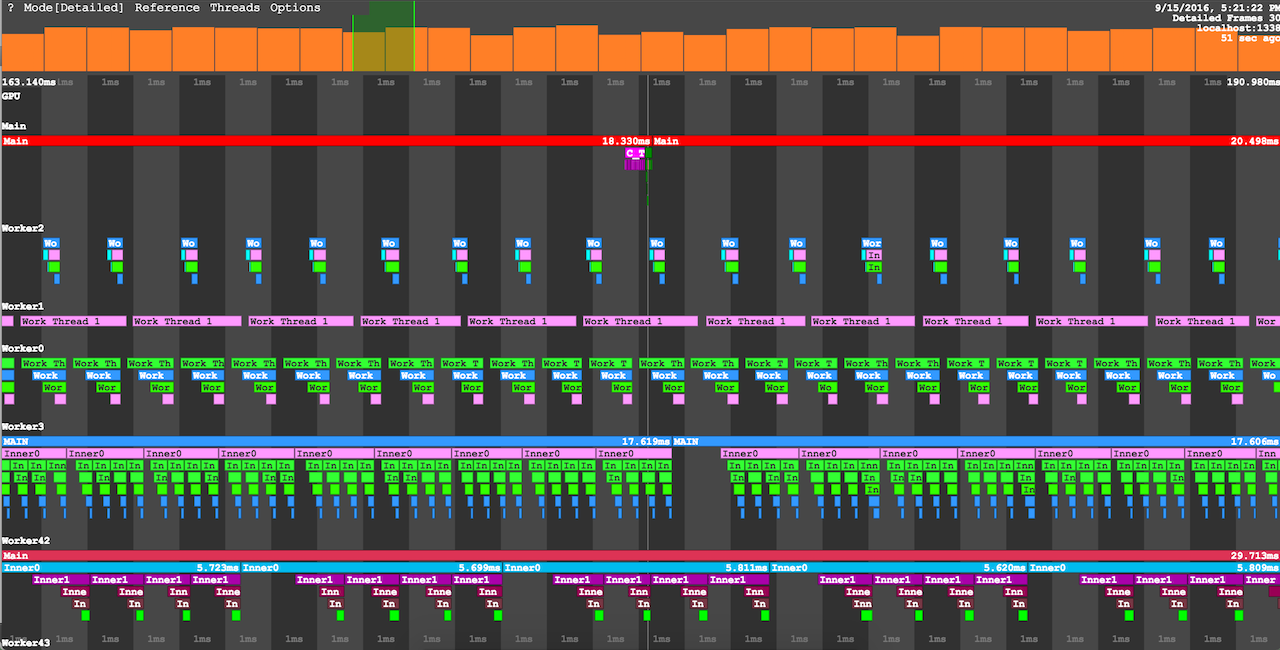
Capturing in live view provides a complete view of what is recorded in the ring buffers over a set amount of frames. Please be aware if you capture to far behind, the markers you're are looking for might be overwritten, in which case there will be no markers. As the buffers are reused per thread, this is something that will happen on a per thread basis.
Microprofile supports comparing two different captures. Save the first capture to disk, open the second capture and click compare and browse to the first file. Please be aware that:
- Only the detailed view is supported
- Captures saved from earlier versions will not work with this feature
- When context switch trace is enabled, comparing will only compare registered threads.
On Intel x86-64 Microprofile supports dynamically injecting markers into running code. This is supported on windows, osx and linux(tested on ubuntu) To use this feature
- Make sure MICROPROFILE_DYNAMIC_INSTRUMENT_ENABLE is defined
- Make sure to link with distorm and add its include folder to the include path
- Check
dynamic_instrumentfor an example - hold down
altto pan the secondary capture without moving the first capture
Please be aware that this is still a bit experimental, and be aware of these limitations:
- The profiler does not attempt to stop all running threads while instrumenting.
- This potentially can cause issues, as there is a critical moment when replacing the first 14 bytes of the function being patched. If any thread is executing the code begin replaced, the program behaviour will not be well defined
- For development this is usually fine
- The instrumentation does not need the program to be compiled or linked in any specific way
- But it does not support instrumenting all possible x86-64 code sequences - IE it might fail.
- It needs at least 14 bytes of instructions to instrument a function
- On linux you need to link your program with -rdynamic, in order to make the it possible to find the functions using
dladdr- if you know of any way to query this without linking with -rdynamic I'd love to hear about it.
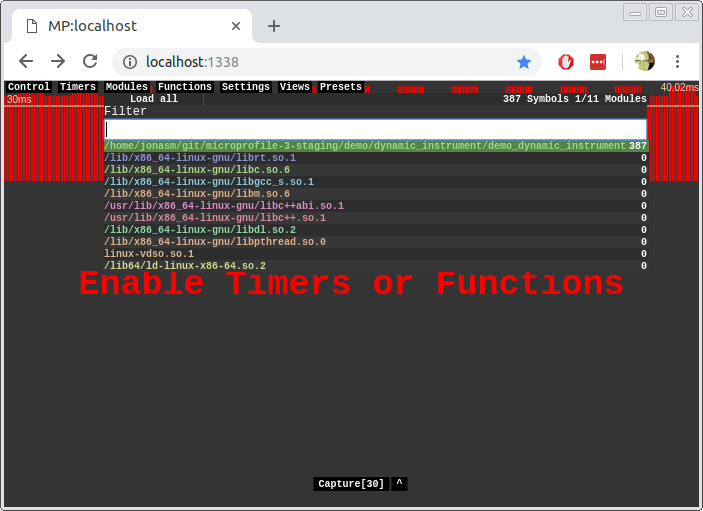
If compiled and linked with Dynamic Instrumentation, two new menus appear, "modules" and "functions".
The "modules" menu allows you to load debug information from your loaded modules. Select one or more modules to load from. Once its loaded the bar behind the module name is filled, and the debug information is ready.
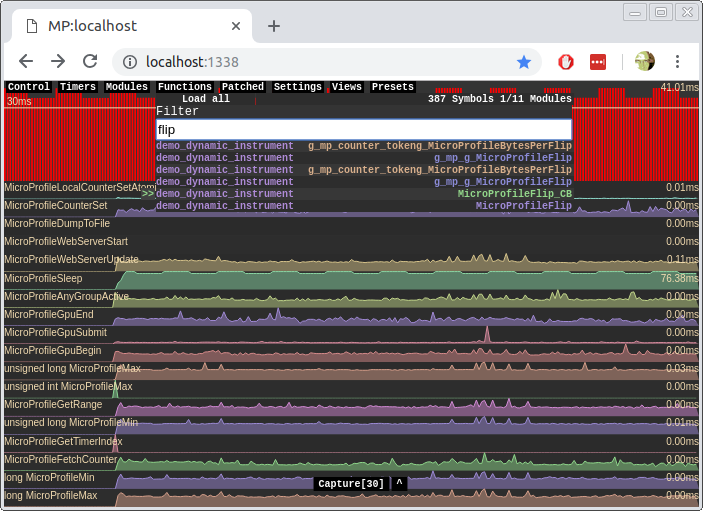
Once the debug symbols are loaded - Indicated by the number in the top of the functions menu - You can start typing to search for functions to instrument.
- Click on a function to attempt to instrument it
- If instrumentation fails, you´ll be asked to report the code sequence. Please consider doing this.
- Click on '>>' next to a function, to attempt to instrument all the functions called by that function
- Only functions called that also have a name in the debug information will be instrumented
- noframes: Using microprofile to profile an application without any concept of frames. dumps a capture at the end. No live view.
- simple: frame based implementation. with live view. No gpu timing
- d3d11: frame based implementation, with live view and D3D11 gpu timers
- d3d12: frame based implementation, with live view and D3D12 gpu timers
- d3d12_multithreading: frame based implementation, with live view and D3D12 gpu timers, with gpu timings generated from multiple threads.
- gl: frame based implementation, with live view and OpenGL gpu timers
- vulkan: Copy of the vulkan Hologram sample, fixed to use microprofile cpu and gpu markers. Only tested on windows.
- dynamic_instrument: Demo for dynamic instrumentation.
- workbench: Workbench for development. Using all features of microprofile.
- Microprofile supports generating compressed captures using miniz(http:/code.google.com/miniz).
- Distorm is used to disassemble x86-64 when using dynamic instrumentation(https://github.com/gdabah/distorm)
MicroProfile uses a few large allocations.
- One global instance of struct MicroProfile
- One Large Allocation per thread that its tracking (MICROPROFILE_PER_THREAD_BUFFER_SIZE, default 2mb)
- One Large Allocation per gpu buffer used (MICROPROFILE_PER_THREAD_GPU_BUFFER_SIZE, default 128k)
- one thread for sending
- one thread for handling context switches, when enabled
- 128kb for context switch data, when context switch tracing is enabled.
- two small variable size buffers. should not be more than a few kb.
- A state buffer for receiving websocket packets
- A state buffer for loading/saving settings.
- one small allocation for receiving packets from the sender
To change how microprofile allocates memory, define these macros when compiling microprofile implementation
- MICROPROFILE_ALLOC
- MICROPROFILE_REALLOC
- MICROPROFILE_FREE
Microprofile has lots of predefined macros that can be changed. To modify this, make sure MICROPROFILE_USE_CONFIG is defined, and put the changed defines in microprofile.config.h.
There are a few minor known issues & Limitations:
- Currently the relative placement of gpu timings vs the cpu timings tend to slide a bit, and thus the relative position of GPU timestamps and CPU timestamp are not correct.
- Chrome has an internal limit to how big a page it will cache. if you generate a capture file that is larger than 32mb, chrome will refuse to cache it. This causes the page to redownload when you save it, which is pretty catastrophic, since it will generate a capture. To mitigate this:
- Use miniz. This drastically reduces the size of captures, to the point where its no longer a problem
- If you still have issues, increase chromes disk cache size.
- If you're dynamically creating threads, you must call
MicroProfileOnThreadExitwhen threads exit, to reuse the thread log objects - instrumentation is only supported on x86-64
Microprofile supports the two major consoles - Search for 'microprofile' in the closed platform forums.
- Timeline view is now drawn using a hierarchical algorithm that scales better
- Search in timeline view has been improved
- you can now search for substrings interactively
- search result now highlights by changing the color
- and there is no longer any limit on the amount of search results
- Added section markers, that allow you to group sections of code indepently of group/timer name.
- Added CStr markers. This lets you pass in a static CStr, which will appear in the timeline view
- Note that the caller is responsible for ensuring the CStr stays allocated, as it will be deferenced when generating a capture
- only works in the timeline view, and is not usable in the various aggregation + live view
- Fixed thread hide mode to be collapsed(which is what it should've been). Added a shortcut key to toggle it ('c')
- Switched build to use github actions
Licensed using UNLICENSE


