PandasAI is a Python library that makes it easy to ask questions to your data in natural language. It helps you to explore, clean, and analyze your data using generative AI.
The documentation for PandasAI to use it with specific LLMs, vector stores and connectors, can be found here.
With pip:
pip install pandasaiWith poetry:
poetry add pandasaiTry out PandasAI yourself in your browser:
PandasAI can be deployed in a variety of ways. You can easily use it in your Jupyter notebooks or streamlit apps, or you can deploy it as a REST API such as with FastAPI or Flask.
If you are interested in managed PandasAI Cloud or self-hosted Enterprise Offering, take a look at our website or book a meeting with us.
import pandas as pd
from pandasai import SmartDataframe

# Sample DataFrame
sales_by_country = pd.DataFrame({
    "country": ["United States", "United Kingdom", "France", "Germany", "Italy", "Spain", "Canada", "Australia", "Japan", "China"],
    "sales": [5000, 3200, 2900, 4100, 2300, 2100, 2500, 2600, 4500, 7000]
})

# Instantiate a LLM
from pandasai.llm import OpenAI
llm = OpenAI(api_token="YOUR_API_TOKEN")

df = SmartDataframe(sales_by_country, config={"llm": llm})
df.chat('Which are the top 5 countries by sales?')
China, United States, Japan, Germany, Australia
Or you can ask more complex questions:
df.chat(
    "What is the total sales for the top 3 countries by sales?"
)
The total sales for the top 3 countries by sales is 16500.
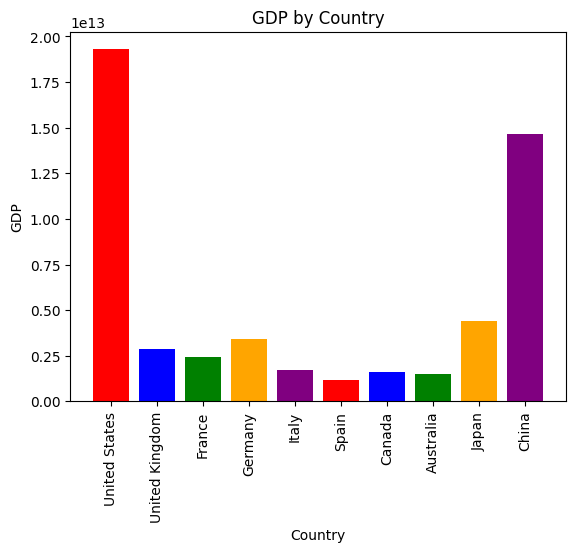
You can also ask PandasAI to generate charts for you:
df.chat(
    "Plot the histogram of countries showing for each the gdp, using different colors for each bar",
)You can also pass in multiple dataframes to PandasAI and ask questions relating them.
import pandas as pd
from pandasai import SmartDatalake
from pandasai.llm import OpenAI

employees_data = {
    'EmployeeID': [1, 2, 3, 4, 5],
    'Name': ['John', 'Emma', 'Liam', 'Olivia', 'William'],
    'Department': ['HR', 'Sales', 'IT', 'Marketing', 'Finance']
}

salaries_data = {
    'EmployeeID': [1, 2, 3, 4, 5],
    'Salary': [5000, 6000, 4500, 7000, 5500]
}

employees_df = pd.DataFrame(employees_data)
salaries_df = pd.DataFrame(salaries_data)


llm = OpenAI()
dl = SmartDatalake([employees_df, salaries_df], config={"llm": llm})
dl.chat("Who gets paid the most?")
Olivia gets paid the most.
You can find more examples in the examples directory.
In order to generate the Python code to run, we take some random samples from the dataframe, we randomize it (using random generation for sensitive data and shuffling for non-sensitive data) and send just the randomized head to the LLM.
If you want to enforce further your privacy you can instantiate PandasAI with enforce_privacy = True which will not send the head (but just column names) to the LLM.
PandasAI is available under the MIT expat license, except for the pandasai/ee directory (which has it's license here if applicable.
If you are interested in managed PandasAI Cloud or self-hosted Enterprise Offering, take a look at our website or book a meeting with us.
- Docs for comprehensive documentation
- Examples for example notebooks
- Discord for discussion with the community and PandasAI team
Contributions are welcome! Please check the outstanding issues and feel free to open a pull request. For more information, please check out the contributing guidelines.


