Cloud to Street Flood Event Mapping Practical Exercise
Thank you for applying to work at Cloud to Street! This coding exercise is designed to assess your ability to work in our web stack. You should spend no more than 3 hours on it and then submit it to veda@cloudtostreet.info.
Please feel free to consult outside sources to familiarize yourself with processes or packages you may be unfamiliar with, but ultimately only submit your own code. We encourage you to provide links to any online resources (e.g., StackOverflow posts) that inspired specific code snippets.
We will review your submission anonymously to avoid bias. To help us in this process, please do not include your name or other personally identifiable information in your code.
The project
We'd like you to add a new feature to the web-based map viewer in this repository. Specifically, you'll add a feature to show and display icons indicating the locations of flood events around Ghana.
- Add a database model describing the locations of flood events.
- Load all the locations from the backend Django server. Display them on the map.
- When the user clicks on the map, publish an additional marker to the database.
- When the user selects a specific region by typing into the region text box, filter the icons so that only the flood events within that region are displayed.
This feature is similar to some of the functionality we offer in our flood analytics dashboard.
Our evaluation criteria
To assess completeness, we'll review this list of requirements.
- The map displays all the flood events stored in the database.
- The database stores the flood event locations as a longitude and a latitude.
- When the map is clicked, a pin is added to both the UI and the database.
- When the page is reloaded, all the pins are still displayed.
- The region selection textbox shows all sixteen region names of Ghana as supplied by
DjangoApiService.ghanaGeometry$. - When a region is selected, only the pins within that region are displayed.
- When a region is selected, the region is outlined using
updateRegionSelectionLayer. - Regions can be deselected by deleting the region name from the textbox. After clearing the textbox, all of the pins are displayed again -- no filtering.
In addition to these specific requirements, we'll review your code to assess the following.
- your ability to write clear code
- your ability to create a logical data model
- your understanding of the interaction between the database, the backend, and the frontend
- your understanding of REST APIs and HTTP requests
- your ability to connect information between UI components in an organized way
We are not testing:
- your ability to add impressive features above and beyond the requirements
- deep knowledge of the Django or Angular frameworks
- your ability to write tests. (Feel free to write tests. Tests are an important part of our workflow, but we've decided not to include them as part of this exercise for simplicity.)
Don't spend more than 3 hours on this project. If you reach the 3 hour mark without finishing, take a moment to write down what you would have done if you had extra time, then submit your repository.
Up and running
You'll need the following software to develop the project. If on Windows, we recommend developing under Windows Subsystem for Linux.
Set up your project by running the following commands.
# Clone the git repository.
git clone git@github.com:cloudtostreet/fullstack-flood-event-display.git

# Enter the repository.
cd fullstack-flood-event-display

# Enter the Django folder.
cd flood_viewer_project

# If you haven't already, install the virtualenv Python module using Pip. Pip is included with Python since Python 3.4.
python -m pip install virtualenv

# Create a virtual environment.
python -m virtualenv venv

# Enter the virtual environment. Confused by Python's virtual environments? See https://docs.python.org/3/tutorial/venv.html
source venv/bin/activate

# Install the required Python packages.
python -m pip install -r requirements.txt

# Create or update the database. (manage.py is a script provided by Django for administrative commands.)
python manage.py migrate

# Add an administrator account. Username: admin, password: admin.
python manage.py shell -c "from django.contrib.auth.models import User; User.objects.create_superuser('admin', 'admin@example.com', 'admin')"

# Run the Django server. Leave the server running as you complete your exercise.
python -m manage runserver

# In another terminal, navigate to the angular-frontend/ subdirectory.
cd fullstack-flood-event-display/angular-frontend

# Install the Node package dependencies with npm install.
npm install

# You'll also need the Angular command line tools.
npm install -g @angular/cli

# Now run the frontend webserver. Leave the server running as you complete your exercise.
ng serve
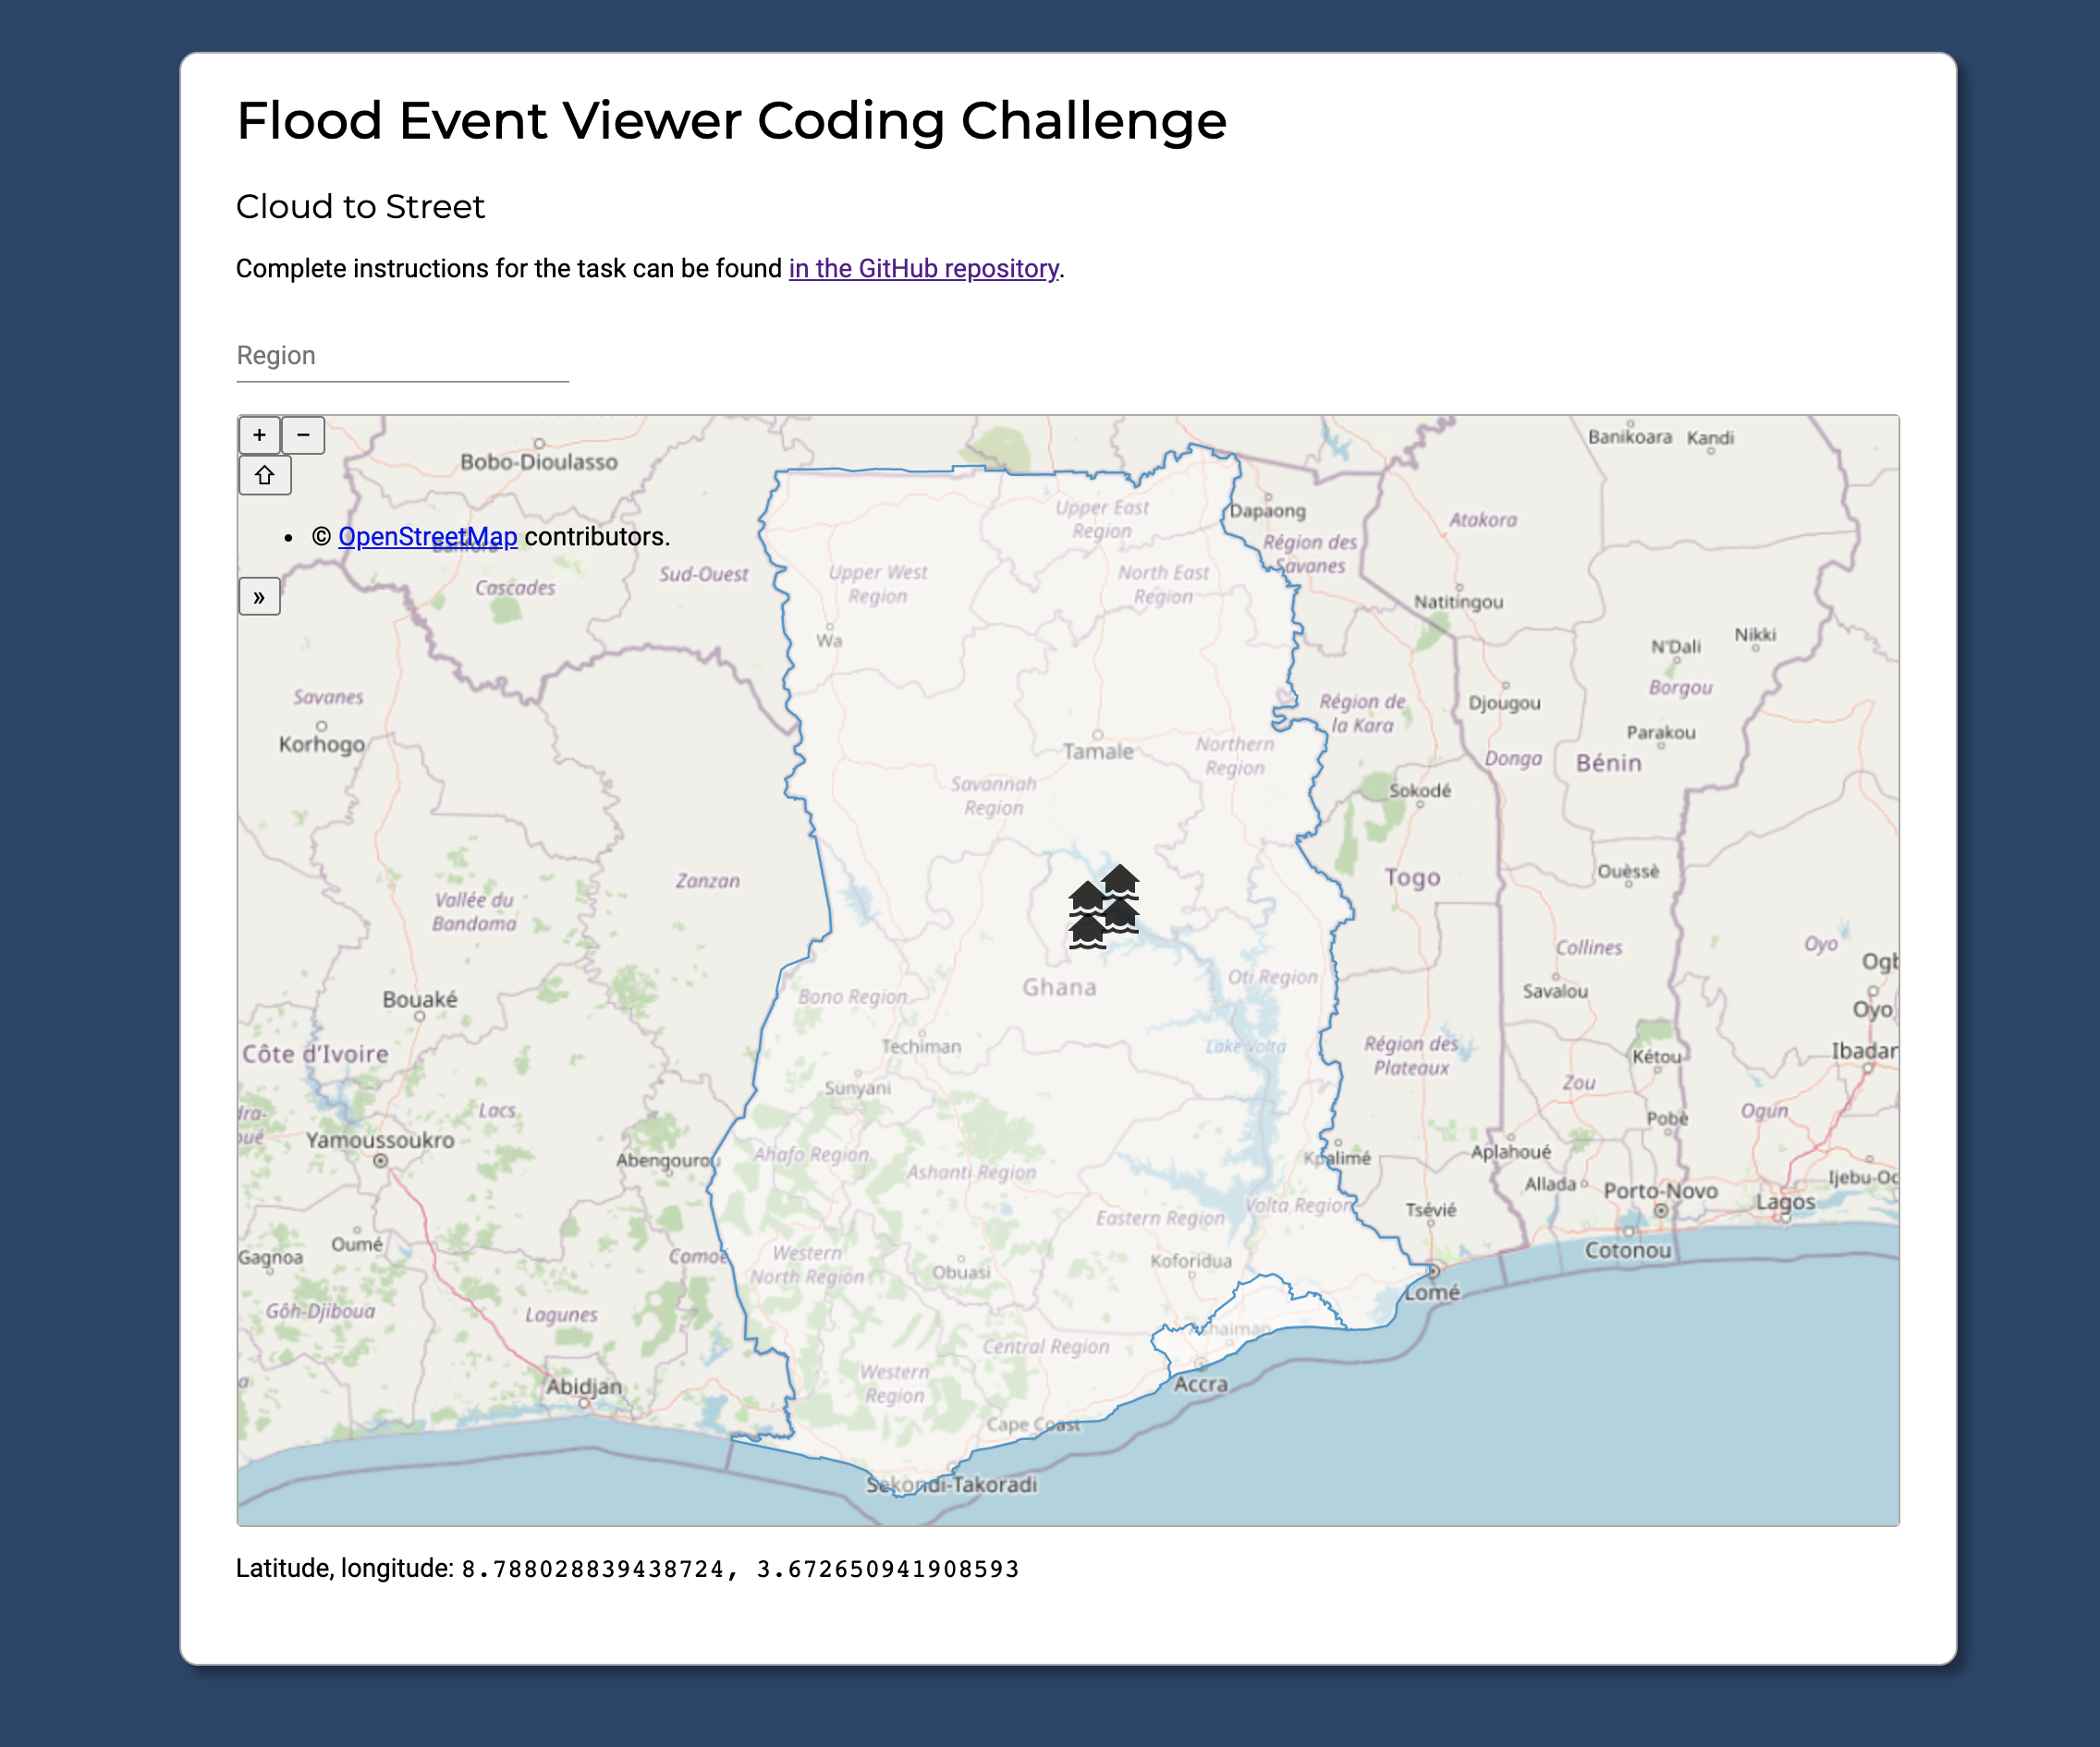
When you navigate to localhost:4200/, you should see the Angular frontend. It looks like this:
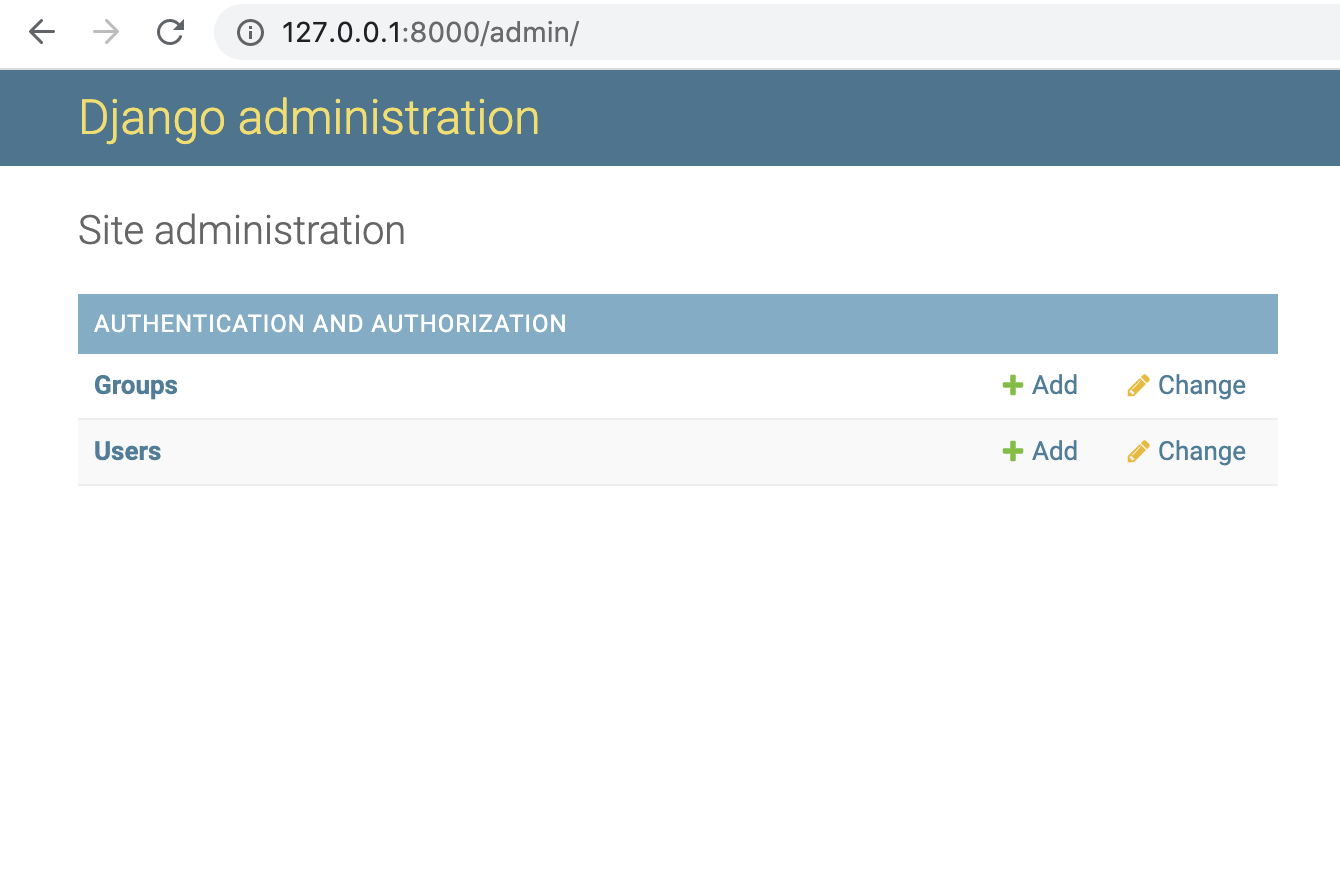
You can also find an interface to the Django backend at localhost:8000/. The administrator username and password are both admin. Once logged in, it should look like this. Here's where you can create, view, update, and delete database entries.
At this point, the page doesn't do much. Four flooded house icons are displayed arbitrarily in the center of Ghana. One southern region of Ghana is highlighted arbitrarily. The region search box doesn't do anything. It's your task to build on top of what's given to turn this into a functional webpage that meets the requirements listed above.
Project structure
To help you get started, let's go over the structure of the repo and some of the most important files.
.
|   * You're reading this file.
├── README.md
|
|   * The frontend Angular project.
├── angular-frontend
│   └── src
|       |
|       |   * The directory containing the all the UI components.
|       |   * This is where you'll write your frontend code.
│       ├── app
|       |   |
|       |   |   * The autocomplete search box component.
│       |   ├── autocomplete
|       |   |
|       |   |   * The map component.
│       |   ├── map
│       |   |   |
│       |   |   |   * The HTML template for the map.
│       |   |   ├── map.component.html
│       |   |   |
│       |   |   |   * The TypeScript code that controls the component.
│       |   |   ├── map.component.ts
│       |   |   |
│       |   |   |   * The stylesheet for the component.
│       |   |   └── map.component.css
│       |   |
│       |   |   * The main HTML template for the page. Contains the map and
│       |   |   * search box.
│       |   ├── app.component.html
│       |   |
│       |   |   * The TypeScript code that controls the component.
│       |   ├── app.component.ts
│       |   |
│       |   |   * A collection of functions for querying the backend.
│       |   └── django-api.service.ts
│       |
│       ├── index.html
│       ├── main.ts
│       └── styles.css
|
|   * The backend Django project.
└── flood_viewer_project
    |
    |   * The database.
    ├── db.sqlite3
    |
    |   * The project configuration folder. Here's where you add routes and
    |   * change settings.
    ├── flood_viewer
    |   |
    |   |   * Settings that apply to the whole Django project.
    │   ├── settings.py
    |   |
    |   |   * The file that associates URLs with views.
    │   └── urls.py
    |
    |   * The Django app folder. Here's where you'll define your models and
    |   * endpoints.
    ├── flood_viewer_app
    |   |
    |   |   * The admin site configuration. This is how you configure the
    |   |   * database admin interface at localhost:8000/admin.
    │   ├── admin.py
    |   |
    |   |   * The dataset describing the regions of Ghana.
    │   ├── ghana_geometry.py
    |   |
    |   |   * The database models.
    │   ├── models.py
    |   |
    |   |   * The endpoints that respond to HTTP requests for a given URL.
    │   └── views.py
    |
    |   * The script used for running administrative Django commands.
    └── manage.py
Go ahead and jump in. One good first place to start could be determining how the four flood event icons are rendered. Refer to angular-frontend/src/app/map/map.component.ts. You should replace the hardcoded coordinates with ones loaded from the database.
You might also be interested in django-api.service.ts, which queries the backend for the JSON file describing the regions of Ghana. You should fill out the two stub functions getMarkers and addMarker with your own code that queries the Django backend.
To add new models to the database, take a look at flood_viewer_project/flood_viewer_app/models.py.
The list of requirements earlier in this document should serve as a guide for completing the task. Here's the list again for convenience:
- The map displays all the flood events stored in the database.
- The database stores the flood event locations as a longitude and a latitude.
- When the map is clicked, a pin is added to both the UI and the database.
- When the page is reloaded, all the pins are still displayed.
- The region selection textbox shows all sixteen region names of Ghana as supplied by
DjangoApiService.ghanaGeometry$. - When a region is selected, only the pins within that region are displayed.
- When a region is selected, the region is outlined using
updateRegionSelectionLayer. - Regions can be deselected by deleting the region name from the textbox. After clearing the textbox, all of the pins are displayed again -- no filtering.
Good luck!
Useful references
Here are a few resources that will be useful in completing this exercise. We used all of them while designing this assessment. You're free to use any resources you can find online but we expect these will be especially useful.
- Creating models
- Django models - for defining database models in Django
- Migrations workflow - how to run migrations, which update the database to include new models
- Registering models with the admin site - add models to the web interface at localhost:8000/admin so you can manually create and edit them
- Making requests
- Django Rest Framework - add Django REST endpoints that allow you to access and edit models
- Angular HTTP requests - how to make HTTP requests with Angular
- Frontend
- Angular tutorial - an official Angular tutorial
- OpenLayers docs - the documentation for the map component
- Angular Material Autocomplete docs - the documentation for the Angular Material autocomplete component, referenced in this project as
<mat-autocomplete> - RxJS docs - the documentation for a library used for asynchronous programming in Angular
How to submit
Once you've completed the assessment, please zip the repository and email it to veda@cloudtostreet.info. Do not submit a pull request.
If you ran up against the time limit, briefly describe any additional code you might have written if you had had more time. Include this as a file named "Submission Notes" at the root of the repository.
Once you've submitted your assessment, we ask that you fill out the anonymous feedback survey.
Thank you for taking the time to complete this exercise! - Cole and Veda

