Spark cluster with metrics
Sample spark cluster, that uses systemd, ansible, centos7, influxdb, statsd, spark metrics system, spark job server and more to demonstrate how to collect metrics for perf tuning on a dev cluster.
This projects includes template done in Vagrant and Ansible.
You should be able to take this and apply it to your server machines quickly.
The OS is Centos7 which seems like de facto.
The templates and scripts install Spark, Java, configures spark metrics system, spark job history server, ansible, influxdb, telegraf, chronograf and statsd.
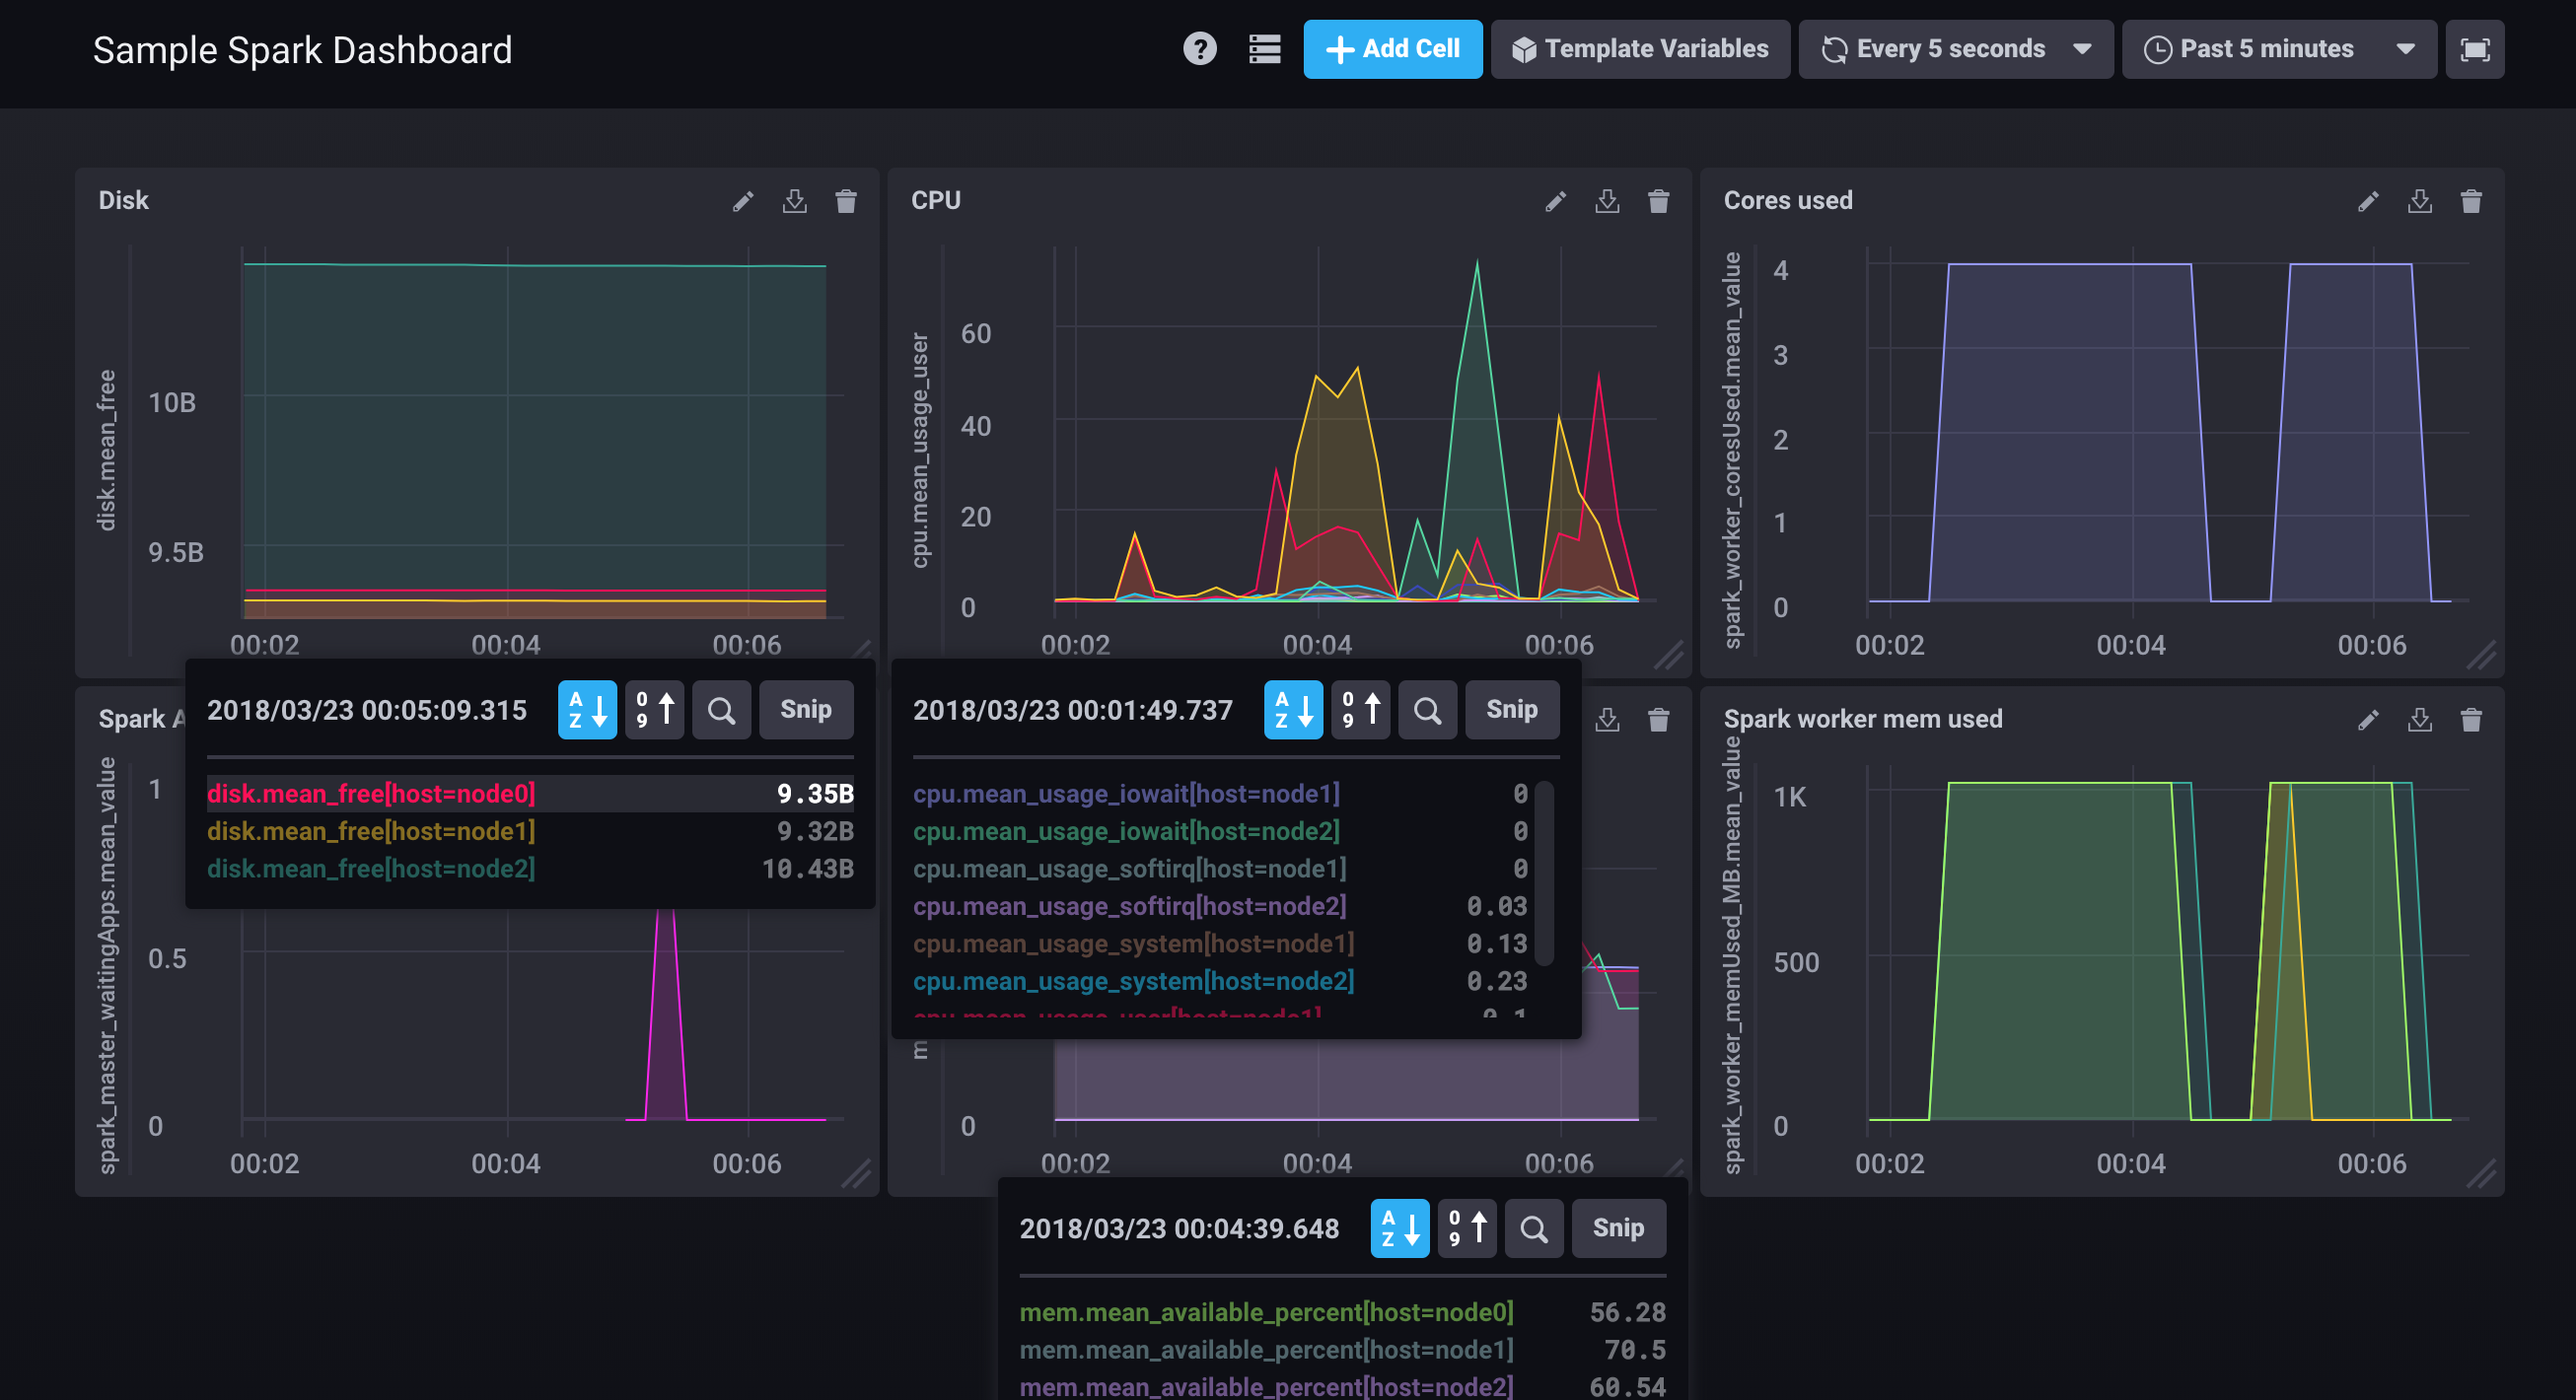
With chronograf, it is easy to setup metrics dashboards too. You could also set up grafana to display metrics.
Metrics are available via the InfluxDB rest API and the Spark metric system REST API.
It would be easy to write an adapter to send metrics to a custom metric system. Between InfluxDB and Telegraf, most industry standard metric outputs and metric inputs are available.
The metrics are rich and plentiful enough to find and track any problems with a Spark system.
Ansible can be run against real servers as long as you have ssh access. There are examples installing keys and setting up ssh/ansible.
The trick is automating the system so you can set it up quickly.
To facilitate set up, we use Vagrant. Whenever possible, we use systemd.
Vagrant, ansible, etc. are all installable via brew.
Note we use Vagrant to do local testing. For EC2 or other clouds we would use Terraform instead.
Setting up your spark cluster with metrics
Install ansible and vagrant.
installing vagrant
$ brew cask install virtualbox
$ brew cask install vagrant
See install vagrant with brew for more details.
installing ansible
$ brew install ansiblePull this project down from github
$ git clone https://github.com/cloudurable/spark-cluster.git
$ cd spark-cluster
Set up keys for ssh for spark cluster
We generate keys for using ssh and ansible.
bin/gen-key.shRun download.sh to download spark.
We have a script that downloads spark. You can customize this script to download a different version of spark.
bin/download.shThe download uses this spark dist, you are free to change it.
Run vagrant up to bring up the spark cluster
Vagrant up will bring up all of the server.
vagrant upAdd keys to your auth known_hosts
After you bring up the servers, you can use ssh-keyscan to avoid any issues
with known_hosts when using ansible.
In order for that keyscan to work, you need the hostnames for the cluster in your /etc/hosts file as follows:
Add nodes to your /etc/hosts file for connivence.
cat >> /etc/hosts <<EOL

192.168.50.20  bastion

192.168.50.4  node0
192.168.50.5  node1
192.168.50.6  node2
192.168.50.7  node3
192.168.50.8  node4
192.168.50.9  node5
EOL
Add known_hosts to avoid ansible issues.
ssh-keyscan node0 node1 node2 bastion > ~/.ssh/known_hostsEnsure all of the servers are up
You can use the ansible ping module to ensure the servers are up.
ansible all  -m ping
node2 | SUCCESS => {
    "changed": false,
    "ping": "pong"
}
node0 | SUCCESS => {
    "changed": false,
    "ping": "pong"
}
node1 | SUCCESS => {
    "changed": false,
    "ping": "pong"
}
bastion | SUCCESS => {
    "changed": false,
    "ping": "pong"
}
Ignore any errors you see from bastion. It is place holder.
Add keys to the spark nodes
You can add keys to all of the nodes so you can ssh into them from other nodes in the cluster.
ansible-playbook playbooks/keyscan.ymlInstall Spark Servers, prerequisites, and TICK stack
# Install Java JDK and command line utils
ansible-playbook playbooks/yum-nodes.yml
# Install the Spark master node on node0
ansible-playbook playbooks/install-spark-master.yml
# Install the Spark slave nodes on node1 and node2
ansible-playbook playbooks/install-spark-slave.yml
# Install the Spark history job server on node0
ansible-playbook playbooks/install-spark-history.yml
# Install the telegraf on all nodes but statsD input on node1
ansible-playbook playbooks/install-telegraf.yml
# Configure Spark Metrics system to output to systemd
ansible-playbook playbooks/configure-metrics.yml
# Install the influxdb and chronograf on node2
ansible-playbook playbooks/install-influxdb.yml
Setup Chronograf
Go to Chronograf http://node2:8888
- Set
Connection Stringto http://node2:8086 - Set
Nameto Spark - Leaver UserName and Password blank (you would need to set this in influxdb.conf)
- Set
Telegraf Databaseto spark - Click
Add Connection - Create a dashboard and add desired metrics to it
Spark server layout
This spark cluster is designed to run on a MacBook pro with 16GB.
There are three nodes in this system.
- node0
- node1
- node2
These nodes all run Spark slaves.
They also run some extra servers as follows
- node0 - spark master, spark history server, spark slave
- node1 - spark slave, telegraf statsd server
- node2 - spark slave, InfluxDB, Chronograf
Servers and ports
- Node 0 Spark Master Server http://node0:8080/
- Node 0 History Server http://node0:18080/
- Node 2 Chronograf http://node2:8888
- Node 0 Slave http://node0:8081/
- Node 1 Slave http://node1:8081/
- Node 2 Slave http://node2:8081/
- Node 1 StatsD Server udp://node1:8125
- Node 2 InfluxDB input udp://node2:8089
- Node 2 Influxdb http://node2:8086/ping
curl -v http://node2:8086/ping
In the real world, these would all run potentially on different servers.
For development and performance tuning locally, we will run them here.
Commands I use often to debug
# See Java processes
ps -ef | grep java

# Kill java processes
pkill java #systemd will restart spark services

# See status of spark slave node
systemctl status spark-slave

# See status of spark master
systemctl status spark-master

# See status of spark history server
systemctl status spark-history

# Clear Logs
rm -rf /opt/spark/logs/*
systemctl restart spark-master
systemctl restart spark-slave
systemctl restart spark-history

# Show logs
ls /opt/spark/logs/
 spark-spark-org.apache.spark.deploy.history.HistoryServer-1-node0.out
 spark-spark-org.apache.spark.deploy.master.Master-1-node0.out
 spark-spark-org.apache.spark.deploy.worker.Worker-1-node0.out

 # Tail history log
 tail -f /opt/spark/logs/spark-spark-org.apache.spark.deploy.history.HistoryServer-1-node0.out

 # Tail master log
 tail -f  /opt/spark/logs/spark-spark-org.apache.spark.deploy.master.Master-1-node0.out

 # Tail worker log
 tail -f /opt/spark/logs/spark-spark-org.apache.spark.deploy.worker.Worker-1-node0.out
Install notes, not instructions just notes
This section is not anything you have to do, it is what the above scripts did to install this cluster.
Notes: We use Untar to untar the spark distro
tar xvzf spark.tgzSpark Install directory
To install spark we do this.
mkdir -p /opt/
mv spark-2.3.0-bin-hadoop2.7/ /opt/spark
ls /opt/spark/
This is done by an ansible playbook.
See spark standalone set up for more details.
Next we want to edit the /opt/spark/conf/spark-env.sh (see spark-env.sh.template)
SPARK_LOCAL_IP=192.168.50.6
SPARK_PUBLIC_DNS=node2
SPARK_MASTER_HOST=node2
The above is automated with ansible and jinja.
Notes: To run the master
Then we can run the master.
/opt/spark/sbin/start-master.sh
Note we run the master via ansible and systemd.
tail the log of the spark master
We can also tail the log of the master.
tail -f /var/spark/logs/spark-root-org.apache.spark.deploy.master.Master-1-localhost.localdomain.out
Output
org.apache.spark.deploy.master.Master --host localhost --port 7077 --webui-port 8080
Go to browser
We can see that the master is running. At this point spark is running.
Go to http://192.168.50.6:8080/
Then See URLs on this page as follows:
URL: spark://localhost:7077
REST URL: spark://localhost:6066 (cluster mode)
Notes Log into another node
Install Spark here.
Connect a worker to the master.
/opt/spark/sbin/start-slave.sh spark://192.168.50.6:7077Notes Slaves file
cat slaves
#
# Licensed to the Apache Software Foundation (ASF) under one or more
# contributor license agreements.  See the NOTICE file distributed with
# this work for additional information regarding copyright ownership.
# The ASF licenses this file to You under the Apache License, Version 2.0
# (the "License"); you may not use this file except in compliance with
# the License.  You may obtain a copy of the License at
#
#    http://www.apache.org/licenses/LICENSE-2.0
#
# Unless required by applicable law or agreed to in writing, software
# distributed under the License is distributed on an "AS IS" BASIS,
# WITHOUT WARRANTIES OR CONDITIONS OF ANY KIND, either express or implied.
# See the License for the specific language governing permissions and
# limitations under the License.
#

# A Spark Worker will be started on each of the machines listed below.
node0
node1
node2
To visualize the DAGS and see job / worker/ application metrics, we will want the spark job history server.
Running jobs to see / generate metrics
To see metrics, we will want to run some jobs.
Run SparkPi example with enable log true (for history server).
 /opt/spark/bin/spark-submit --class org.apache.spark.examples.SparkPi \
 --master spark://node0:7077 \
 --conf spark.eventLog.enabled=true \
 /opt/spark/examples/jars/spark-examples_2.11-2.3.0.jar
Run SparkPageRank example with enable log true (for history server).
/opt/spark/bin/spark-submit \
  --class org.apache.spark.examples.SparkPageRank \
  --master spark://node0:7077 \
  --conf spark.eventLog.enabled=true \
  /opt/spark/examples/jars/spark-examples_2.11-2.3.0.jar \
  /opt/spark/data/mllib/pagerank_data.txt 20 &
/opt/spark/bin/spark-submit \
--class org.apache.spark.examples.SparkPageRank \
--master spark://node0:6066 \
--deploy-mode cluster \
--conf spark.eventLog.enabled=true \
/opt/spark/examples/jars/spark-examples_2.11-2.3.0.jar \
/opt/spark/data/mllib/pagerank_data.txt 20 &Spark Job History Server
With the Spark Job History server we can track metrics.
You run the history server using this command.
/opt/spark/sbin/start-history-server.shWe install this with an ansible playbook.
With the history server running, it should be easy to track time for serialization, scheduler and more.
- Scheduler Delay
- Task Deserialization Time
- Result Serialization Time
- Getting Result Time
- Peak Execution Memory
This will tell us where any bottlenecks occur.
Spark metrics
Spark has an internal metrics system based on Yammer metrics (now Code Hale Metrics or DropWizard metrics).
Spark allows metrics to be sent from various sources to one more sinks.
The instance which provide sources are:
- "master"
- "worker"
- "executor"
- "driver"
- "applications"
A wildcard "*" denotes all sources inherits the property config.
Within an instance, a "source" specifies a grouped source of related metrics.
Spark Internal sources to track internal state are as follows:
- MasterSource
- WorkerSource
- DAGSchedulerSource
- ApplicationSource
- CacheMetrics
- CodegenMetrics
- possibly more
System sources:
- JvmSource (for JVM metrics)
Sinks are where metrics and KPIs get delivered to (StatsD, JMX, file).
To specify metrics use "spark.metrics.conf=${SPARK_HOME}/conf/metrics.properties"
If you put the metrics file in ${SPARK_HOME}/conf it gets loaded automatically.
MetricsServlet sink is added by default as a sink in the master, worker and driver. Just send HTTP requests to the "/metrics/json" to get a snapshot of metrics.
Use "/metrics/master/json" and "/metrics/applications/json" endpoints to the master node.
Curling master for metrics for master
Since MetricsServlet is built-in and on by default you can curl it to see metrics.
Curling Spark for metrics
curl http://node0:8080/metrics/master/json/ | jq
"
  "version": "3.1.3",
  "gauges": {
    "master.aliveWorkers": {
      "value": 3
    },
    "master.apps": {
      "value": 0
    },
    "master.waitingApps": {
      "value": 0
    },
    "master.workers": {
      "value": 3
    }
    "
Curling master for applications
curl http://node0:8080/metrics/applications/json/ | jq
"
{
  "version": "3.1.3",
  "gauges": {
    "application.Spark Pi.1521748826010.cores": {
      "value": 12
    },
    "application.Spark Pi.1521748826010.runtime_ms": {
      "value": 3700
    },
    "application.Spark Pi.1521748826010.status": {
      "value": "FINISHED"
    },
    "application.Spark Pi.1521748914505.cores": {
      "value": 12
    },
"
Curling worker for metrics
The default path is /metrics/json for all instances except the master which was shown earlier. (Recall Master has /metrics/applications/json for apps and /metrics/master/json
for master).
$ curl  http://node1:8081/metrics/json/ | jq
...
"
{
  "version": "3.1.3",
  "gauges": {
    "worker.coresFree": {
      "value": 4
    },
    "worker.coresUsed": {
      "value": 0
    },
    "worker.executors": {
      "value": 0
    },
    "worker.memFree_MB": {
      "value": 1844
    },
    "worker.memUsed_MB": {
      "value": 0
    }
  },
  "counters": {
    "HiveExternalCatalog.fileCacheHits": {
      "count": 0
    },
"
List of available sinks in metrics.properties
The built-in sinks are as follows:
- ConsoleSink
- CSVSink
- GangliaSink
- JmxSink
- GraphiteSink
- StatsdSink
You can configure more sinks as follows:
Spark metrics sink setup
# org.apache.spark.metrics.sink.ConsoleSink
#   Name:   Default:   Description:
#   period  10         Poll period
#   unit    seconds    Unit of the poll period

# org.apache.spark.metrics.sink.CSVSink
#   Name:     Default:   Description:
#   period    10         Poll period
#   unit      seconds    Unit of the poll period
#   directory /tmp       Where to store CSV files

# org.apache.spark.metrics.sink.GangliaSink
#   Name:     Default:   Description:
#   host      NONE       Hostname or multicast group of the Ganglia server,
#                        must be set
#   port      NONE       Port of the Ganglia server(s), must be set
#   period    10         Poll period
#   unit      seconds    Unit of the poll period
#   ttl       1          TTL of messages sent by Ganglia
#   dmax      0          Lifetime in seconds of metrics (0 never expired)
#   mode      multicast  Ganglia network mode ('unicast' or 'multicast')

# org.apache.spark.metrics.sink.JmxSink

# org.apache.spark.metrics.sink.MetricsServlet
#   Name:     Default:   Description:
#   path      VARIES*    Path prefix from the web server root
#   sample    false      Whether to show entire set of samples for histograms
#                        ('false' or 'true')
#

# org.apache.spark.metrics.sink.GraphiteSink
#   Name:     Default:      Description:
#   host      NONE          Hostname of the Graphite server, must be set
#   port      NONE          Port of the Graphite server, must be set
#   period    10            Poll period
#   unit      seconds       Unit of the poll period
#   prefix    EMPTY STRING  Prefix to prepend to every metric's name
#   protocol  tcp           Protocol ("tcp" or "udp") to use

# org.apache.spark.metrics.sink.StatsdSink
#   Name:     Default:      Description:
#   host      127.0.0.1     Hostname or IP of StatsD server
#   port      8125          Port of StatsD server
#   period    10            Poll period
#   unit      seconds       Units of poll period
#   prefix    EMPTY STRING  Prefix to prepend to metric name
Examples spark stats metrics config
To enable Enable JmxSink for all instances use this config.
*.sink.jmx.class=org.apache.spark.metrics.sink.JmxSinkTo enable ConsoleSink for all instances by class name use
*.sink.console.class=org.apache.spark.metrics.sink.ConsoleSinkTo enable StatsdSink for all instances by class name
*.sink.statsd.class=org.apache.spark.metrics.sink.StatsdSink
*.sink.statsd.prefix=spark
You can also set poll period for various sinks.
Here we set the polling period for ConsoleSink.
# Polling period for the ConsoleSink
*.sink.console.period=10
# Unit of the polling period for the ConsoleSink
*.sink.console.unit=seconds
Here we set the polling period for ConsoleSink but only for master.
# Polling period for the ConsoleSink specific for the master instance
master.sink.console.period=15
# Unit of the polling period for the ConsoleSink specific for the master
# instance
master.sink.console.unit=seconds
To enable JvmSource for master, worker and driver we would do the following:
# Enable JvmSource for instance master, worker, driver and executor
master.source.jvm.class=org.apache.spark.metrics.source.JvmSource
worker.source.jvm.class=org.apache.spark.metrics.source.JvmSource
driver.source.jvm.class=org.apache.spark.metrics.source.JvmSource
executor.source.jvm.class=org.apache.spark.metrics.source.JvmSource
Sample metrics config metrics.properties
We plan on using InfluxDB and Telegraf to capture metrics. Let's set up an example and since we have not installed Telegraf or InfluxDB yet, let's use the console to capture metrics.
*.sink.statsd.class=org.apache.spark.metrics.sink.StatsdSink
*.sink.statsd.prefix=spark
*.sink.statsd.port=8125
*.sink.statsd.unit=seconds
*.sink.statsd.period=3
*.sink.statsd.host=node1

*.sink.console.class=org.apache.spark.metrics.sink.ConsoleSink
*.sink.console.period=3
*.sink.console.seconds=seconds

master.source.jvm.class=org.apache.spark.metrics.source.JvmSource
worker.source.jvm.class=org.apache.spark.metrics.source.JvmSource
driver.source.jvm.class=org.apache.spark.metrics.source.JvmSource
executor.source.jvm.class=org.apache.spark.metrics.source.JvmSource
Sample console metrics output log
Here is a sample spark metrics output from using the above config.
tail -f /opt/spark/logs/spark-spark-org.apache.spark.deploy.master.Master-1-node0.out \

-- Gauges ----------------------------------------------------------------------
jvm.PS-MarkSweep.count
             value = 2
jvm.PS-MarkSweep.time
             value = 62
jvm.heap.usage
             value = 0.09392405577507208
jvm.heap.used
             value = 89671968
...

-- Counters --------------------------------------------------------------------
HiveExternalCatalog.fileCacheHits
             count = 0
HiveExternalCatalog.filesDiscovered
             count = 0
...
-- Histograms ------------------------------------------------------------------
CodeGenerator.compilationTime
             count = 0
               min = 0
               max = 0
              mean = 0.00
            stddev = 0.00
            median = 0.00
              75% <= 0.00
             value = -3.9609096E7
jvm.pools.Code-Cache.init
             value = 2555904
              95% <= 0.00
              98% <= 0.00
              99% <= 0.00
            99.9% <= 0.00
...
master.aliveWorkers
             value = 3
master.apps
             value = 0
master.waitingApps
             value = 0
master.workers
             value = 3

-- Counters --------------------------------------------------------------------
HiveExternalCatalog.fileCacheHits
             count = 0
...
InfluxDB and friends
Telegraf https://docs.influxdata.com/telegraf/v1.5/plugins/inputs/
System input https://github.com/influxdata/telegraf/tree/release-1.5/plugins/inputs/system
Disk input https://github.com/influxdata/telegraf/blob/release-1.5/plugins/inputs/system/DISK_README.md
CPU input https://github.com/influxdata/telegraf/blob/release-1.5/plugins/inputs/system/CPU_README.md
Memory input https://github.com/influxdata/telegraf/blob/release-1.5/plugins/inputs/system/MEM_README.md
System https://github.com/influxdata/telegraf/blob/release-1.5/plugins/inputs/system/SYSTEM_README.md
telegraf.conf
[agent]
  interval = "10s"
  round_interval = true
  metric_batch_size = 100
  metric_buffer_limit = 400
  collection_jitter = "0s"
  flush_jitter = "0s"
  precision = ""
  debug = true
  quiet = false
  logfile = "/var/log/telegraf/debug.log"

# See https://github.com/influxdata/telegraf/tree/master/plugins/inputs/statsd

[[outputs.file]]
    files = ["stdout", "/var/log/telegraf/metrics.log" ]


# see https://github.com/influxdata/telegraf/tree/master/plugins/outputs/influxdb

# Configuration for influxdb server to send metrics to
[[outputs.influxdb]]
  urls = ["udp://node2:8089"]
  database = "spark"
  retention_policy = ""
  write_consistency = "any"

# Statsd Server input
[[inputs.statsd]]
  protocol = "udp"
  service_address = "localhost:8125"
  delete_gauges = true
  delete_counters = true
  delete_sets = true
  delete_timings = true
  percentiles = [90,95,99]
  metric_separator = "_"
  parse_data_dog_tags = false
  allowed_pending_messages = 10000
  percentile_limit = 1000

# Read metrics about disk usage by mount point
[[inputs.disk]]
    # Setting mountpoints will restrict the stats to the specified mountpoints.
    # mount_points = ["/"]

[[inputs.diskio]]
    ## Setting devices will restrict the stats to the specified devices.
    # devices = ["sda", "sdb"]

[[inputs.cpu]]
    ## Whether to report per-cpu stats or not
    percpu = true
    ## Whether to report total system cpu stats or not
    totalcpu = true
    ## If true, collect raw CPU time metrics.
    collect_cpu_time = true
    ## If true, compute and report the sum of all non-idle CPU states.
    report_active = false
    # Read metrics about memory usage

# Read metrics about memory usage
[[inputs.mem]]
    # no configuration

# Read metrics about system load & uptime
[[inputs.system]]
    # no configuration

# Gather metrics about network interfaces
[[inputs.net]]
  ## By default, telegraf gathers stats from any up interface (excluding loopback)
  ## Setting interfaces will tell it to gather these explicit interfaces,
  ## regardless of status. When specifying an interface, glob-style
  ## patterns are also supported.
  ##
  # interfaces = ["eth*", "enp0s[0-1]", "lo"]
  ##

[[inputs.netstat]]

# Get kernel statistics from /proc/stat
[[inputs.kernel]]
  # no configuration

[[inputs.linux_sysctl_fs]]
The above telegraf setup captures most of the important operating systems bits.
Telegraf also has a statsD input which we use. We send the Spark Metrics to the Telegraf input. Then all of the OS metrics and the statsD Spark metrics go into InfluxDB.
The InfluxDB configuration is as follows:
influxdb.conf
[meta]
  # Where the metadata/raft database is stored
  dir = "/var/lib/influxdb/meta"

[data]
  # The directory where the TSM storage engine stores TSM files.
  dir = "/var/lib/influxdb/data"

  # The directory where the TSM storage engine stores WAL files.
  wal-dir = "/var/lib/influxdb/wal"

  # Trace logging provides more verbose output around the tsm engine. Turning
  # this on can provide more useful output for debugging tsm engine issues.
  trace-logging-enabled = true

  # Whether queries should be logged before execution. Very useful for troubleshooting, but will
  # log any sensitive data contained within a query.
  query-log-enabled = true

  # Settings for the TSM engine

  # CacheMaxMemorySize is the maximum size a shard's cache can
  # reach before it starts rejecting writes.
  # Valid size suffixes are k, m, or g (case insensitive, 1024 = 1k).
  # Vaues without a size suffix are in bytes.
  # cache-max-memory-size = "1g"

  # CacheSnapshotMemorySize is the size at which the engine will
  # snapshot the cache and write it to a TSM file, freeing up memory
  # Valid size suffixes are k, m, or g (case insensitive, 1024 = 1k).
  # Values without a size suffix are in bytes.
  # cache-snapshot-memory-size = "25m"

  # CacheSnapshotWriteColdDuration is the length of time at
  # which the engine will snapshot the cache and write it to
  # a new TSM file if the shard hasn't received writes or deletes
  # cache-snapshot-write-cold-duration = "10m"

  # CompactFullWriteColdDuration is the duration at which the engine
  # will compact all TSM files in a shard if it hasn't received a
  # write or delete
  # compact-full-write-cold-duration = "4h"

  # The maximum number of concurrent full and level compactions that can run at one time.  A
  # value of 0 results in 50% of runtime.GOMAXPROCS(0) used at runtime.  Any number greater
  # than 0 limits compactions to that value.  This setting does not apply
  # to cache snapshotting.
  # max-concurrent-compactions = 0

  # The maximum series allowed per database before writes are dropped.  This limit can prevent
  # high cardinality issues at the database level.  This limit can be disabled by setting it to
  # 0.
  # max-series-per-database = 1000000

  # The maximum number of tag values per tag that are allowed before writes are dropped.  This limit
  # can prevent high cardinality tag values from being written to a measurement.  This limit can be
  # disabled by setting it to 0.
  # max-values-per-tag = 100000

###
### [retention]
###
### Controls the enforcement of retention policies for evicting old data.
###

[retention]
  # Determines whether retention policy enforcement enabled.
  enabled = true

  # The interval of time when retention policy enforcement checks run.
  check-interval = "30m"

###
### Controls the system self-monitoring, statistics and diagnostics.
###
### The internal database for monitoring data is created automatically if
### if it does not already exist. The target retention within this database
### is called 'monitor' and is also created with a retention period of 7 days
### and a replication factor of 1, if it does not exist. In all cases the
### this retention policy is configured as the default for the database.

[monitor]
  # Whether to record statistics internally.
  store-enabled = true

  # The destination database for recorded statistics
  store-database = "_internal"

  # The interval at which to record statistics
  store-interval = "10s"

###
### [http]
###
### Controls how the HTTP endpoints are configured. These are the primary
### mechanism for getting data into and out of InfluxDB.
###

[http]
  # Determines whether HTTP endpoint is enabled.
  enabled = true

  # The bind address used by the HTTP service.
  bind-address = ":8086"

  # Determines whether user authentication is enabled over HTTP/HTTPS.
  auth-enabled = false

  # The default realm sent back when issuing a basic auth challenge.
  realm = "InfluxDB"

  # Determines whether HTTP request logging is enabled.
  log-enabled = true

  # When HTTP request logging is enabled, this option specifies the path where
  # log entries should be written. If unspecified, the default is to write to stderr, which
  # intermingles HTTP logs with internal InfluxDB logging.
  #
  # If influxd is unable to access the specified path, it will log an error and fall back to writing
  # the request log to stderr.
  access-log-path = ""

  # Determines whether detailed write logging is enabled.
  write-tracing = false

  # Determines whether the pprof endpoint is enabled.  This endpoint is used for
  # troubleshooting and monitoring.
  # pprof-enabled = true

  # Determines whether HTTPS is enabled.
  https-enabled = false

  # The SSL certificate to use when HTTPS is enabled.
  # https-certificate = "/etc/ssl/influxdb.pem"

  # Use a separate private key location.
  # https-private-key = ""

  # The JWT auth shared secret to validate requests using JSON web tokens.
  # shared-secret = ""

  # The default chunk size for result sets that should be chunked.
  # max-row-limit = 0

  # The maximum number of HTTP connections that may be open at once.  New connections that
  # would exceed this limit are dropped.  Setting this value to 0 disables the limit.
  # max-connection-limit = 0

  # Enable http service over unix domain socket
  # unix-socket-enabled = false

  # The path of the unix domain socket.
  # bind-socket = "/var/run/influxdb.sock"

  # The maximum size of a client request body, in bytes. Setting this value to 0 disables the limit.
  # max-body-size = 25000000


###
### [ifql]
###
### Configures the ifql RPC API.
###

[ifql]
  # Determines whether the RPC service is enabled.
  # enabled = true

  # Determines whether additional logging is enabled.
  # log-enabled = true

  # The bind address used by the ifql RPC service.
  # bind-address = ":8082"


###
### [logging]
###
### Controls how the logger emits logs to the output.
###

[logging]
  # Determines which log encoder to use for logs. Available options
  # are auto, logfmt, and json. auto will use a more a more user-friendly
  # output format if the output terminal is a TTY, but the format is not as
  # easily machine-readable. When the output is a non-TTY, auto will use
  # logfmt.
  # format = "auto"

  # Determines which level of logs will be emitted. The available levels
  # are error, warn, info, and debug. Logs that are equal to or above the
  # specified level will be emitted.
  # level = "info"

  # Suppresses the logo output that is printed when the program is started.
  # The logo is always suppressed if STDOUT is not a TTY.
  # suppress-logo = false

###
### [subscriber]
###
### Controls the subscriptions, which can be used to fork a copy of all data
### received by the InfluxDB host.
###

[subscriber]
  # Determines whether the subscriber service is enabled.
  # enabled = true

  # The default timeout for HTTP writes to subscribers.
  # http-timeout = "30s"

  # Allows insecure HTTPS connections to subscribers.  This is useful when testing with self-
  # signed certificates.
  # insecure-skip-verify = false

  # The path to the PEM encoded CA certs file. If the empty string, the default system certs will be used
  # ca-certs = ""

  # The number of writer goroutines processing the write channel.
  # write-concurrency = 40

  # The number of in-flight writes buffered in the write channel.
  # write-buffer-size = 1000


###
### [[udp]]
###
### Controls the listeners for InfluxDB line protocol data via UDP.
###

[[udp]]
  enabled = true
  bind-address = "node2:8089"
  # database = "udp"
  # retention-policy = ""

  # These next lines control how batching works. You should have this enabled
  # otherwise you could get dropped metrics or poor performance. Batching
  # will buffer points in memory if you have many coming in.

  # Flush if this many points get buffered
  # batch-size = 5000

  # Number of batches that may be pending in memory
  # batch-pending = 10

  # Will flush at least this often even if we haven't hit buffer limit
  # batch-timeout = "1s"

  # UDP Read buffer size, 0 means OS default. UDP listener will fail if set above OS max.
  # read-buffer = 0

###
### [continuous_queries]
###
### Controls how continuous queries are run within InfluxDB.
###

[continuous_queries]
  # Determines whether the continuous query service is enabled.
  # enabled = true

  # Controls whether queries are logged when executed by the CQ service.
  # log-enabled = true

  # Controls whether queries are logged to the self-monitoring data store.
  # query-stats-enabled = false

  # interval for how often continuous queries will be checked if they need to run
  # run-interval = "1s"
The spark metrics system is outputting StatsD to Telegraf which is inputting those metrics to InfluxDB.
/opt/spark/conf/metrics.properties
*.sink.statsd.class=org.apache.spark.metrics.sink.StatsdSink
*.sink.statsd.prefix=spark
*.sink.statsd.port=8125
*.sink.statsd.unit=seconds
*.sink.statsd.period=3
*.sink.statsd.host=localhost

*.sink.console.class=org.apache.spark.metrics.sink.ConsoleSink
*.sink.console.period=3
*.sink.console.seconds=seconds

master.source.jvm.class=org.apache.spark.metrics.source.JvmSource
worker.source.jvm.class=org.apache.spark.metrics.source.JvmSource
driver.source.jvm.class=org.apache.spark.metrics.source.JvmSource
executor.source.jvm.class=org.apache.spark.metrics.source.JvmSource
Systemd
Everywhere when possible we use Systemd to manage background servers. Systemd will ensure that the servers keep running. We install the Spark processes as services that will boot up when the server boots up.
System for Spark Slave service
[Unit]
Description=Apache Spark Master and Slave Servers
After=network.target
After=systemd-user-sessions.service
After=network-online.target

[Service]
User=spark
Type=forking
ExecStart=/opt/spark/sbin/start-slave.sh spark://192.168.50.4:7077
ExecStop=/opt/spark/sbin/stop-slave.sh spark://192.168.50.4:7077
TimeoutSec=30
Restart=on-failure
RestartSec= 30
StartLimitInterval=350
StartLimitBurst=10

[Install]
WantedBy=multi-user.target
About us
Cloudurable™: streamline DevOps for Cassandra, Kafka and Spark running on AWS provides AMIs, CloudWatch Monitoring, CloudFormation templates and monitoring tools to support Cassandra, Kafka, Spark in production running in EC2. We also teach for example advanced Cassandra courses which teach how one could develop, support and deploy Cassandra to production in AWS EC2 for Developers and DevOps. We offer Kafka training, Kafka consulting, Cassandra training, Cassandra consulting, Spark training, and Spark consulting.
More info
Please take some time to read the Advantage of using Cloudurable™.
Cloudurable provides:
- Subscription Cassandra support to streamline DevOps (Support subscription pricing for Cassandra and Kafka in AWS)
- Cassandra Course
- Cassandra Consulting: Quick Start
- Cassandra Consulting: Architecture Analysis
AWS Cassandra Deployment Guides
Kafka training, Kafka consulting, Cassandra training, Cassandra consulting, Spark training, Spark consulting