Battery charging and discharging planning
We have
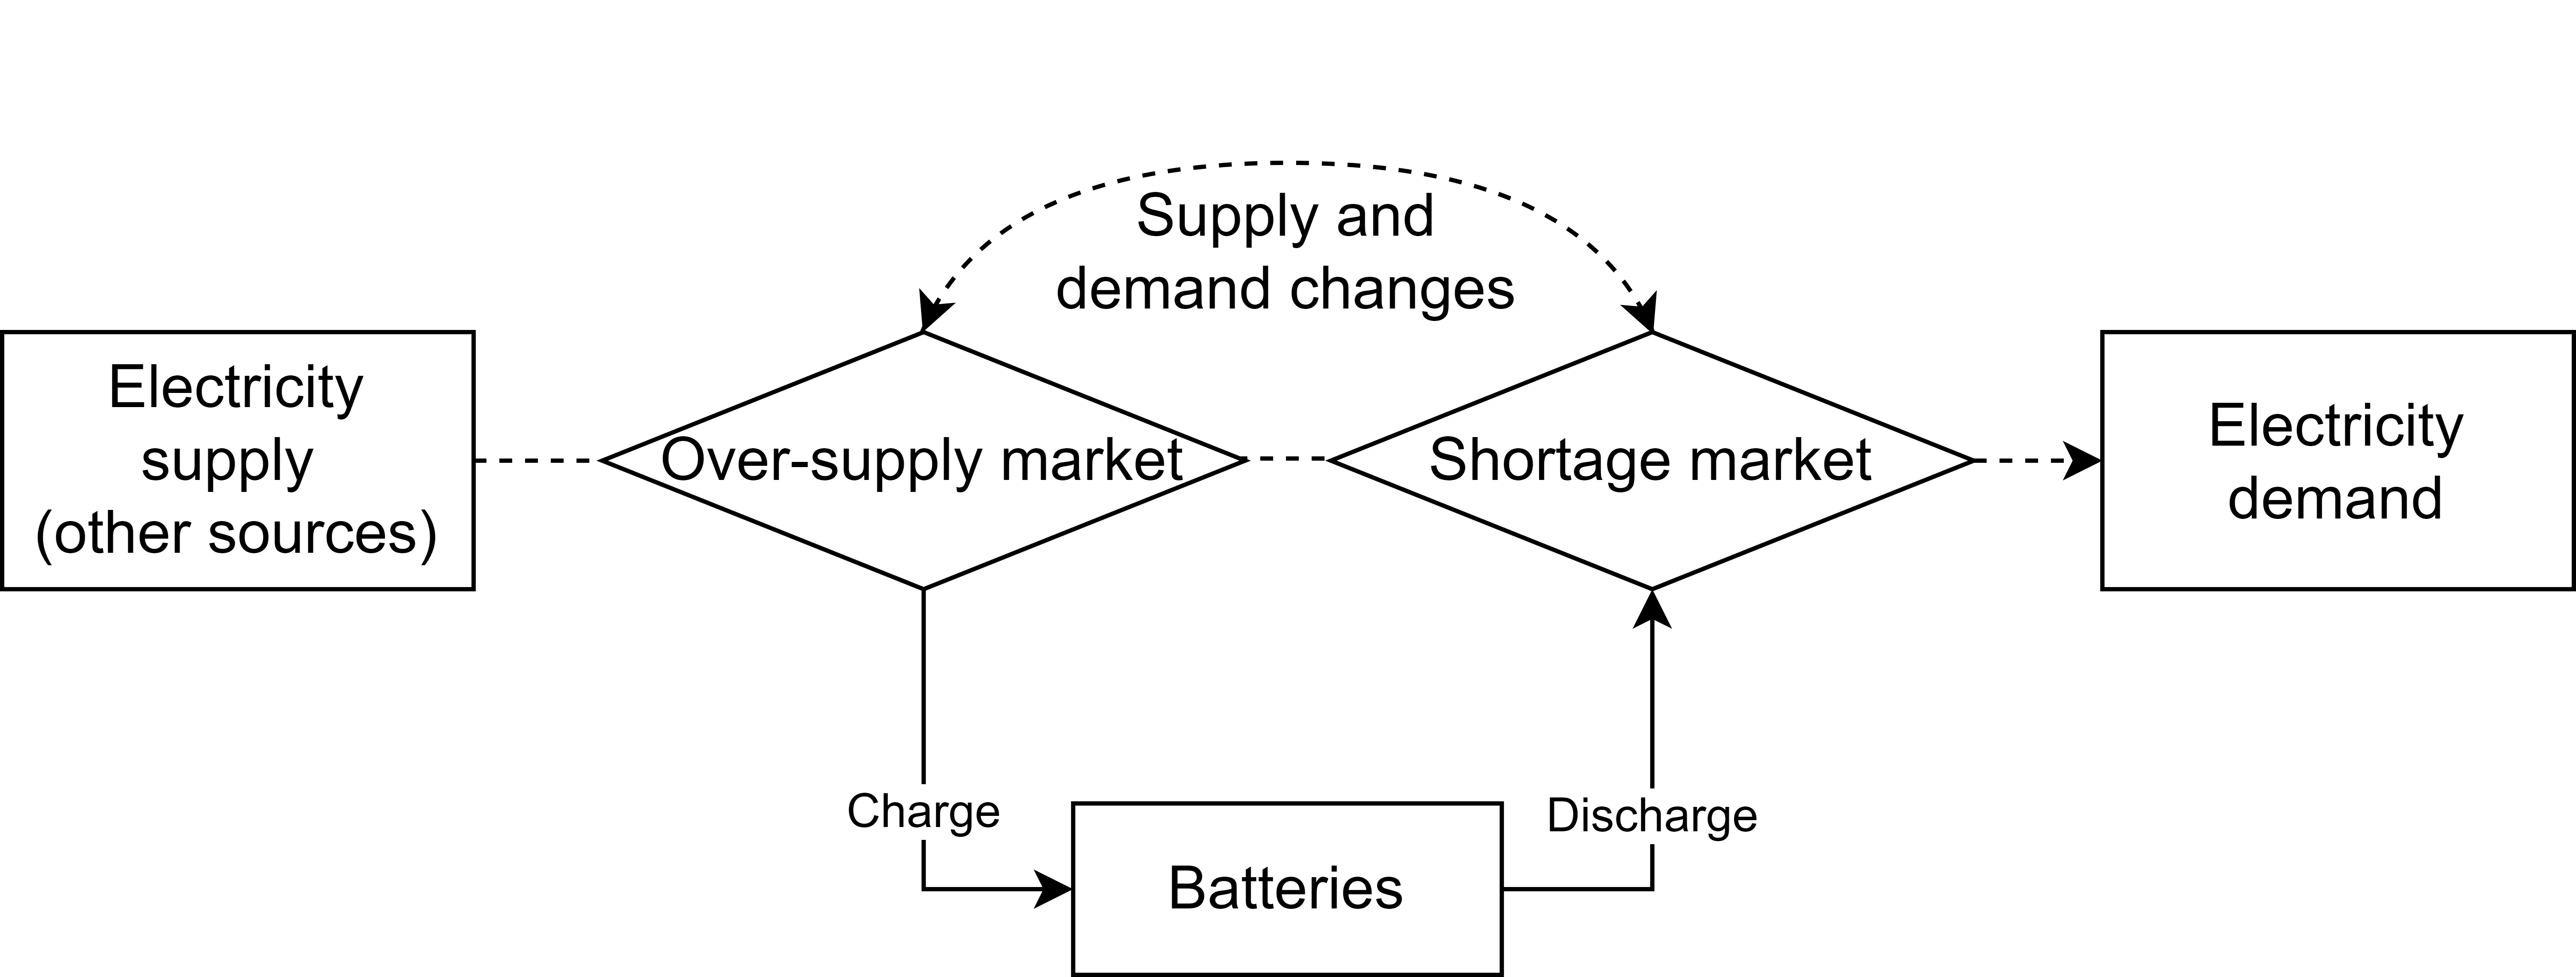
The electricity demand in each time slot (per hour) is known. Besides the batteries, other sources of power generation in each time slot are known as well. The demand minus all other sources' supply is the amount we need to serve. Denote this amount as
For each battery
- The maximum electricity capacity of each battery is
$C_{i}$ . - The charging efficiency is
$E_{i}$ , the ratio of the amount of electricity added into the battery over the amount of charged electricity. - The maximum charging power is
$I_{i}$ . - The maximum discharging power is
$O_{i}$ .
By default, all the variables are non-negative.
Let
Let
Let
Let
Let
Let
We penalize the total amount of unserved electricity.
The unserved electricity is lower bounded by the gap between discharging amount and demand. Over-generation is not penalized.
The charging deducts the discharging amount is equal to the difference of remained electricity in the battery between the current and the previous hour.
Specifically,
If the battery is not in the charging status, the amount of charging must be 0. If the battery is in the charging status, the amount can be as large as the maximum charging power.
A similar constraint is applied to discharging.
The battery cannot charge and discharge at the same time.
If the battery is fully charged, it cannot charge.
Similarly, if the battery is empty, it cannot discharge.
If the electricity produced by other sources cannot fulfill the demand, all batteries cannot charge.
Fill in the required parameters and click "Solve", the program will solve this problem and show results in 4 tabs.
In "Solution" tab, it gives the value of all variables. Refer to Javascript LP solver to understand the meaning of the results. If a variable is not presented, it's value is 0.
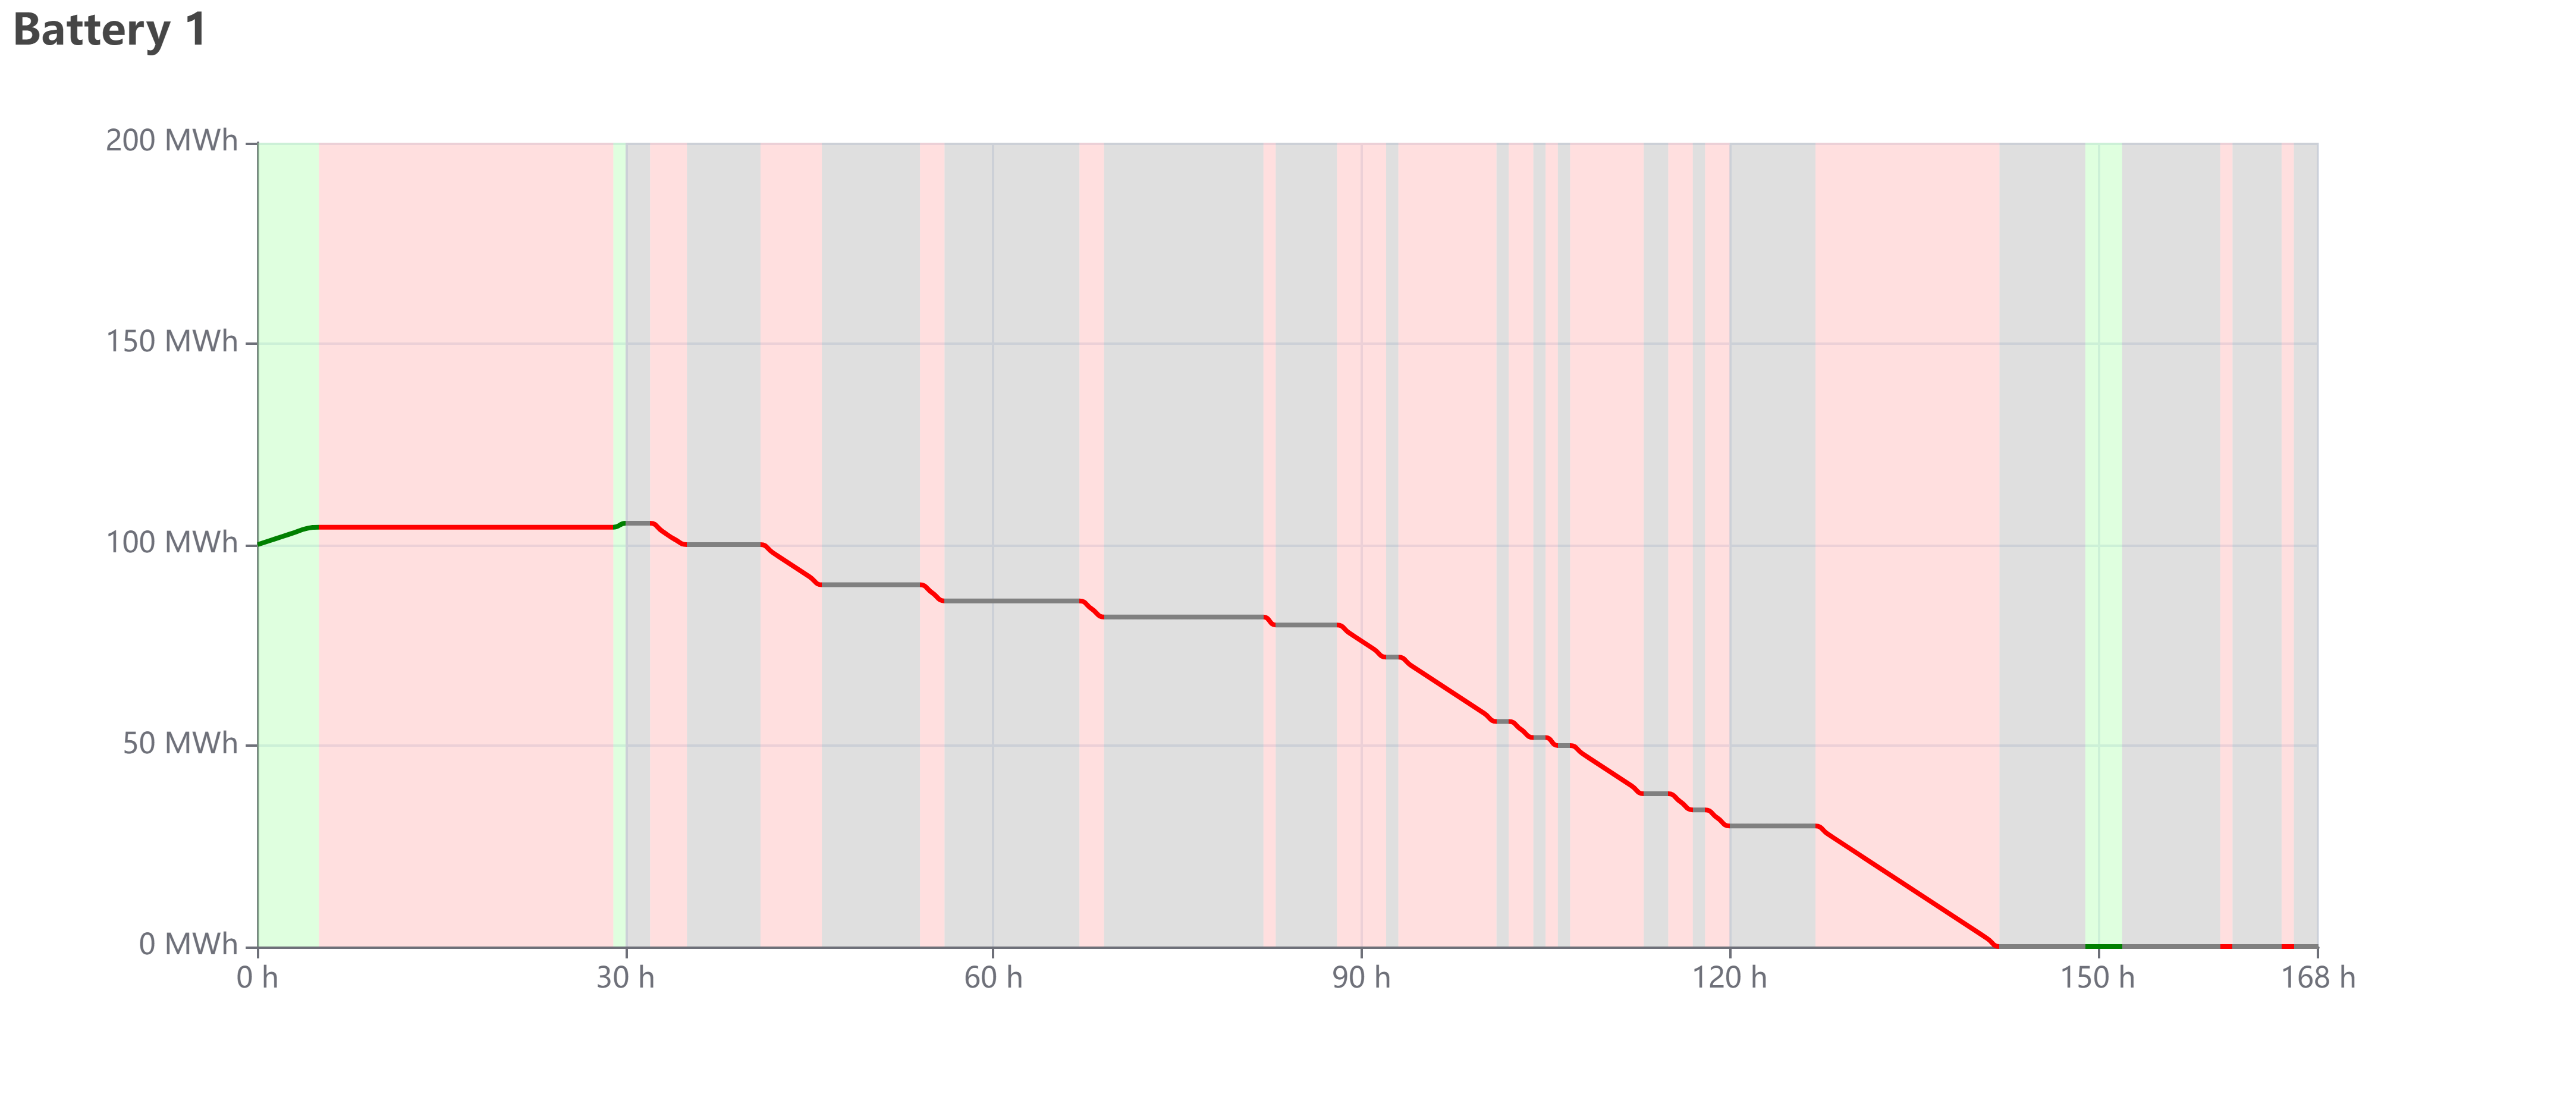
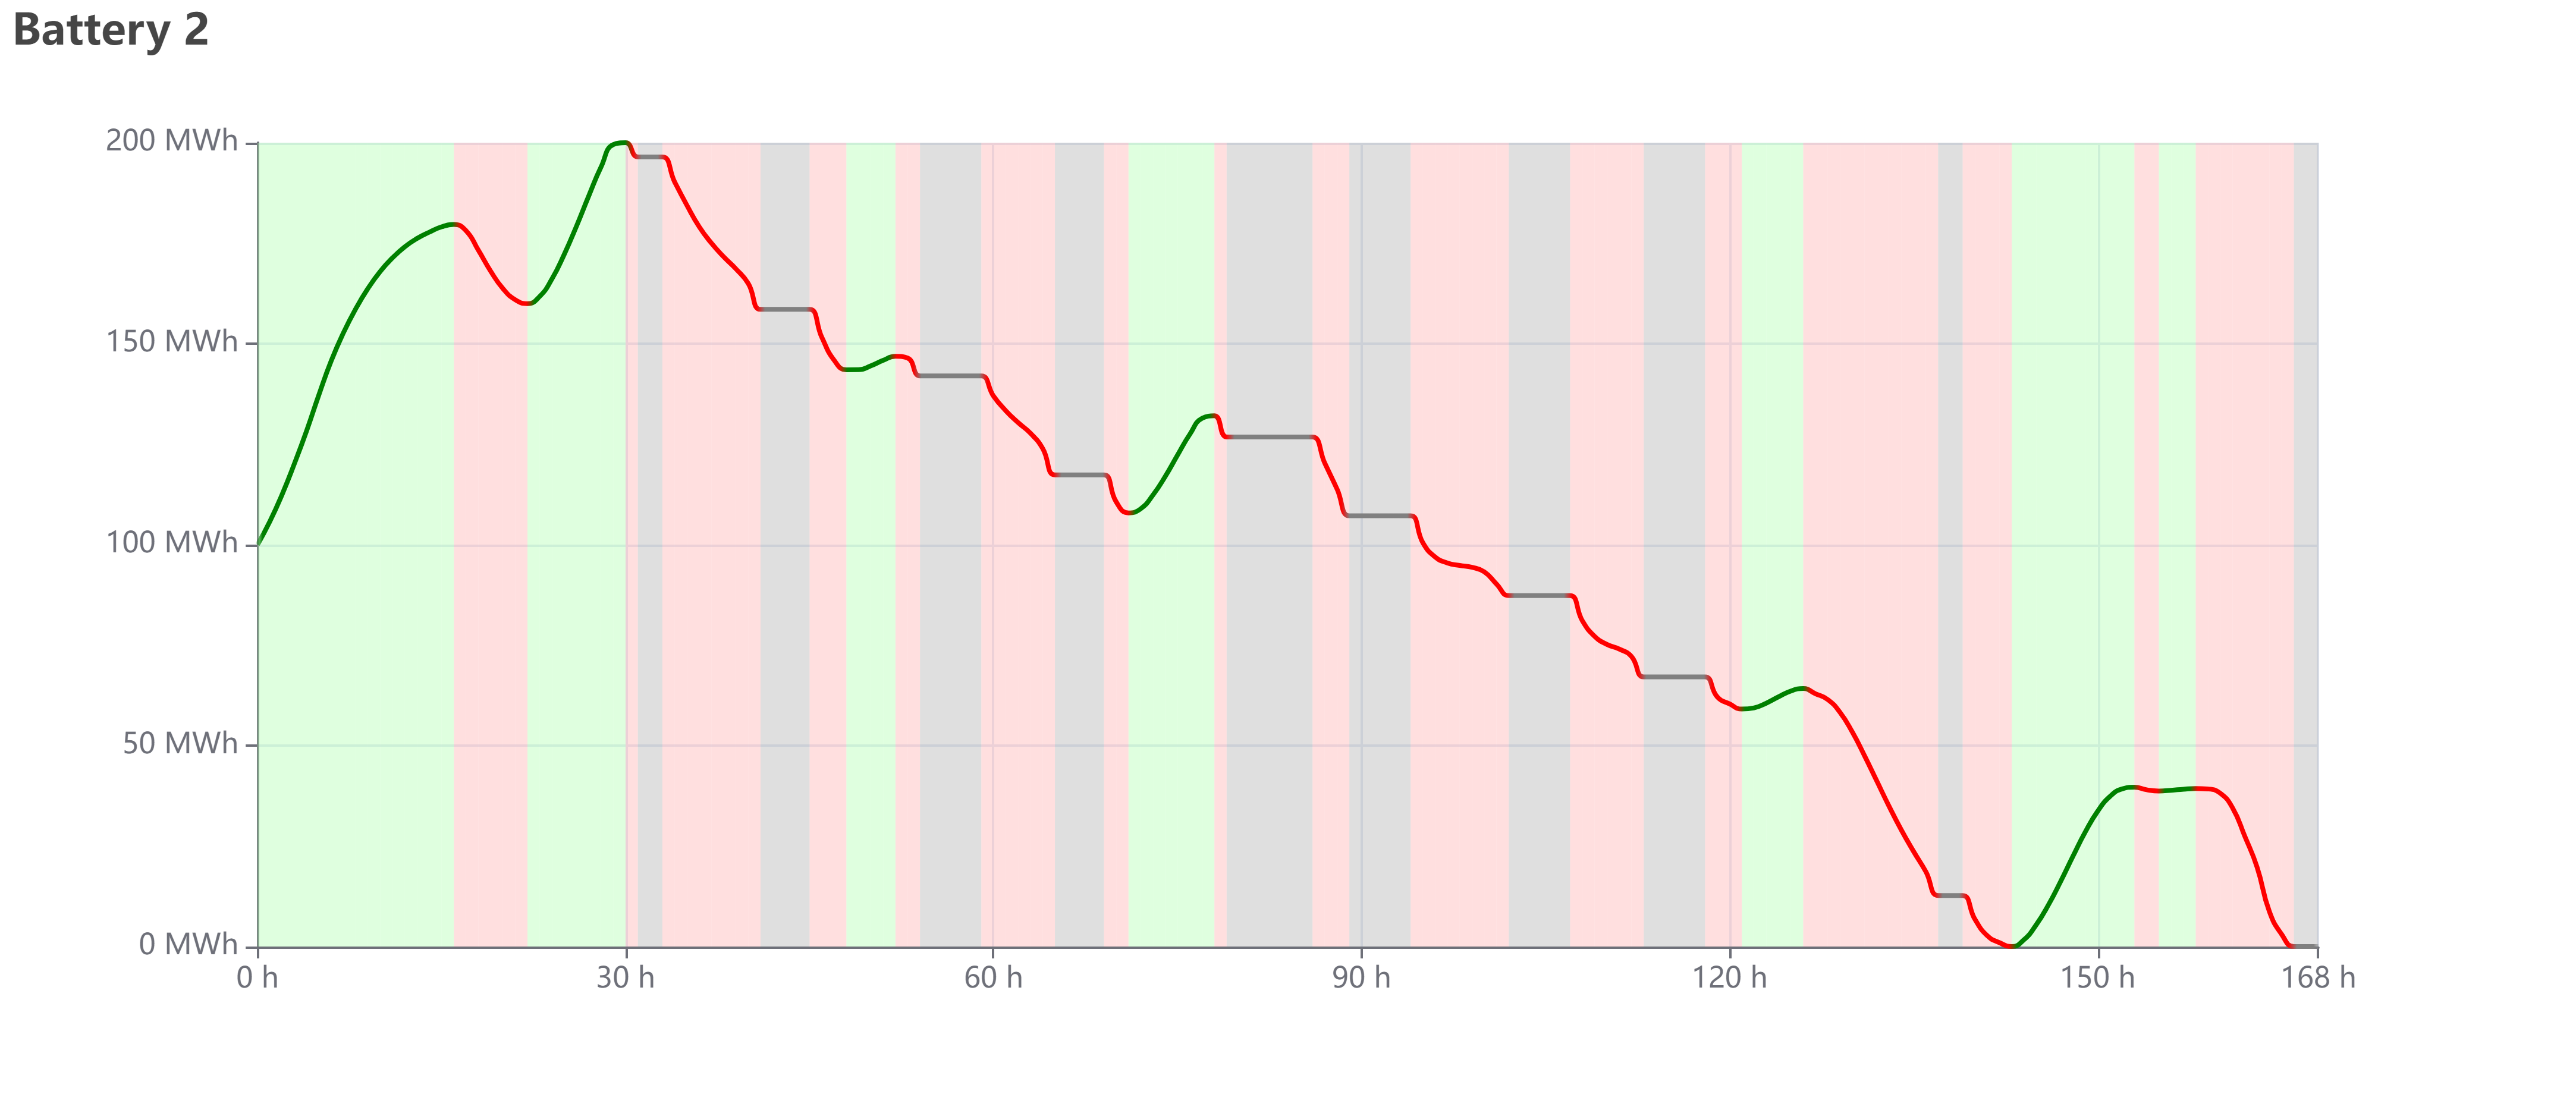
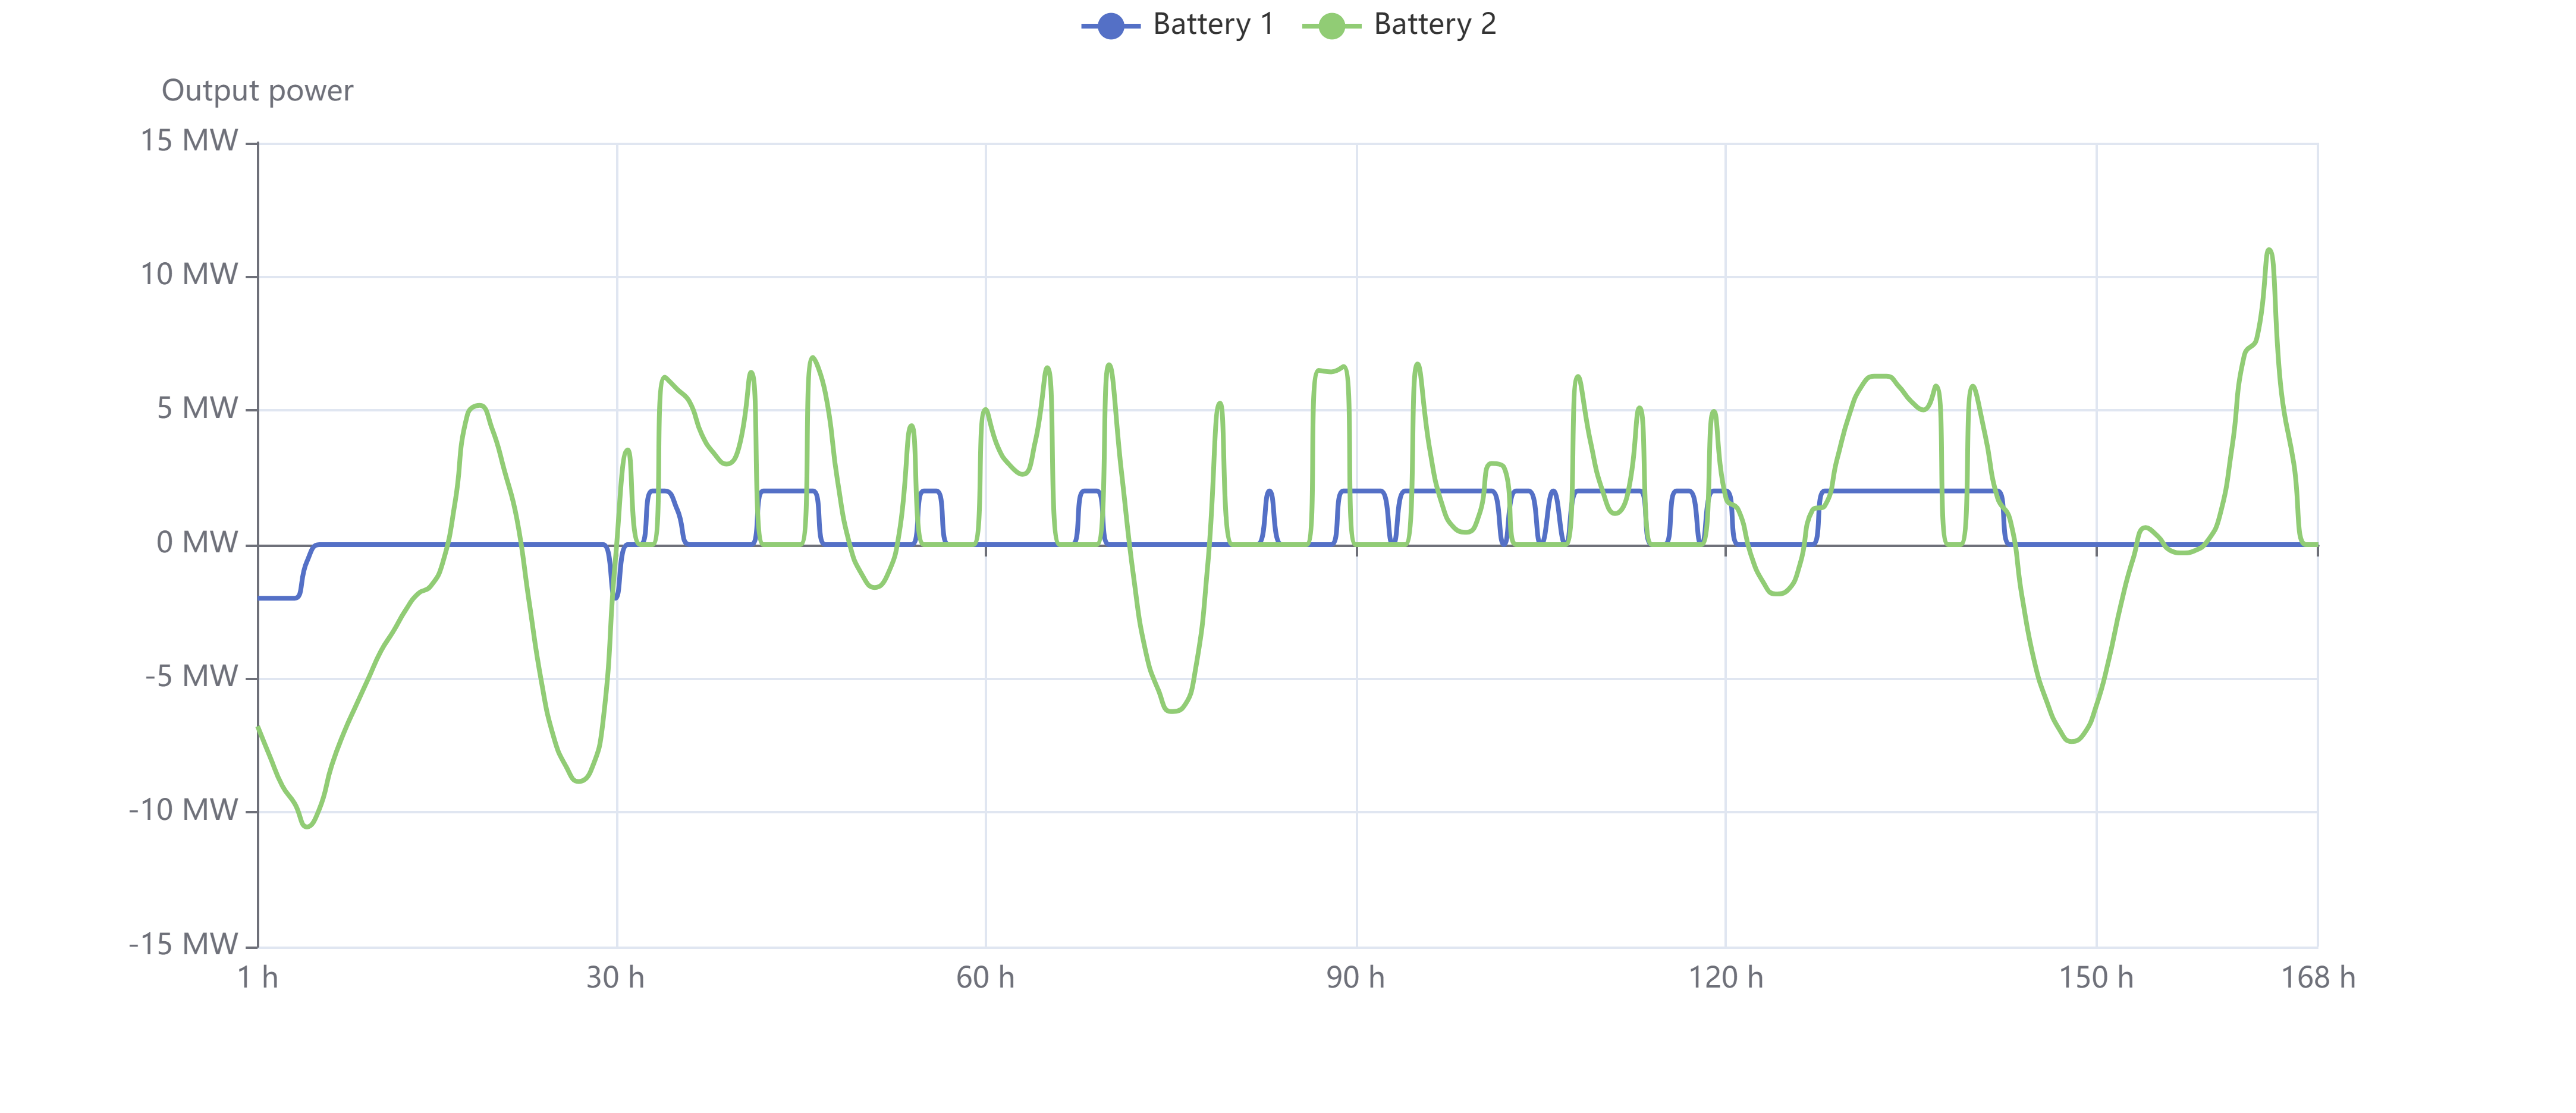
The following figures are only examples to explain how the results look like. The values in the figure are not an optimal solution.
In "Charging history" tab, it shows the figure of remained energy of each battery. The green line and background means charging; the red means discharging; the grey means idle. If the charging status of the background mismatches the increasing or decreasing value of remained energy, the solution must be not optimal. For example, if the background is red but the remained energy is increasing, there is
The maximum value of Y-axis always the energy capacity of battery, therefore the height ratio of curve means the battery level. The X-axis value "1 h" means at the moment of "1:00".
In "Power history" tab, it shows the output and input power of each battery. The positive part of Y-axis is output (discharging) power, and the negative part is input (charging) power. The X-axis value "1 h" means the end of the period "0:00 ~ 1:00".
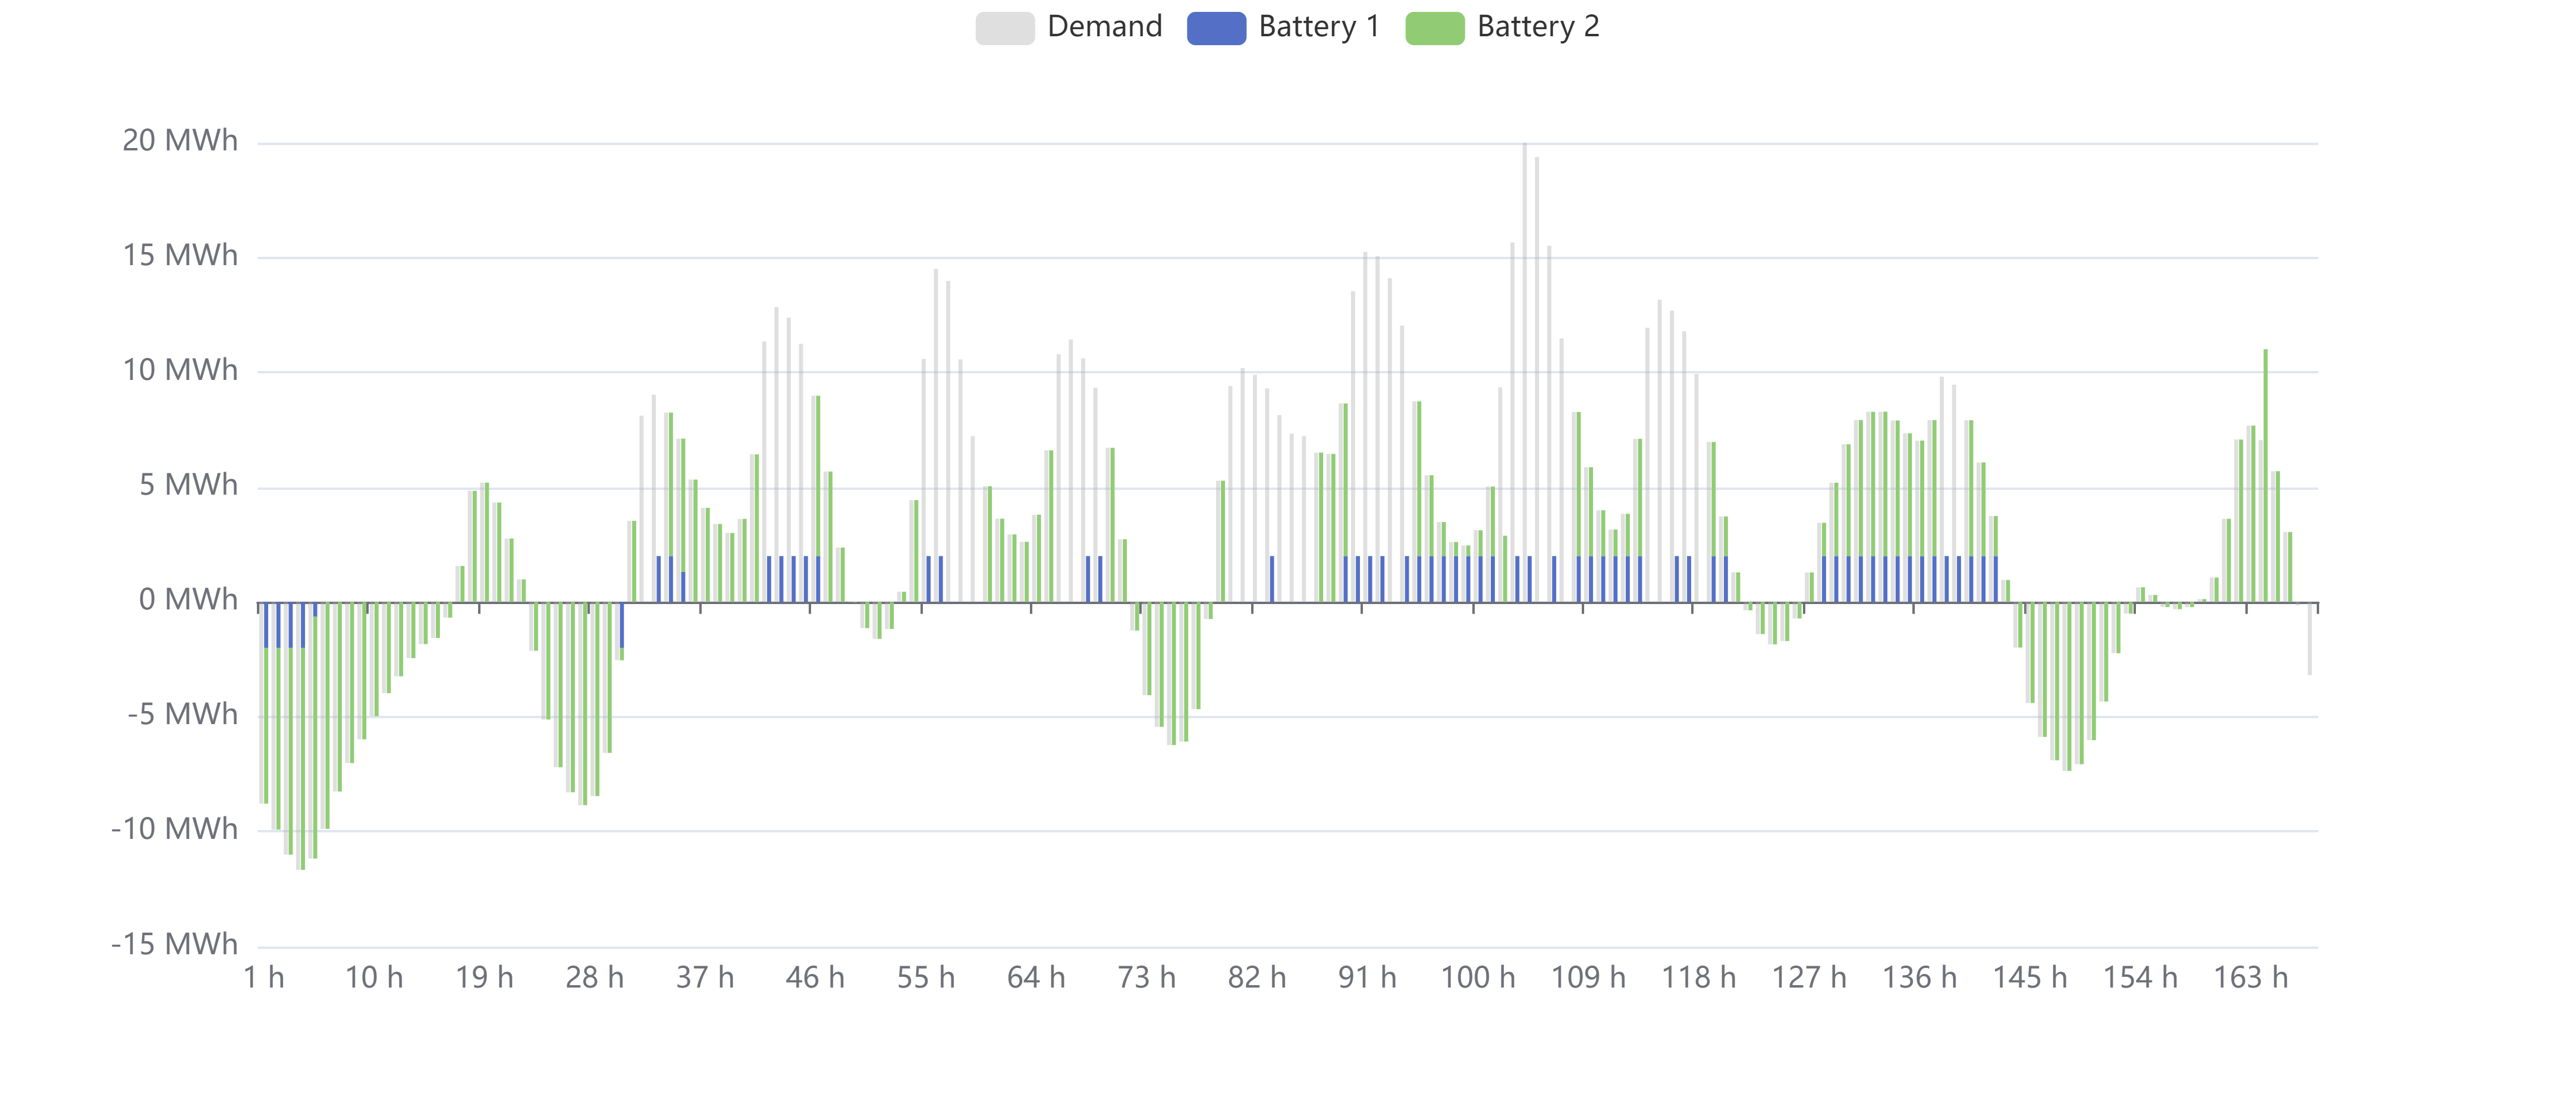
In "Served electricity" tab, the height of the grey bar is the amount of electricity demand. The positive value means other supply resources cannot fulfill the demand of the electricity market; the negative value means redundant electricity is available in the electricity market and batteries owner can use these energy to charge batteries. The stacked bars of batteries are the amount of energy taken or served in each period.
The following table explains how to compare the height of bars.
| Stacked height of battery bars ______ the height of grey bar. | Grey bar is positive. | Grey bar is negative. |
|---|---|---|
| equal to | All demand are served by the batteries group. | All redundant energy in the market is used to charge batteries. |
| is shorter than (absolute value in either direction) | The batteries group cannot fulfill the electricity demand. | Part of the redundant energy in the market is used to charge batteries, the other part is wasted. |
| is longer than | The batteries group over-serve electricity and the redundant electricity is wasted. | Infeasible. |
The X-axis value "1 h" means the end of the period "0:00 ~ 1:00".
