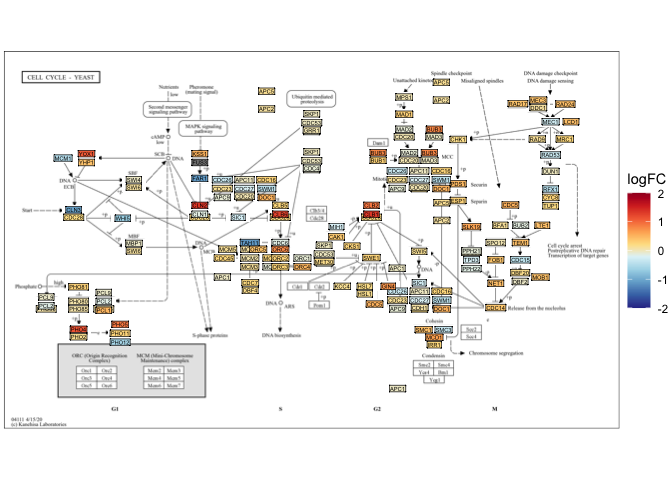
“Paralogs” is an innovative R package designed to enhance the analysis of gene expression data in KEGG pathways by visualizing the differential expression of all genes within KEGG nodes. Unlike traditional methods that collapse the expression levels of these genes, “Paralogs” maintains gene-level specificity, revealing nuanced regulatory and functional distinctions.
- Gene-Level Visualization: Visualize differential expression data for each gene within KEGG pathways.
- Integration with Bioinformatics Tools: Seamlessly works with popular R bioinformatics packages like DESeq2, edgeR, and limma.
- Customizable Outputs: Offers flexible customization options for your visualizations to meet diverse research needs.
You can install the development version of Paralogs from GitHub with:
# install.packages("devtools")
devtools::install_github("clstacy/Paralogs")Here’s how to get started with the “Paralogs” package:
library(Paralogs)

# load example data
gene_data <- data()
pathway_data <- data()

# Generate plots for paralogs
plotParalogs(gene_data, pathway_data)
The above example generates the resulting plot:
Contributions to “Paralogs” are welcome! Please reach out for details on the process for submitting pull requests to us.
This project is licensed under the MIT License - see the LICENSE.md file for details.
If you use “Paralogs” in your research, please cite:
Stacy, C and Lewis, J. (2024). Paralogs: An R Package for Visualizing Differential Expression of Paralogs in KEGG Gene Pathways. GitHub repository, https://github.com/clstacy/Paralogs
For questions and feedback, please reach out to me at clstacy.stat[at]gmail.com.
