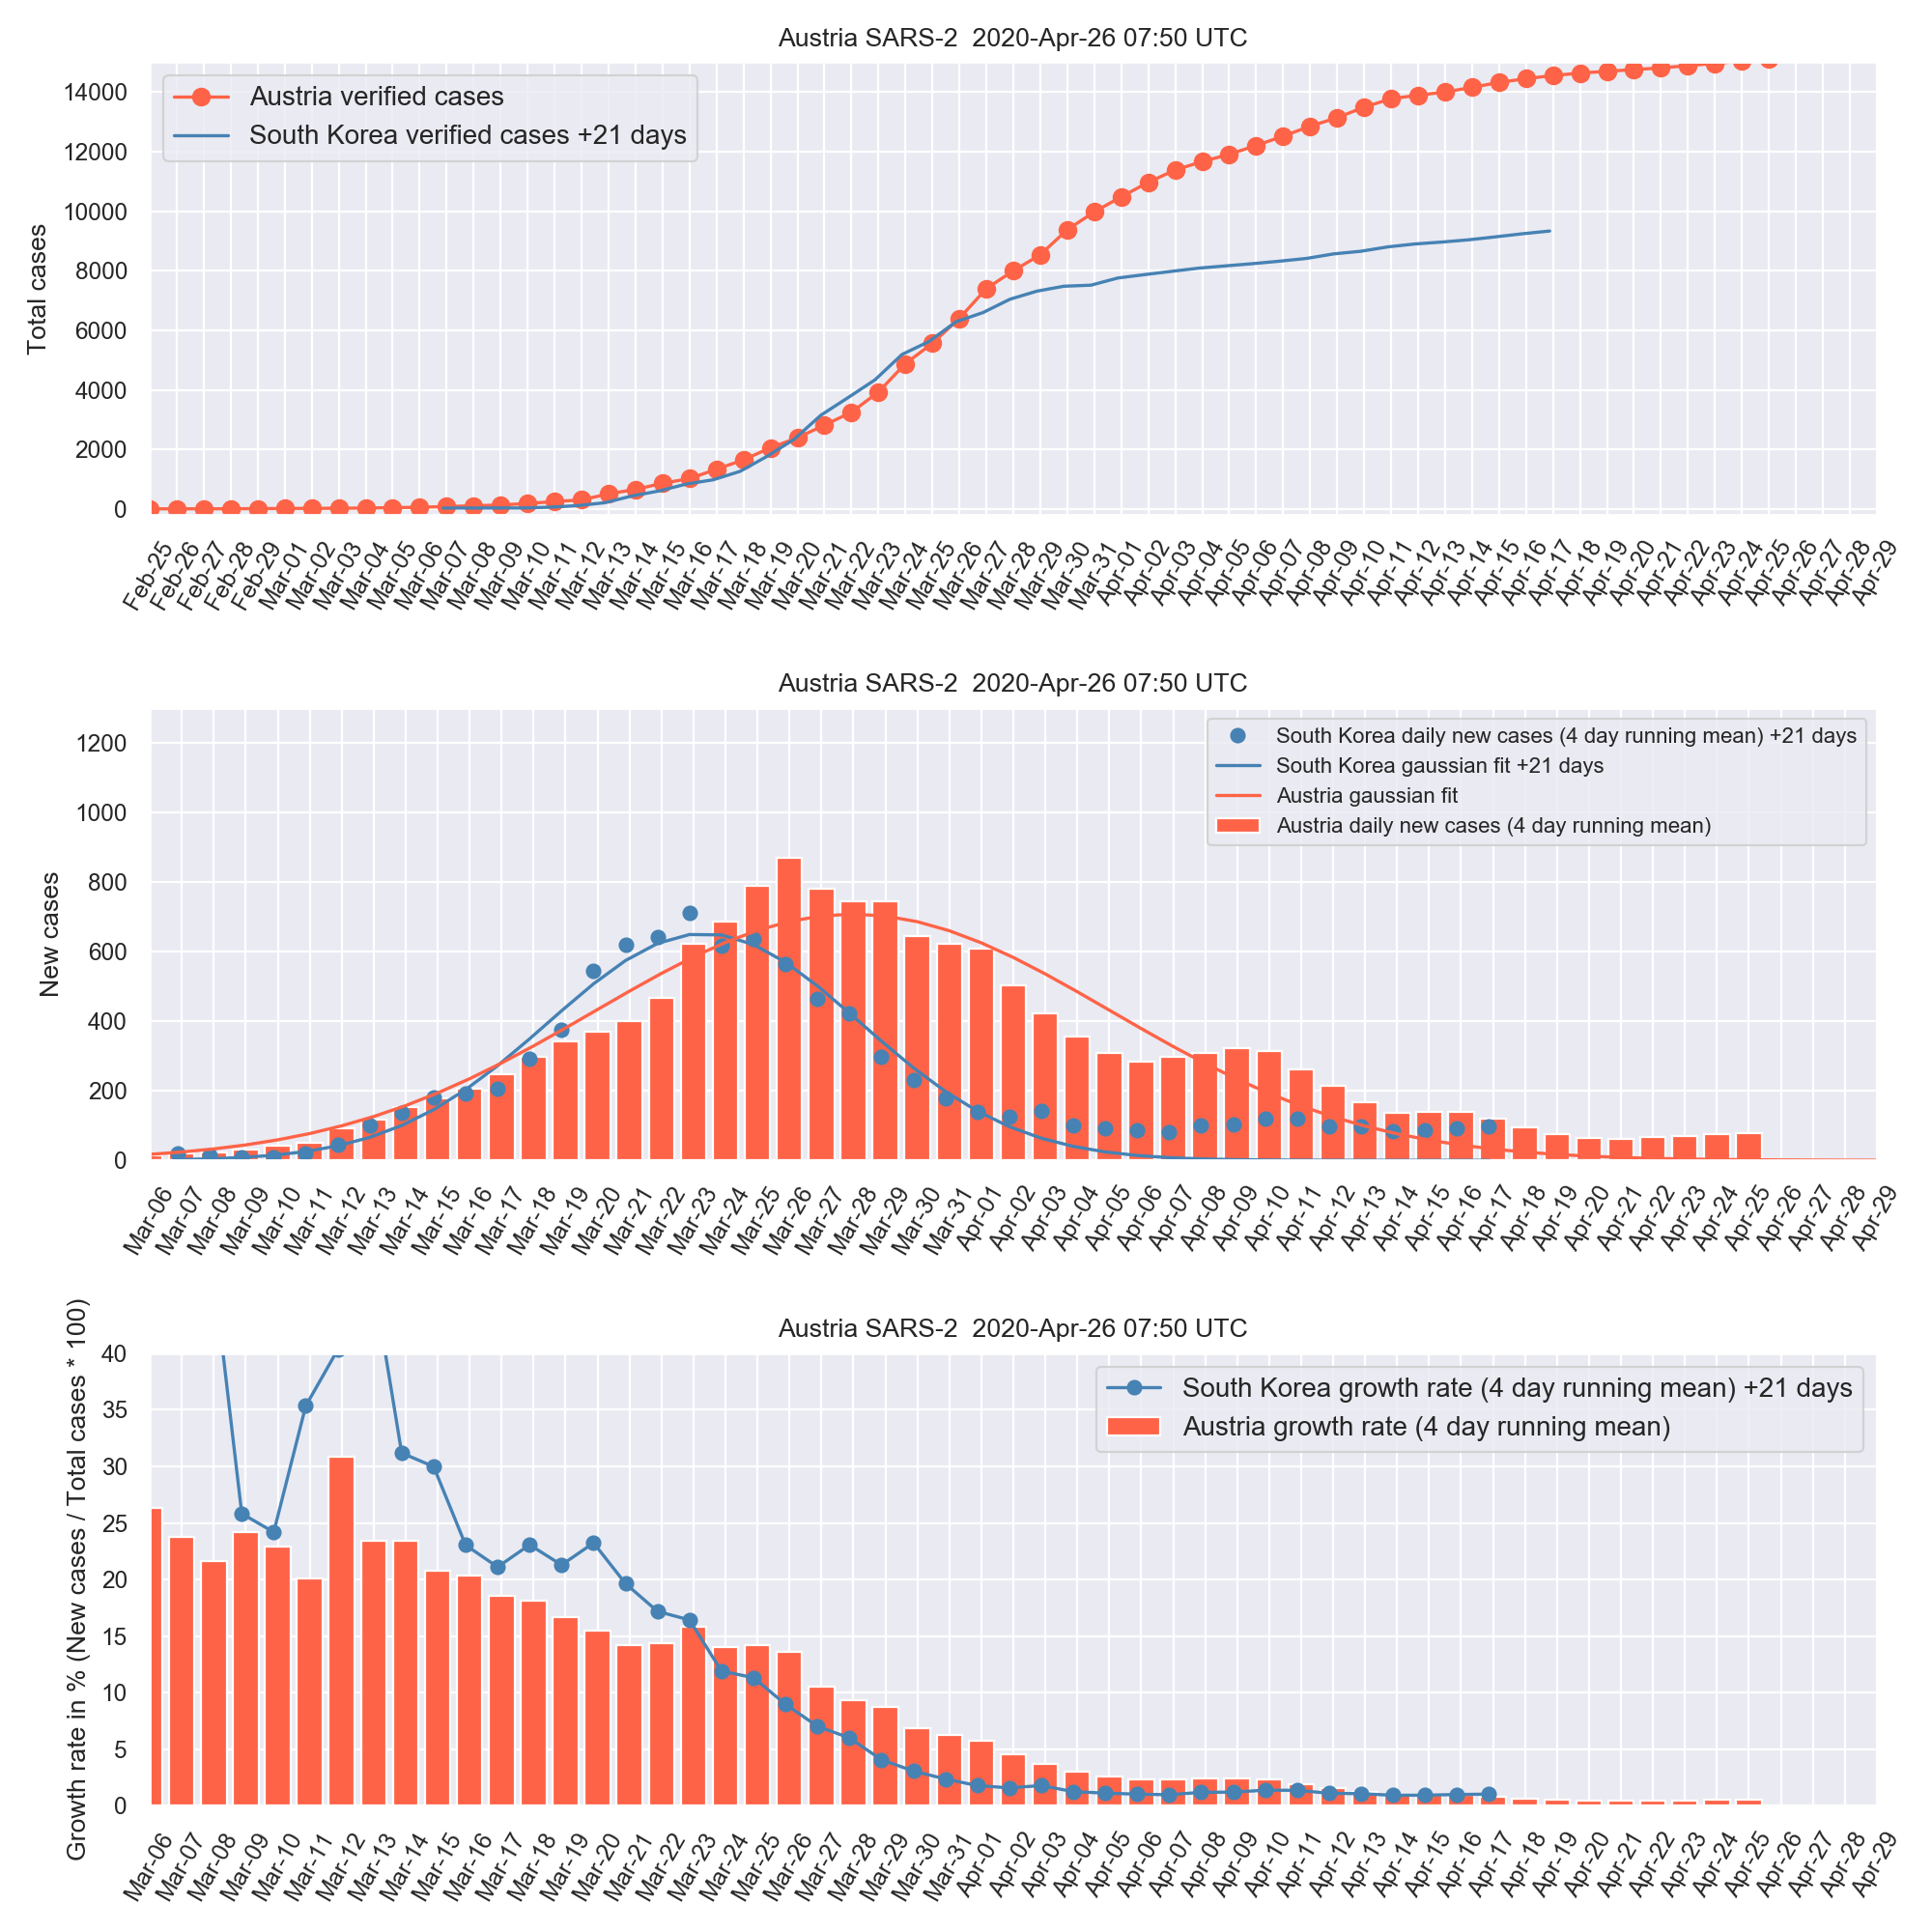
sars2_austria
Simple python data analysis for SARS2 in Austria or any other country with a jupyter notebook or script, in comparison to South Korea. This is not a prediction, but for monitoring data in comparison to exponential and gaussian fits and a country like South Korea which is a few weeks ahead in time compared to Europe.
C. Möstl, Graz, Austria https://twitter.com/chrisoutofspace
data source for Austria https://orf.at/corona/stories/3157533/
data source for South Korea https://www.worldometers.info/coronavirus/country/south-korea/
Usage
After installation below, go to the sars2_austria directory, run
conda activate small
to activate the environment, followed by either
python plot_cases.py
or open jupyter lab with
jupyter lab plot_cases.ipynb
and choose "run all cells" from the "Run" menu after jupyter lab opens in a browser.
Total case numbers, their start and end dates and the time shift to South Korea can be set in the file:
set_input_here.py
The times and case numbers for Austria are given as default. Please open this file in a text editor and adjust it for the data in your country.
The name of the plot file that is produced can be adjusted in set_input_here.py.
For converting the jupyter notebook to a script on the command line do:
jupyter nbconvert --to script plot_cases.ipynb
Installation
Install python 3.7.6 with miniconda:
on Linux:
  wget https://repo.anaconda.com/miniconda/Miniconda3-latest-Linux-x86_64.sh
  bash Miniconda3-latest-Linux-x86.sh
on MacOS:
  curl -O https://repo.anaconda.com/miniconda/Miniconda3-latest-MacOSX-x86_64.sh
  bash Miniconda3-latest-MacOSX-x86_64.sh
Create a conda environment (should take < 10 minutes):
conda env create -f environment.yml
go to a directory of your choice
git clone https://github.com/cmoestl/sars2_austria
