This simple project spins up and properly configures a single node Splunk Docker image and parses a provided debug.zip file containing CockroachDB log files. The intent of this project is to simplify troubleshooting of log files across a multi-node CockroachDB cluster. Since the timestamps included in the current version of CockroachDB log files are not parsed correctly by Splunk out of the box, a number of configurations have been modified to support the CockroachDB format. Those configurations can be found in the splunk > conf directory.
For example, a typical line in a CockroachDB log file looks like this...
I181220 15:30:03.971234 1 util/log/clog.go:1176 [config] running on machine: us-central1-node-0003
Where the first character is either I, W, E or F, signifying an INFO, WARN, ERROR or FATAL statement. Immediately following the log level is the custom timestamp, which is equivalent to %y:%m:%d %H:%M:%S.%6N in standard Unix strptime() parlance. The rest of the log statement is application specific.
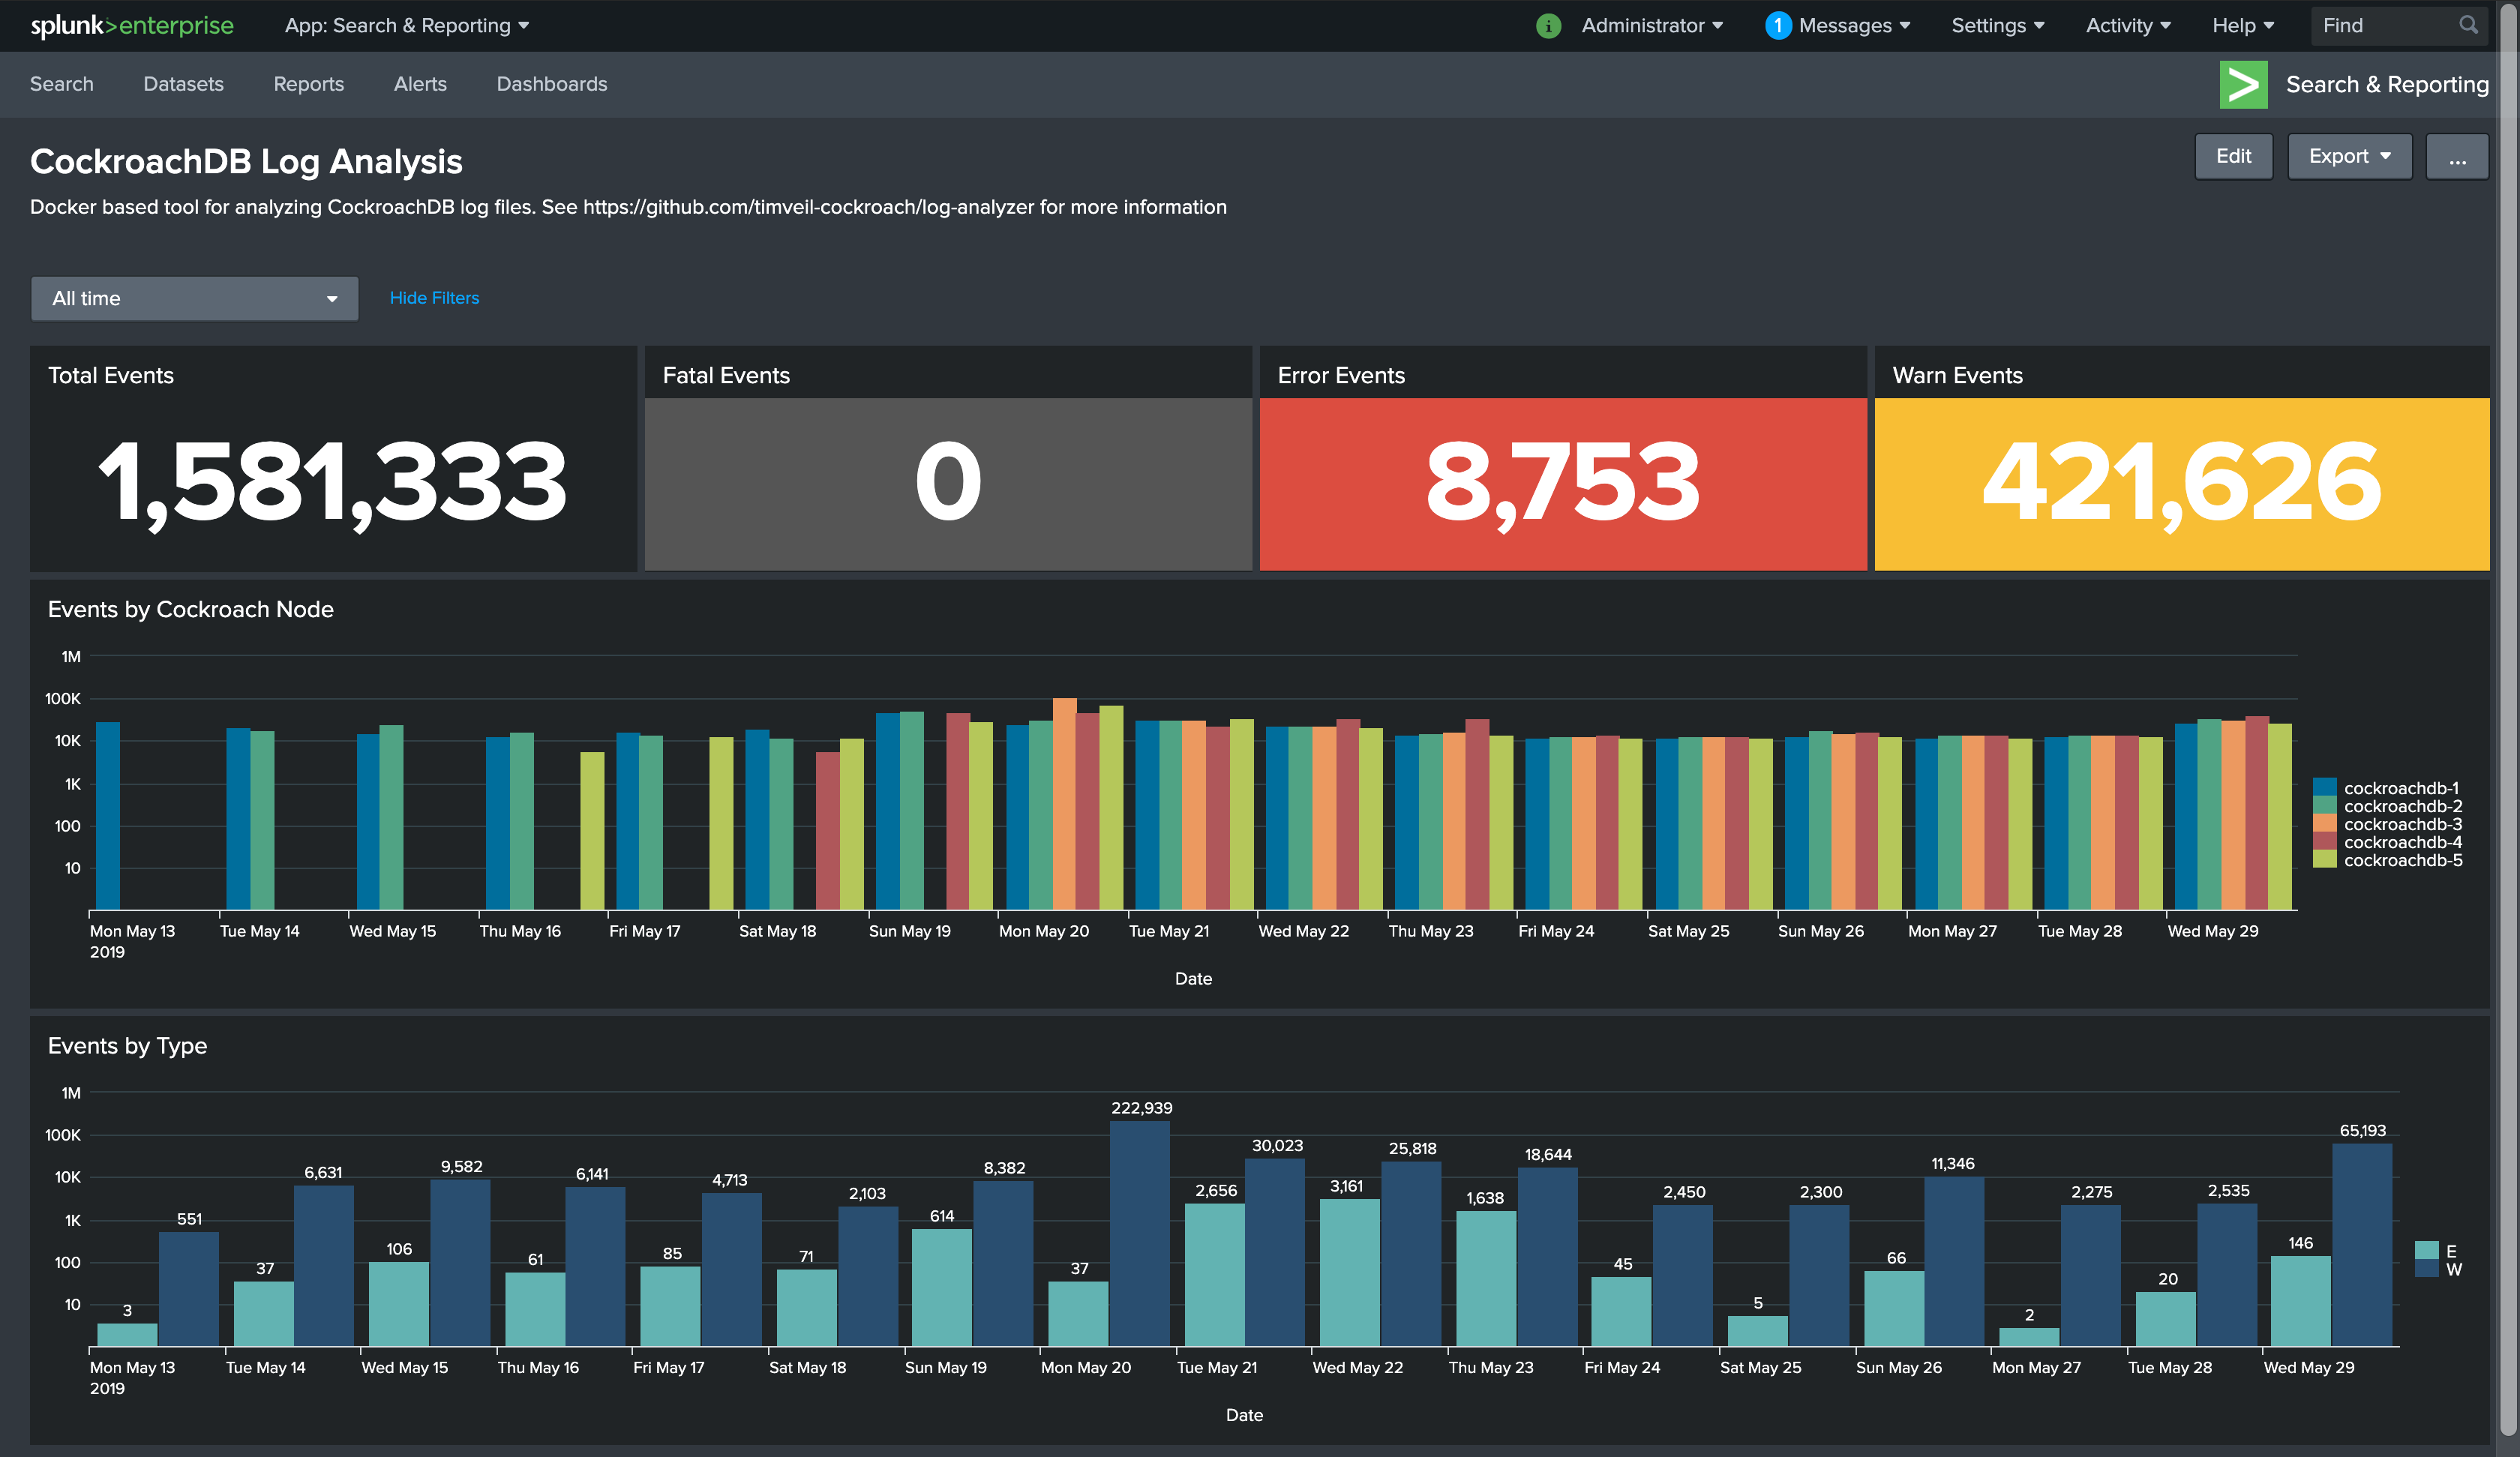
I created a quick dashboard (see below) to summarize the events found in the debug.zip. You can use this dashboard to drill into specific days or events of interest.
- Latest Docker edition that supports
docker-compose. I use the latest "Docker Desktop" for Mac for my testing. - A
debug.zipfile generated by CockroachDB version2.1.4or greater. See https://www.cockroachlabs.com/docs/stable/debug-zip.html
-
Clone the project locally.
-
Place a CockroachDB generated
debug.zipfile in the root the projectssplunkdirectory. -
Run
./run-start.shto bring up the Splunk instance and begin indexing your CockroachDBdebug.zipfile. -
To access the Splunk UI go to
http://localhost:8000. The username isadminand the password isroach1234as specified by theSPLUNK_PASSWORDenvironment variable in thedocker-compose.ymlfile. -
To stop and cleanup, run
./run-clean.sh. This will stop Splunk and executedocker system prune -a -f ....
- This is useful for analyzing a relatively small amount of data given this single node, Docker based approach. Adjustments could be made to scale this but are beyond the scope of my initial effort.
- The configurations used here, specifically those found in
inputs.confandprops.confcould be easily ported to a proper Splunk environment to enable real-time CockroachDB log parsing, etc.
Open interactive shell with splunk container
docker-compose exec splunk /bin/bashSearch for all E or error log messages sorted by _time (log entry timestamp) descending
sourcetype=cockroach_log cockroach_log_level=E | sort _time
Search all log messages sorted by _time (log entry timestamp) descending
sourcetype=cockroach_log | sort _time
