Objectives :
- Basics of A/B testing
- Experiments as a form of validation
- Hypothesis generation and measurement
Question: How many changes do you track in a single A/B Test ?
Answer : In A/B Tests we only change a single variable ( eg . Size of picture / Color of CTA button ) in the Base ( A ) , to create the Variant ( B ). And then , we keep an eye on the metrics to see if Variant produced the type of results we expected or not
Question : Why do we only change a single variable, why not change multiple things all at once and see how well that version with multiple changes did with respect to the Base ?
Answer : if we track the effect multiple changes had in an experiment, then the data is more ambiguous . So an A/B tests only have a single change between the Base and the Variant.
In this way we can be sure the variation in data was only because of tha SINGLE change
Eg : If we change the size of a [ Buy Now ] button , and if the sales went up by 25% , we can conclusively say that increasing the size of the button , in itself , had that effect on the sales
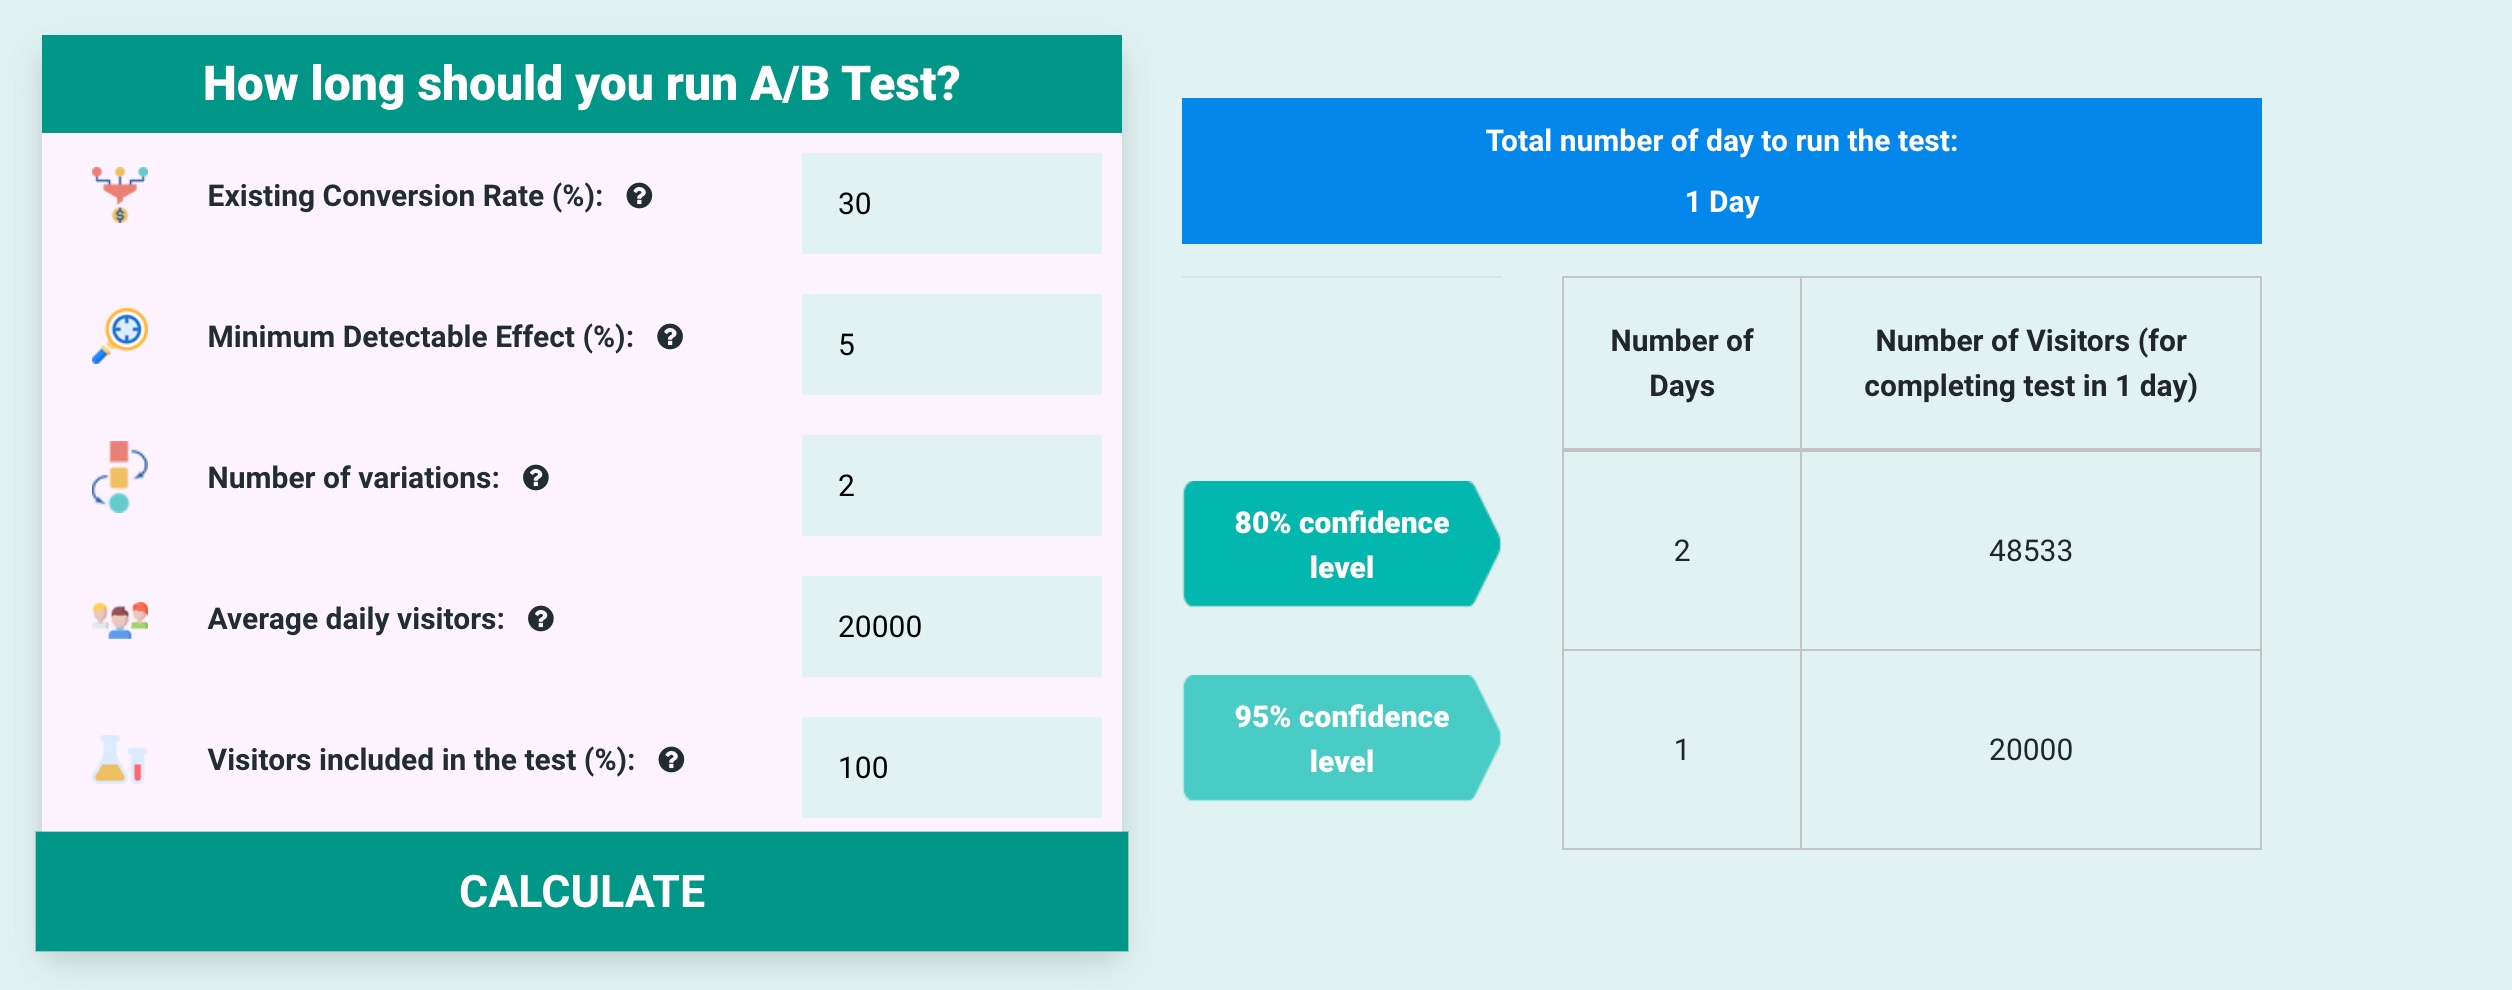
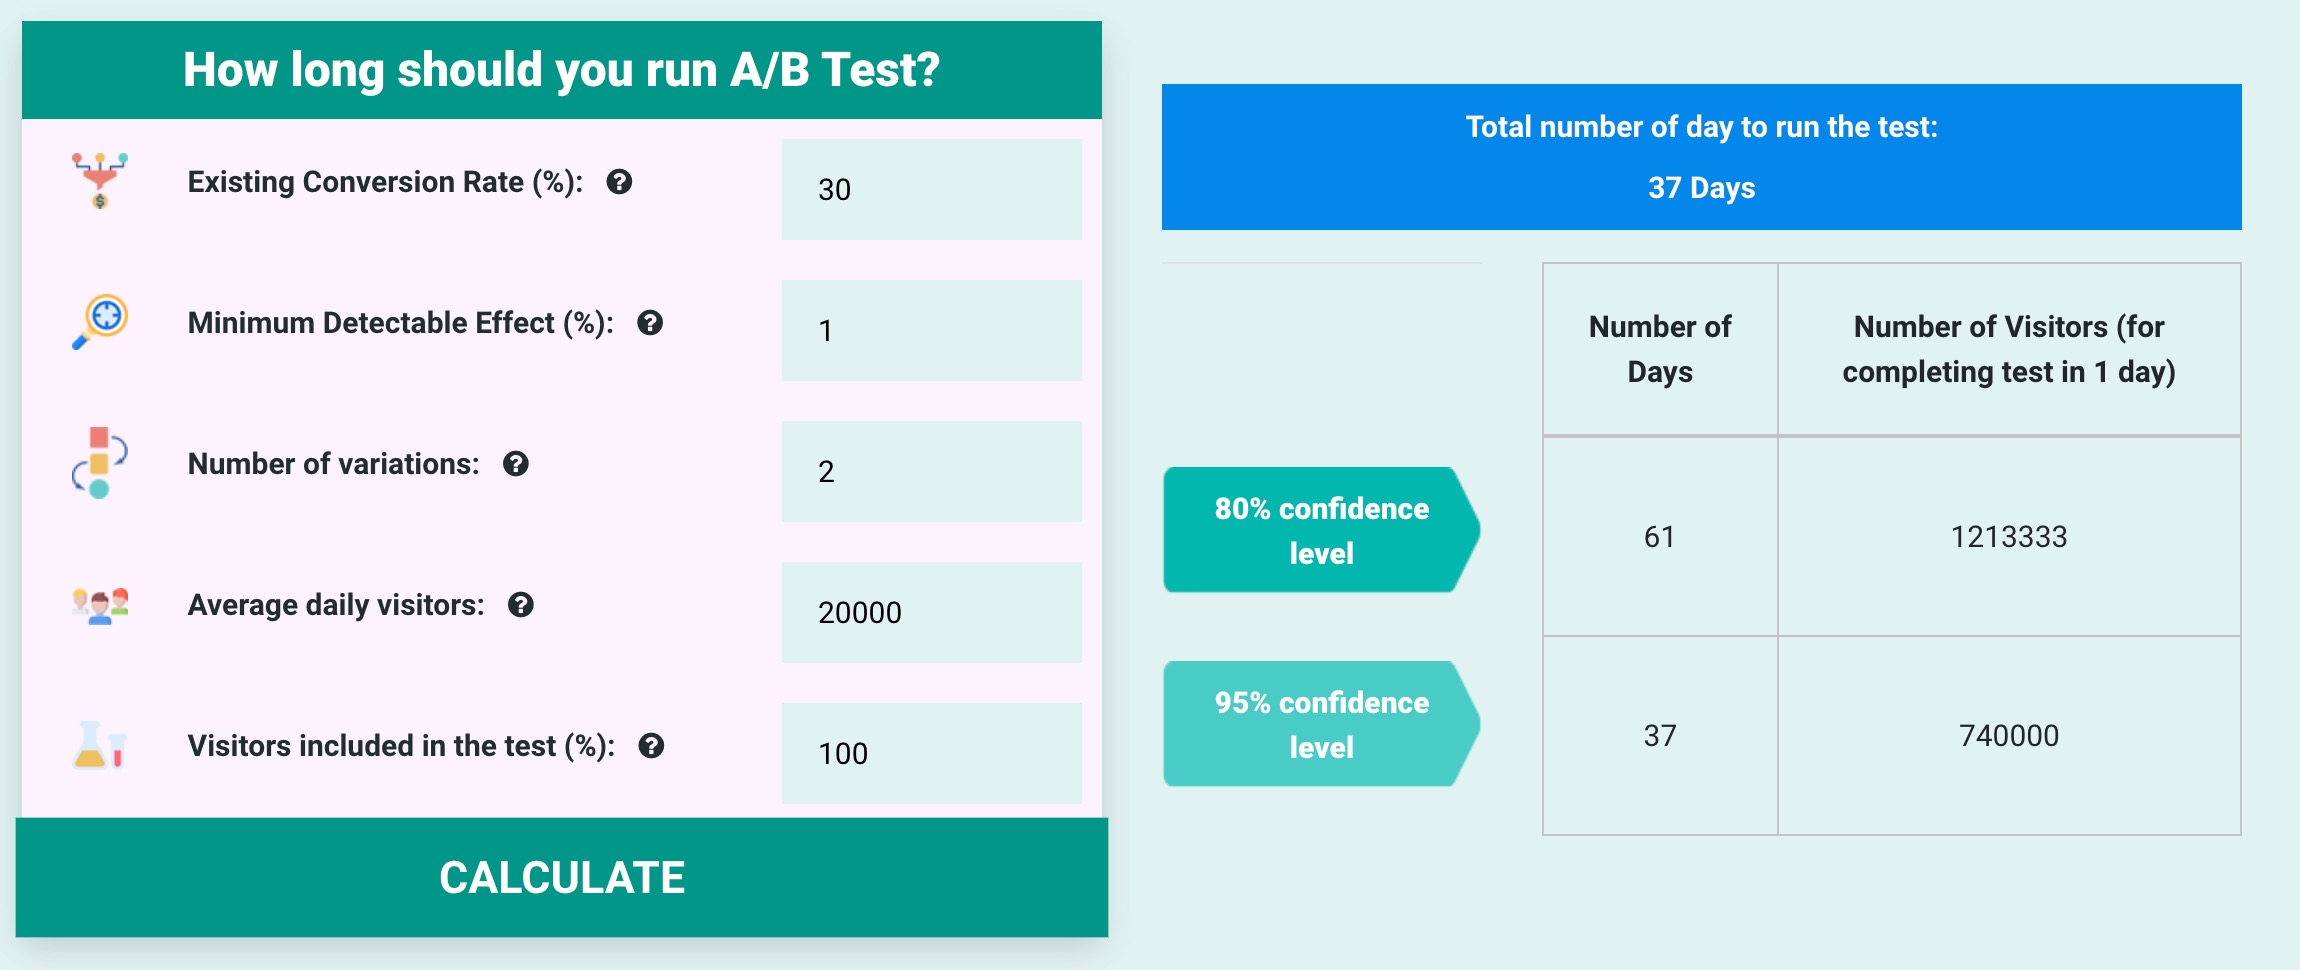
Question : How long should you run an A / B Test ?
Answer : Well, that answer depends on 2 factors
- How much traffic do you need to measure it effectively.
- What is the minimum change that you want to detect ? .
Generally, the more GRANULAR the change you want to detect, the LONGER you need.
Eg : If you want to detect a 1% increase in sales , you need to run the experiment over 30 days.
V.S
If you want a 5% increase detected , then you just need to run it 1 or 2 days .
( Generally it's a good practice the run an A/B experiment for a period of 2 weeks )
There are 4 metrics which are used to evaluate the results of an experiment you conduct w.r.t your product
-
Primary Metric ( Generally the North Star Metric ) :
- Eg. No. of Likes / No. of Subscribers / Sales
- If the change in this metric is STATISTICALLY SIGNIFICANT , then you can conclusively say whether the impact of the change was Positive or Negative .
-
Supporting Metric :
- There can be only 1 primary metric, but there can be multiple supporting metrics .
- These are metrics , that hint towards the experiment going in the right/wrong direction
- Eg. If you take Amazon , and if while conduction an experiment you find there there is a decrease in the number of returns / cancellations and lesser number of customer support calls etc. , then this points towards your primary metric being met , in the near future.
-
Health Metric :
- This is generally a measure of how the application ( website ) is performing because of the experiment.
- Eg : Are there more errors on the backend ? Has the page load time increased ? etc ...
-
Binomial Goals :
- These are metrics that are tracked when any experiment is being performed , and are not specific to any experiment
- These are metrics that can hint , or provide info about any other parameters being effected because of an experiment.
- They are generally YES / NO tests .
- Eg. Has the bounce rate of the page increased after the start of the experiment ( Yes / No )
When multiple experiments are running at the same time , does one experiment not affect the results of another test which is running in parallel ?
Well , not really if a lot of traffic is involved in the evaluation . For example , if for a button , we run an experiment in which we change it's color to yellow and in another experiment running in parallel , we change the text to nunito , we will see , that on an average , what effect an individual experiment had on the metrics. And this is because , a segment of the traffic would have seen just that 1 experiment change.
How do you make sure that a new feature released does not lower the quality of the software ?
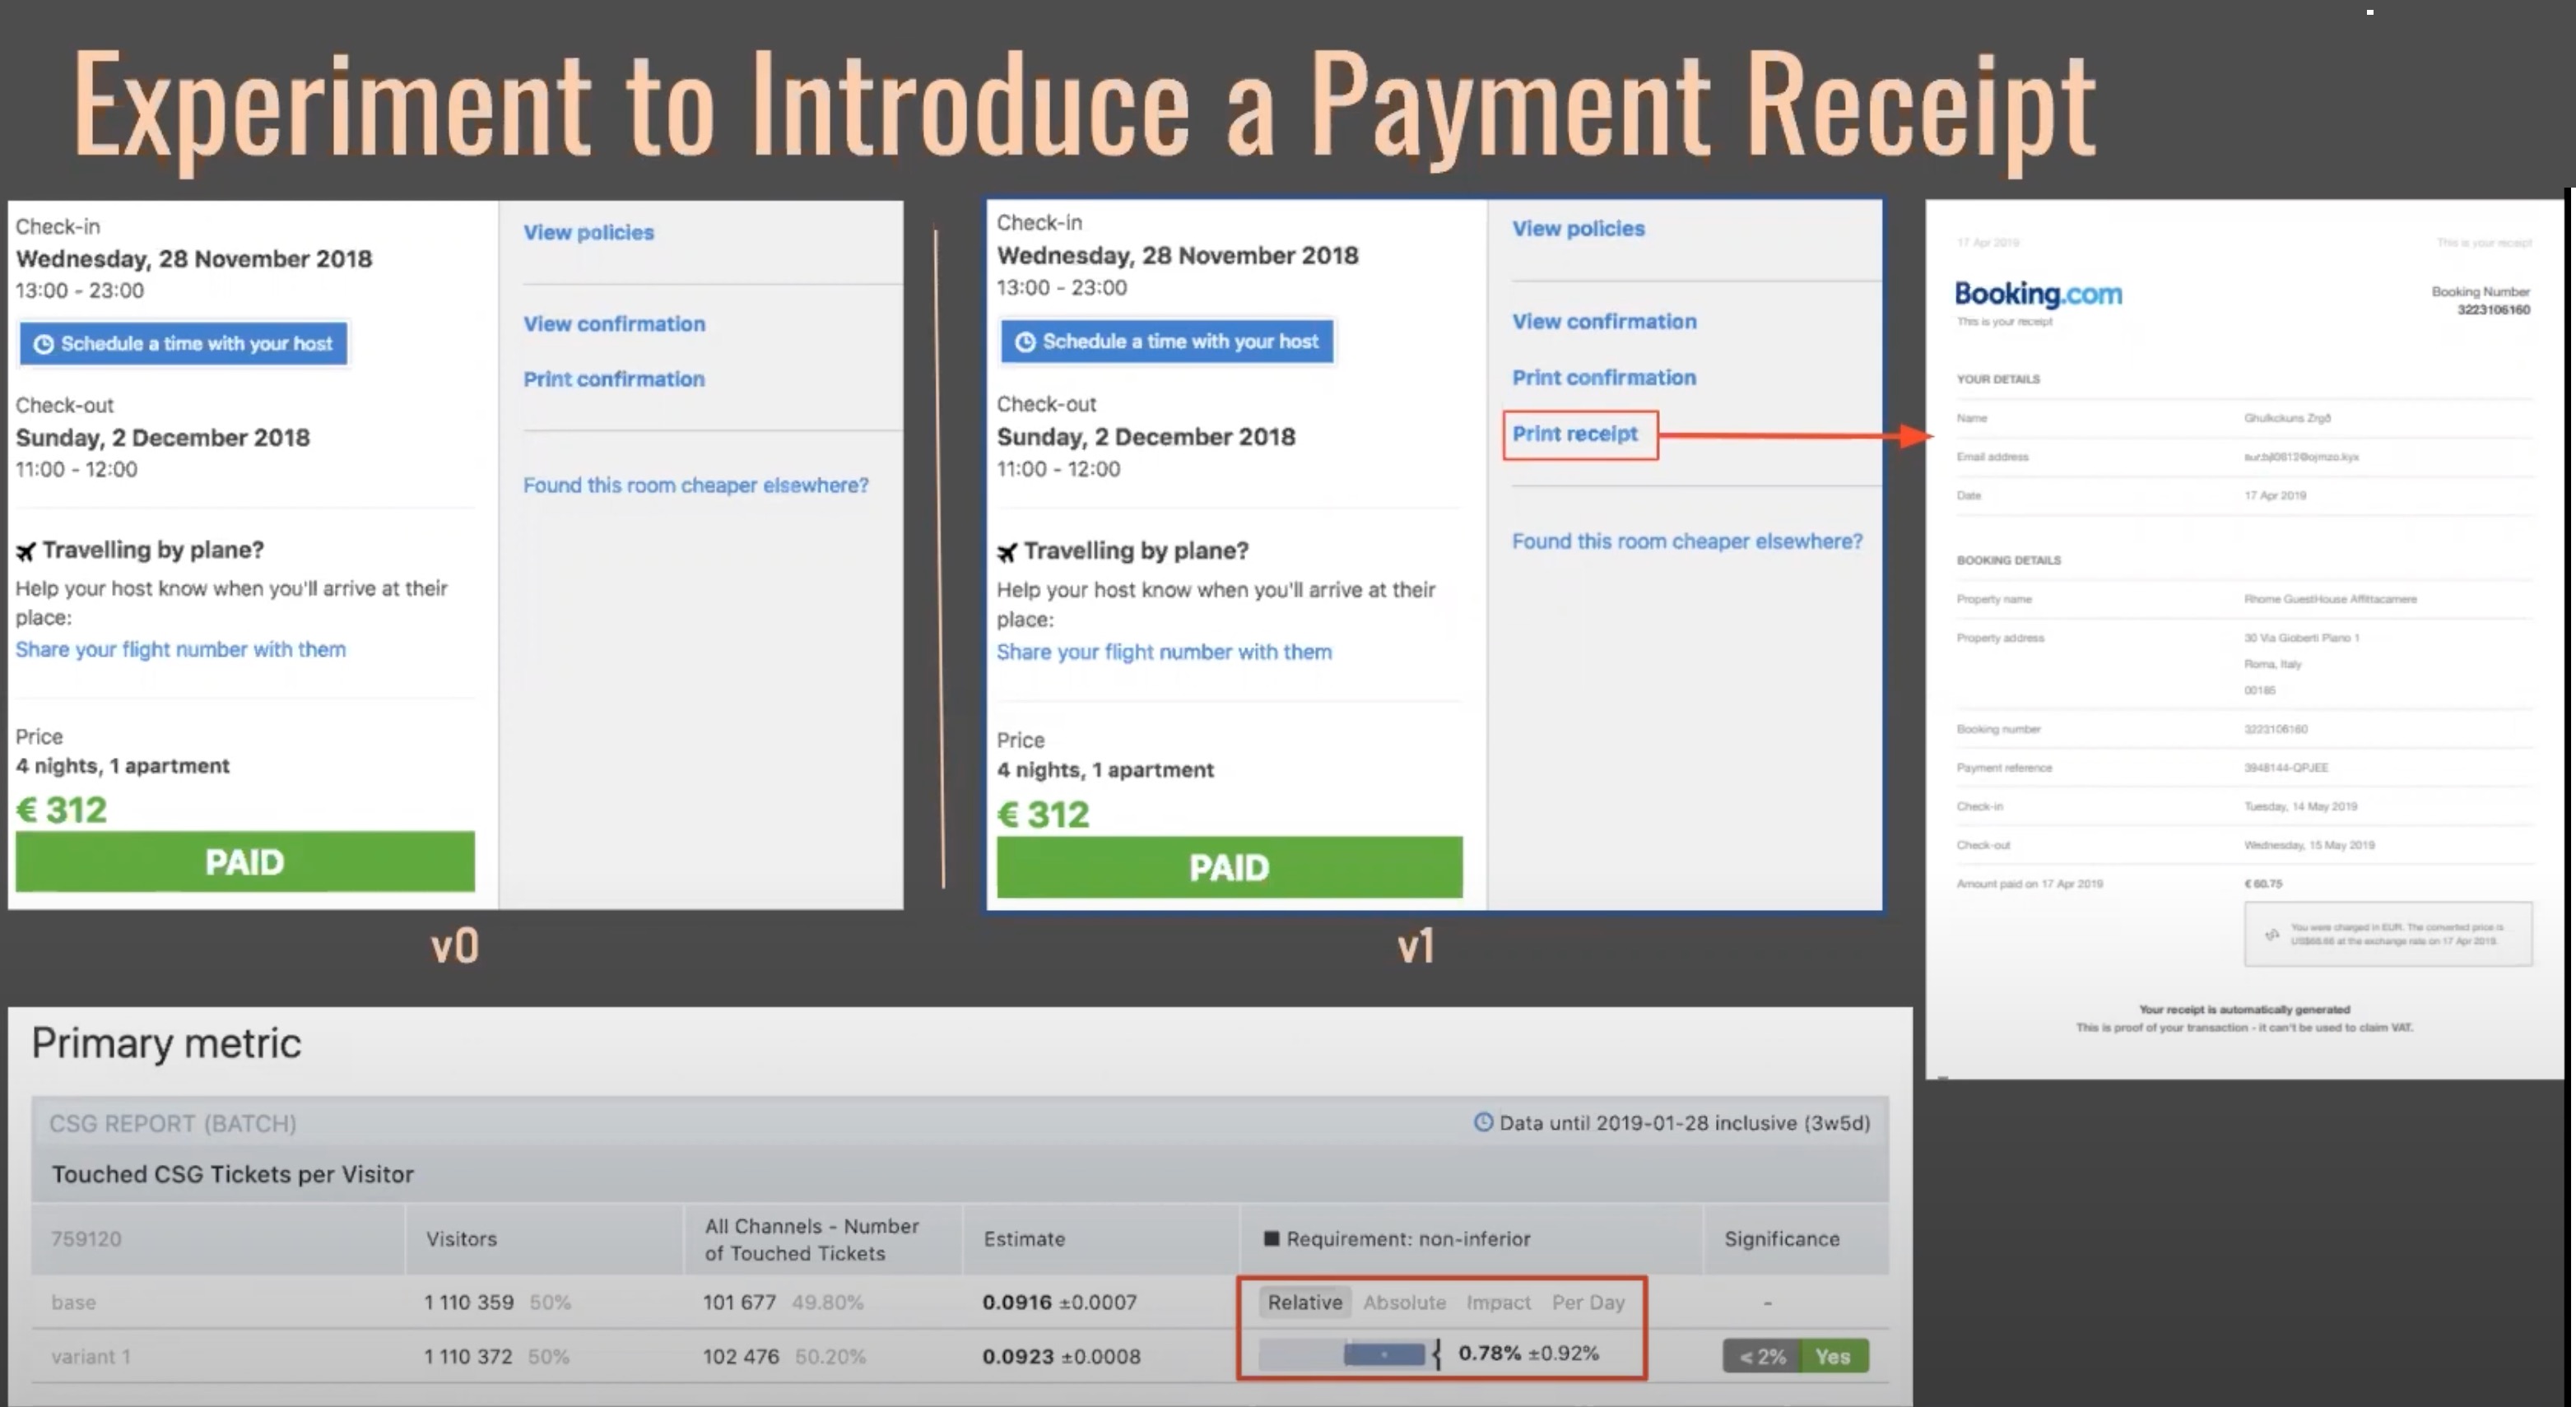
When you do Feature RollOuts with Non-Inferiority tests , you keep an eye on how the feature you introduced affected your existing product experience.
Eg : If we decide that we expect the customer tickets to increase less than 2% after a specific feature rollout ... and we observe that the rise in customer tickets is below that percentage , we can then rest assured that the new feature introduced did not cause our product to be inferior to the existing version .
In this experiment , when we introduce a new feature (printable receipt ) we made sure that the non - inferiority test confirmed that the percentage remained below our expected percentage (2 % in this case )
Question : What can be achieved my hypothesizing , and thereby running experiments to verify a hypothesis w.r.t Business Success ?
If the hypothesis is based on a belief that making a specific change will financially benefit the company , then it's worth running experiments to validate the hypothesis, and thereby increasing the revenue of the company.
Question : What is the template to formulate a
good hypothesis??
Answer : Based on [evidence] , we believe that if we change [proposed_change] for [customer_segment] ,it will [impact_hypothesised]. This would be good for our business because an increase in [primary_metric] is an increase in [business_kpi]
Eg: Based on [ the increase in user signup, using oauth on various platforms] , we believe that if we change [ the signup process to an OAuth only signup process using GitHub login] for [ Developers ] , it will [ lead an increase in the number of signups ]. This would be good for our business , because an increase in [ user signups ] is an increase in [ website sales ] .
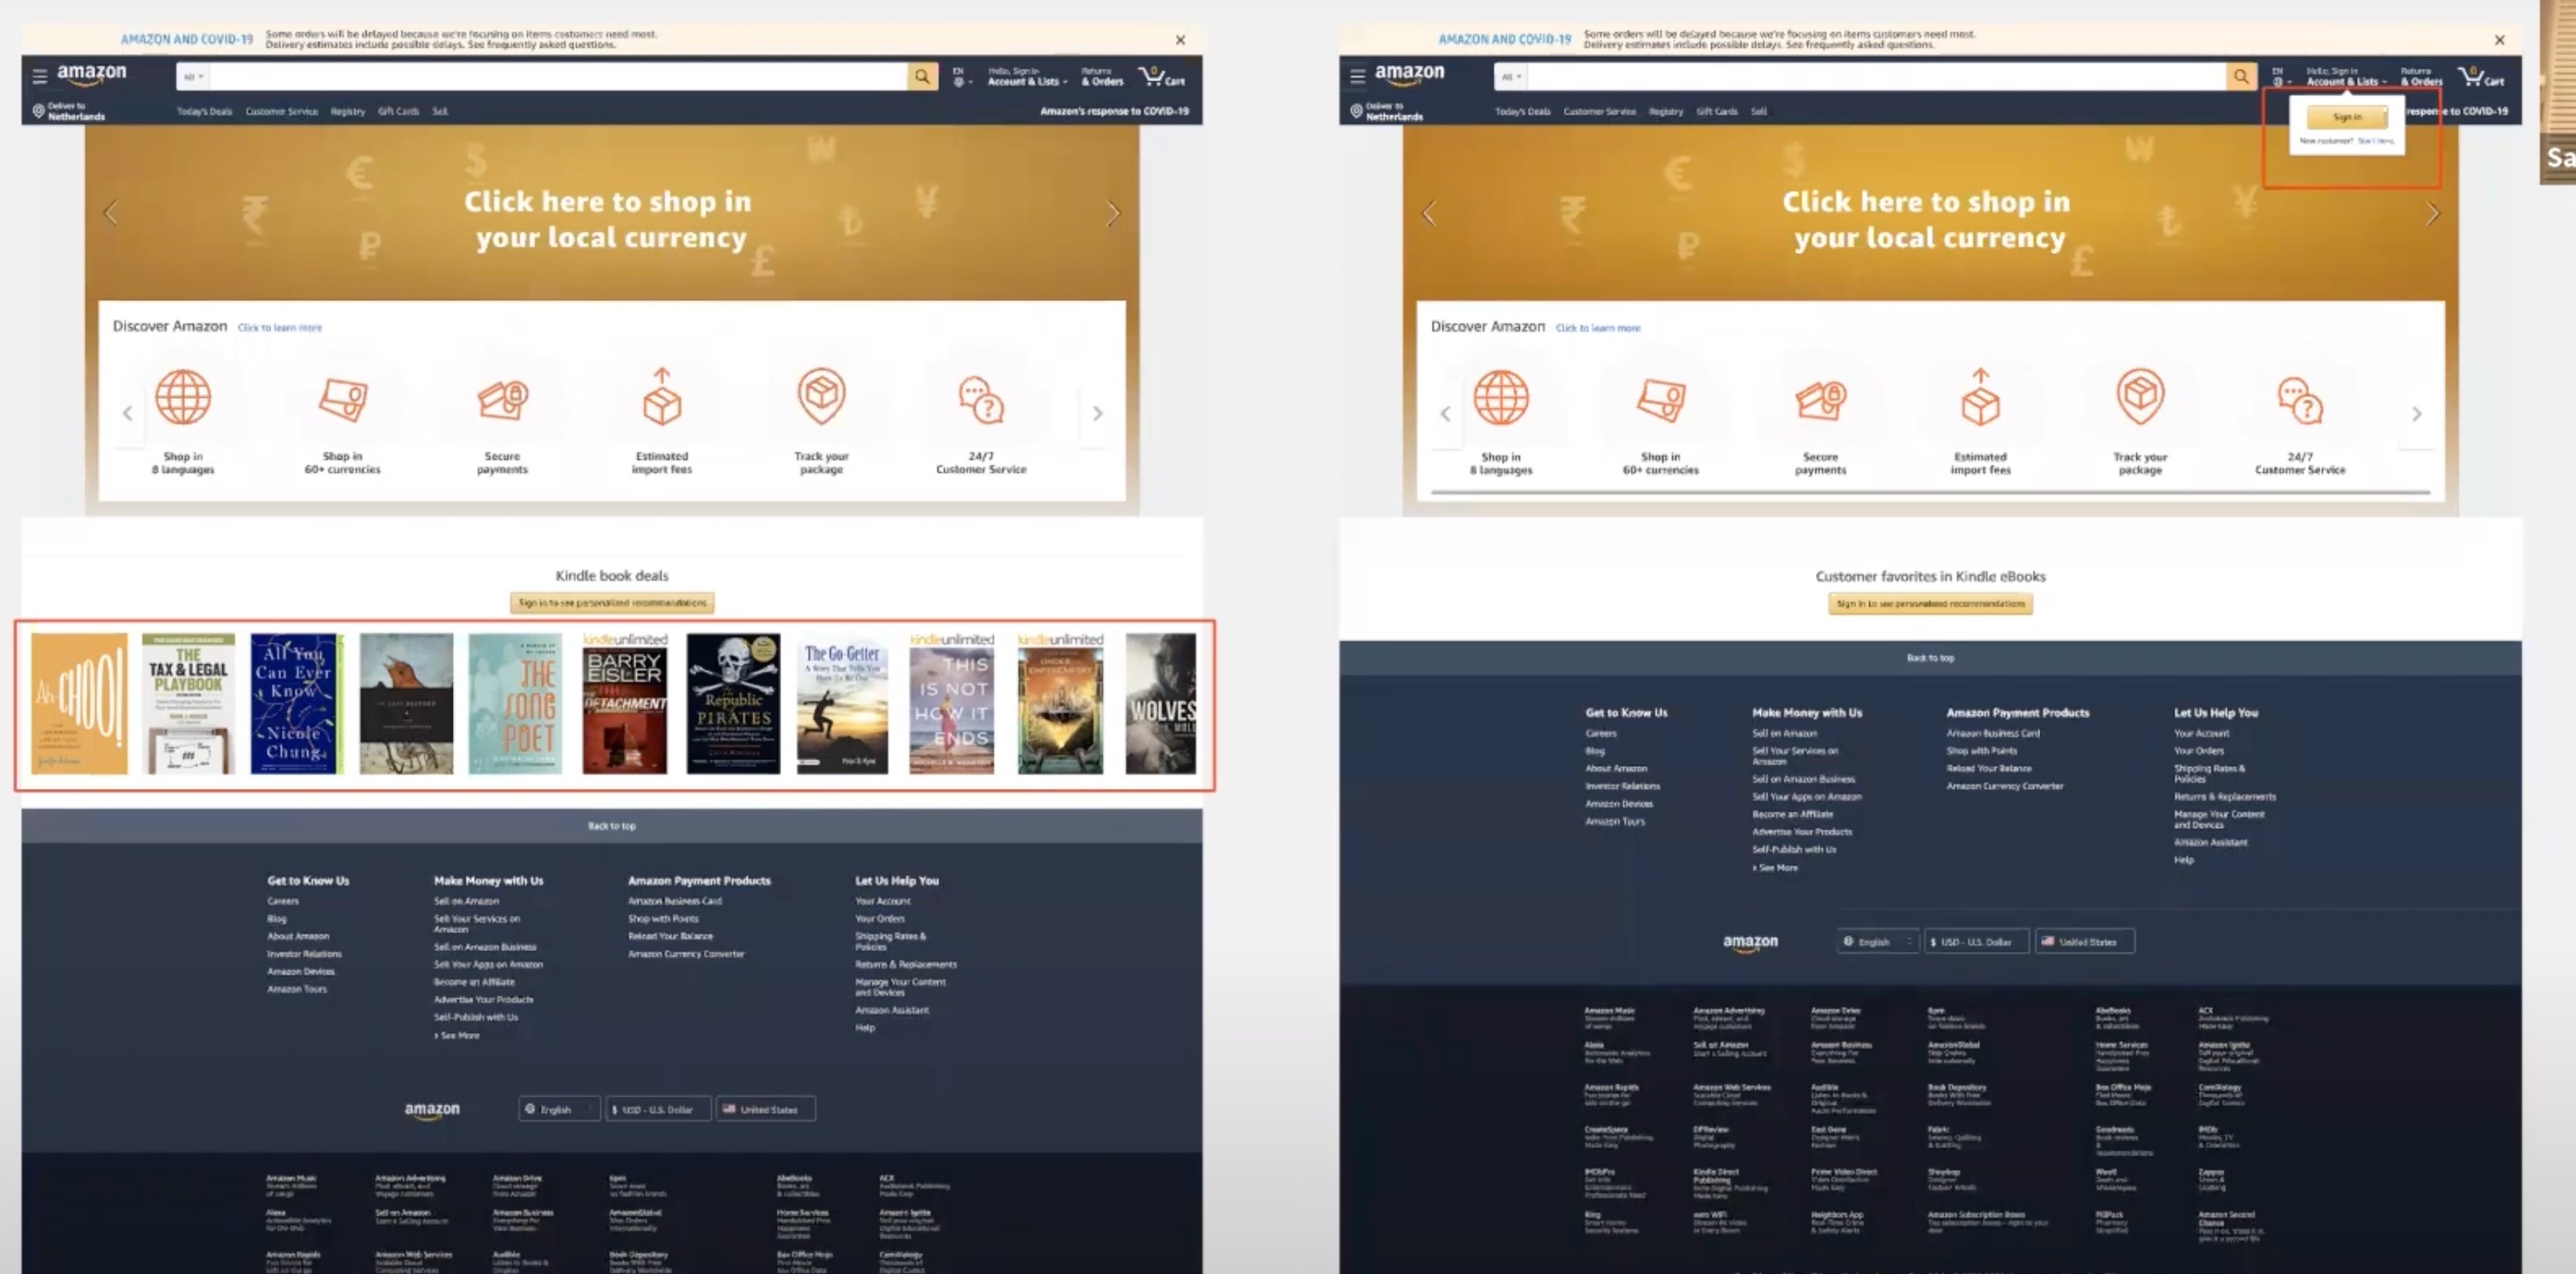
In this , the Left hand side has the variant , and the right hand side has the base .
We can predict that the hypothesis is that amazon predicts that showing the e-book collection at the signin page could increase the sales of that product over time , and for that they might be running an experiment .
We also see a signup button on the top of the right hand side page , which might also be an experiment to see if more users signup with they are shown a sign up prompt , and contrasting that with a base case where no prompt shows up .
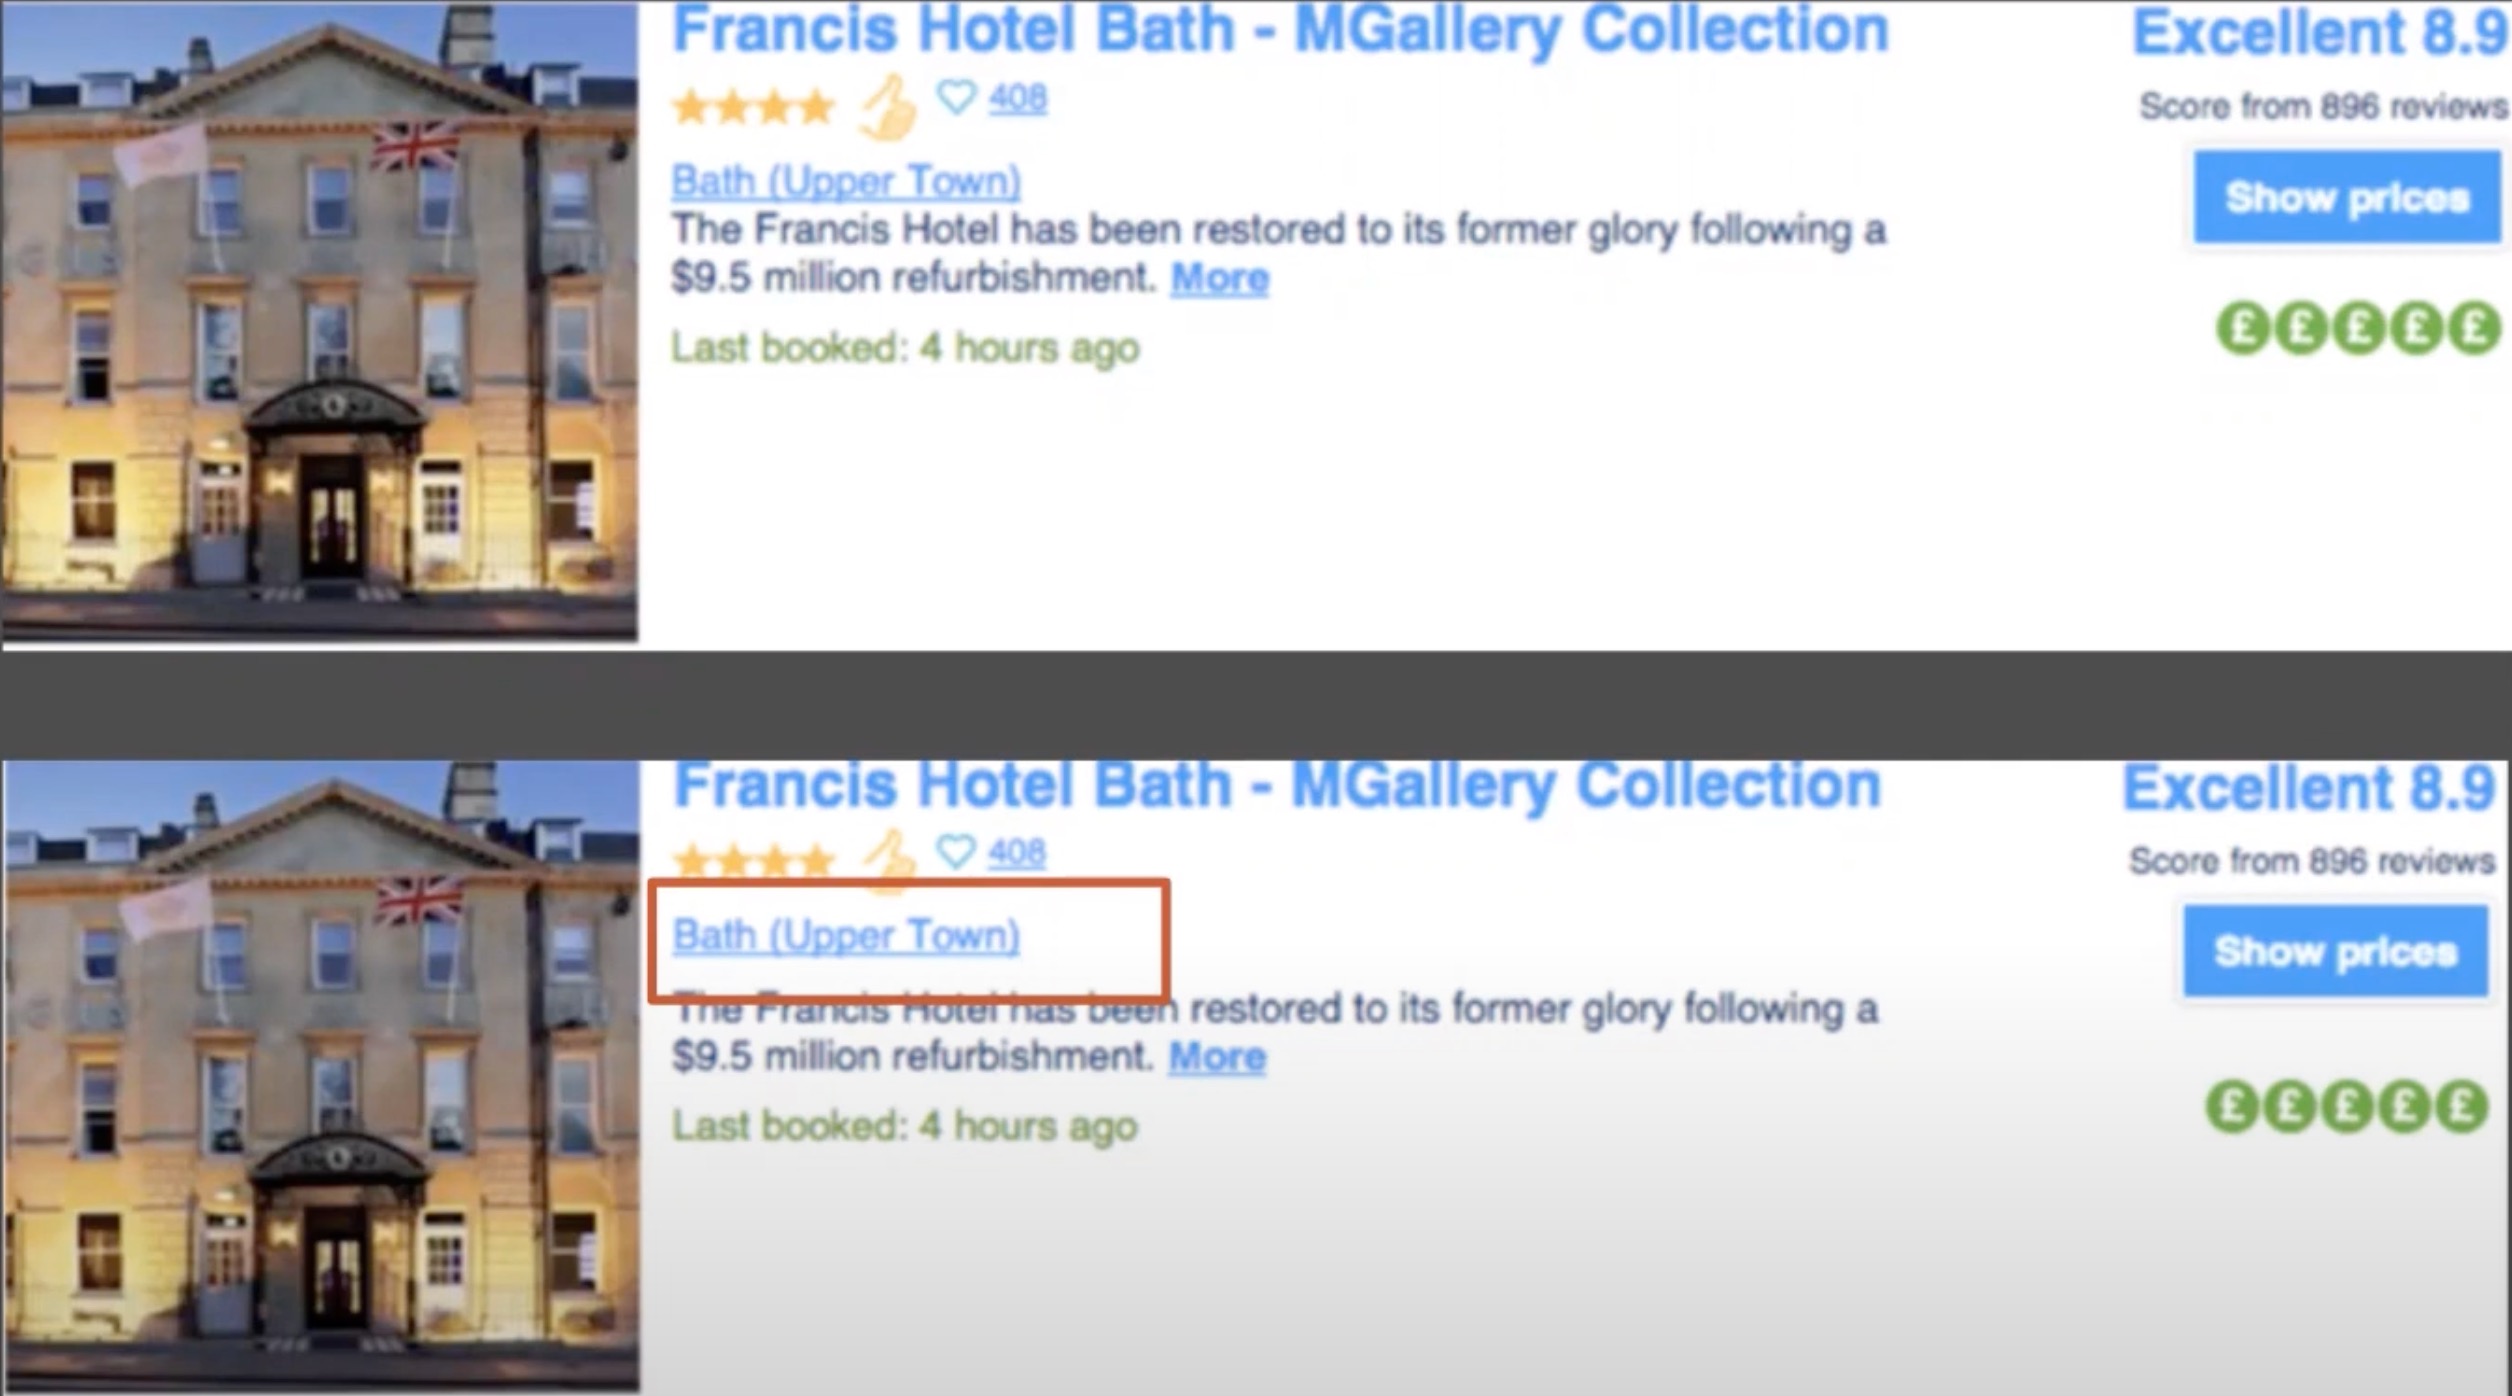
The hypothesis was that the spacing between the name of the hotel and the description might increase the sales , which it did over time ... A statistically significant jump from the previous sales .
- Cookies
- Account Type
- Email-Address
- Device I.D
