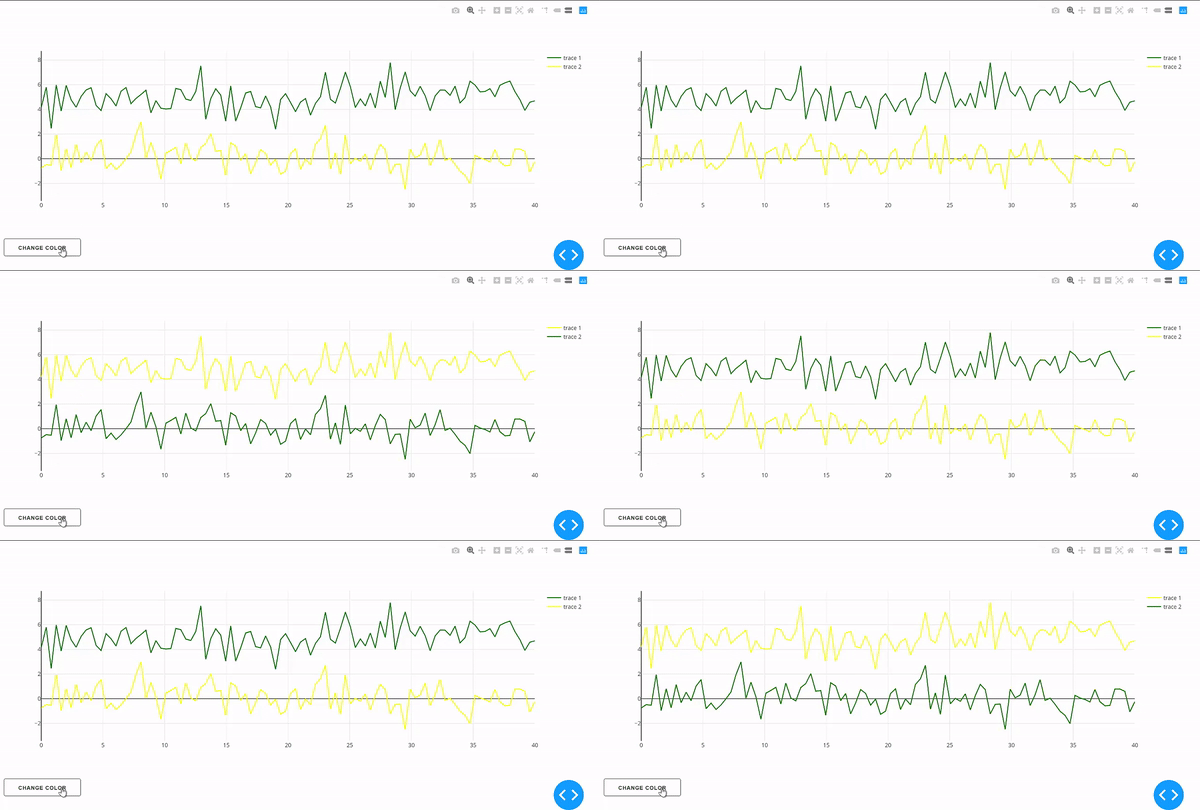
This is a library to update multiples traces in a dcc.Graph using dash plotly in python. This code is based from the "mydcc.Change_trace", repo: https://github.com/jimmybow/mydcc. The idea is to update a trace or a list of traces in a callback without the need of re-draw the figure (you don't need a layout property).
Multiple callbacks with the same output: This custom component allow you to update the data in the same graph using multiple callbacks (you can't have the same output in two callbacks with dash).
1. installing:
```
$ pip install dash_update_data_components
```
- dash -- The core dash backend
- dash-renderer -- The dash front-end
- dash-html-components -- HTML components
- dash-core-components -- Supercharged components
- plotly -- Plotly graphing library used in examples
Update data in a dcc.Graph. Return a list of dictionaries:
@app.callback(...)
def func():
    return [dict(x = data1,y = data1),dict(x = data2,y = data2),...]
Code:
import dash_update_data_components

app.layout = html.Div([
    html.Div(children=[
        dcc.Graph(
              id='mainGraph',
              figure={
                  'data': data,
                  'layout': layout
        )
    ]),

    dash_update_data_components.EditableGraph(id = 'ii', aim = 'mainGraph'),
])

@app.callback(dash.dependencies.Output(component_id='ii', component_property='data'),
             [dash.dependencies.Input(component_id='mainGraph', component_property='figure')])
def update_graph(fig):
    if fig is not None:
        data = dict(x = fig['data'][0]['x']+20,
                    y = fig['data'][0]['y']-20,
                    opacity = 1
                    )

        return [data]
    else:
        raise PreventUpdate

if __name__ == '__main__':
    app.run_server(debug=True)
Update data in a dcc.Graph from multiple callbacks with the same output.
import dash_update_data_components

app.layout = html.Div([
    html.Div(children=[
        dcc.Graph(
              id='mainGraph',
              figure={
                  'data': data,
                  'layout': layout
        )
    ]),

    dash_update_data_components.EditableGraph(id = 'ed1', aim = 'mainGraph'),
    dash_update_data_components.EditableGraph(id = 'ed2', aim = 'mainGraph'),
    dash_update_data_components.EditableGraph(id = 'ed3', aim = 'mainGraph')
])

@app.callback(dash.dependencies.Output(component_id='ed1', component_property='data'),
             [dash.dependencies.Input(component_id='mainGraph', component_property='figure')])
def update_graph(fig):
    if fig is not None:
        data = dict(x = fig['data'][0]['x']+20,
                    y = fig['data'][0]['y']-20,
                    opacity = 1
                    )

        return [data]
    else:
        raise PreventUpdate

@app.callback(dash.dependencies.Output(component_id='ed2', component_property='data'),
             [dash.dependencies.Input(component_id='mainGraph', component_property='figure')])
def update_graph(fig):
    if fig is not None:
        data = dict(x = fig['data'][0]['x']+10,
                    y = fig['data'][0]['y']-10,
                    opacity = 2
                    )

        return [data]
    else:
        raise PreventUpdate


@app.callback(dash.dependencies.Output(component_id='ed3', component_property='data'),
             [dash.dependencies.Input(component_id='mainGraph', component_property='figure')])
def update_graph(fig):
    if fig is not None:
        data = dict(x = fig['data'][0]['x']+5,
                    y = fig['data'][0]['y']-5,
                    opacity = 3
                    )

        return [data]
    else:
        raise PreventUpdate

if __name__ == '__main__':
    app.run_server(debug=True)
This is an example code to alternate the colour in two traces by pressing a button in dash.
1. Run the usage.py sample dash app:
$ python usage.py
