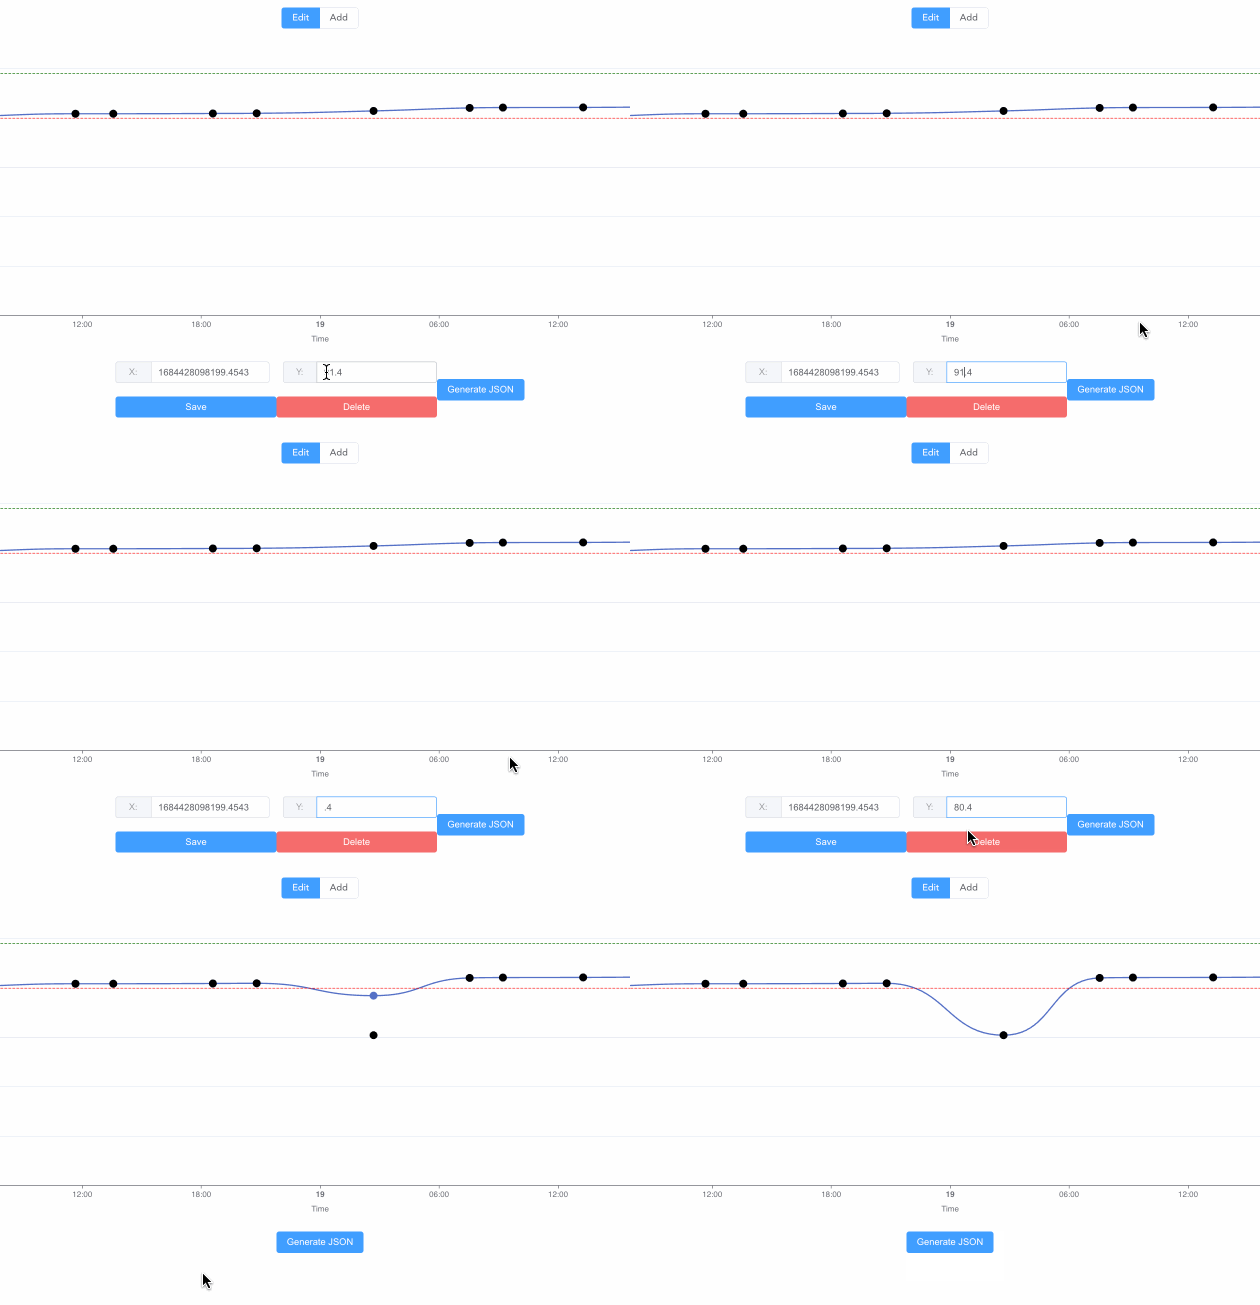
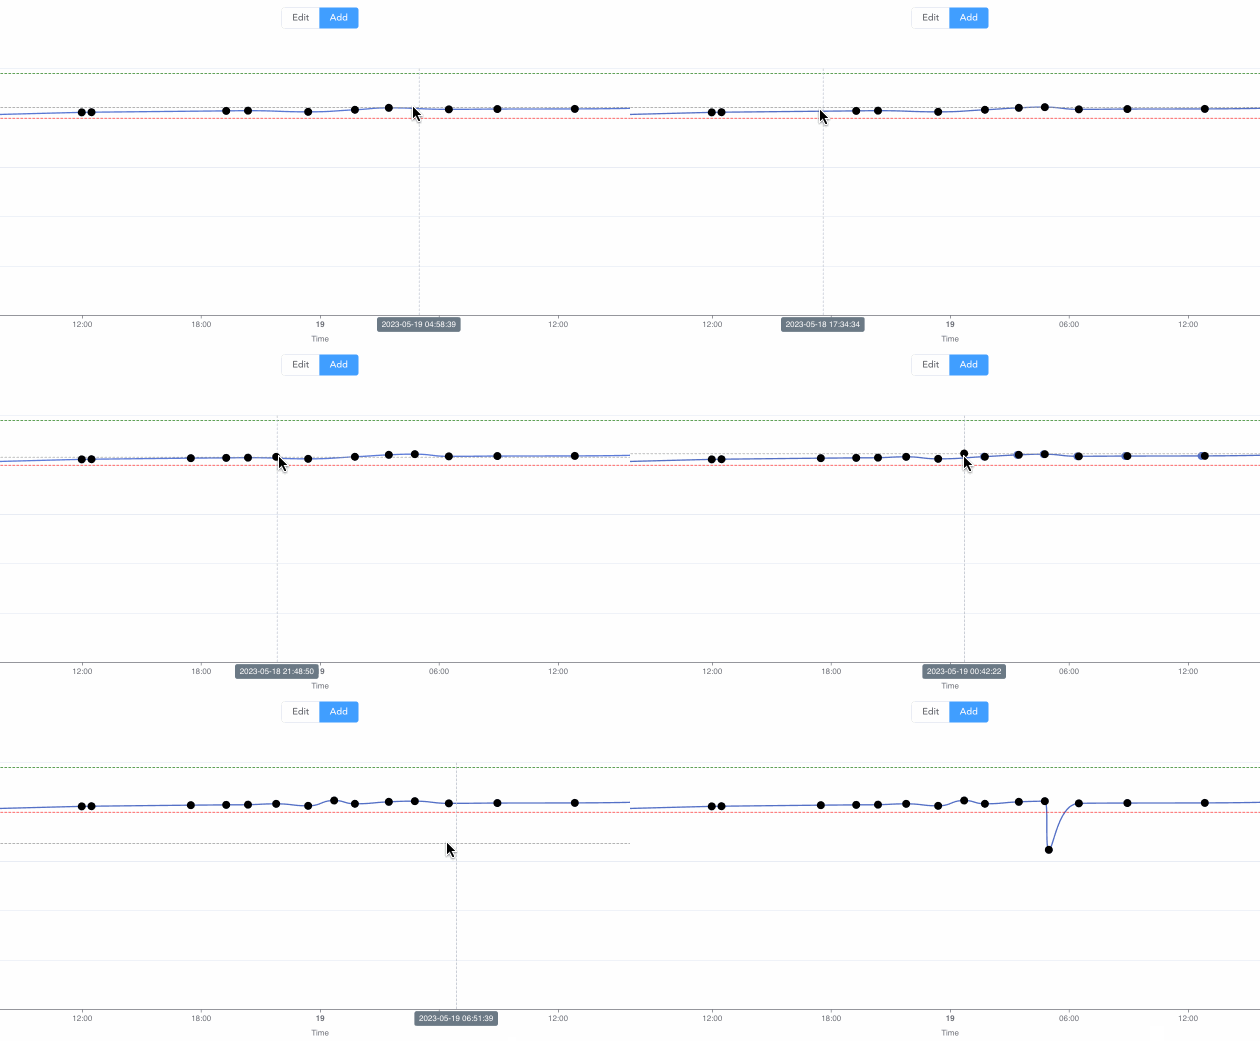
This project is a draggable chart sample built with Vue.js 3 and ECharts. It provides a user-friendly interface for creating and editing charts interactively.
-
Drag Data Points: Easily modify your data by dragging points on the chart.

-
Double-click to Edit Data: Double-click on any data point to open a dialog box for precise data input.

-
Click to Add Data Points: Add new data points to your chart with a single click.

-
Random Data Generation: Generate random data points following specific trends and ranges.
To get started with the Draggable Chart Editor, you can clone this repository to your local machine:
git clone git@github.com:codesssss/DraggableChart.git
Then, install the necessary dependencies:
npm install
Finally, you can run the project with:
npm run serve
This project is licensed under the MIT License - see the LICENSE file for details.