Memory management is complex, even in a managed framework like .NET. Analyzing and understanding memory issues can be challenging.
Recently a user reported an issue in the ASP.NET Core GitHub Home repository stating that The Garbage Collector (GC) was "not collecting the garbage", which would make it quite useless. The symptoms, as described by the original creator, were that the memory would keep growing request after request, letting them think that the issue was in the GC.
We tried to get more information about this issue, to understand if the problem was in the GC or in the application itself, but what we got instead was a wave of other contributors posting reports of such behavior: the memory keeps growing. The thread grew to the extent that we decided to split it into multiple issues and follow-up on them independently. In the end most of the issues can be explained by some misunderstanding about how memory consumption works in .NET, but also issues in how it was measured.
To help .NET developers better understand their applications, we need to understand how memory management works in ASP.NET Core, how to detect memory related issues, and how to prevent common mistakes.
The GC allocates heap segments where each segment is a contiguous range of memory. Objects placed in it are categorized into one of 3 generations - 0, 1, or 2. The generation determines the frequency with which the GC attempts to release memory on a managed object that are no longer referenced by the application - lower numbers imply higher frequency.
Objects are moved from one generation to another based on their lifetime. As objects live longer they will be moved in a higher generation, and assessed for collection less often. Short term lived objects like the ones that are referenced during the life of a web request will always remain in generation 0. Application level singletons however will most probably move to generation 1 and eventually 2.
When an ASP.NET Core applications has started, the GC will reserve some memory for the initial heap segments and commit a small portion of it when the runtime is loaded. This is done for performance reasons so a heap segment can be in contiguous memory.
Important: An ASP.NET Core process will preemptively allocate a significant amount of memory at startup.
To manually invoke the GC execute GC.Collect(). This will trigger a generation 2 collection and all lower generations. This is usually only used when investigating memory leaks, to be sure the GC has removed all dangling objects from memory before we can measure it.
Note: An application should not have to call
GC.Collect()directly.
Dedicated tools can help analyzing memory usage:
- counting object references
- measuring how much impact the GC has on CPU
- measuring space used for each generation
However for the sake of simplicity this article won't use any of these but instead render some in-app live charts.
For in-depth anlysis please read these articles which demonstrate how to use Visual Studio .NET:
Analyze memory usage without the Visual Studio debugger
Profile memory usage in Visual Studio
Most of the time the memory measure displayed in the Task Manager is used to get an idea of how much memory an ASP.NET application is using. This value represents the amount of memory that is used by the ASP.NET process which includes the application's living objects and other memory consumers such as native memory usage.
Seeing this value increasing indefinitely is a clue that there is a memory leak somewhere in the code but it doesn't explain what it is. The next sections will introduce you to specific memory usage patterns and explain them.
The full source code is available on GitHub at https://github.com/sebastienros/memoryleak
Once it has started the application displays some memory and GC statistics and the page refreshes by itself every second. Specific API endpoints execute specific memory allocation patterns.
To test this application, simply start it. You can see that the allocated memory keeps increasing, because displaying these statistics is allocating custom objects for instance. The GC eventually runs and collects them.
This pages shows a graphs including allocated memory and GC collections. The legend also displays the CPU usage and throughput in requests per second.
The chart displays two values for the memory usage:
- Allocated: the amount of memory occupied by managed objects
- Working Set: the total physical memory (RAM) used by the process (as displayed in the Task Manager)
The following API creates a 10KB String instance and returns it to the client. On each request a new object is allocated in memory and written on the response.
Note: Strings are stored as UTF-16 characters in .NET so each char takes two bytes in memory.
[HttpGet("bigstring")]
public ActionResult<string> GetBigString()
{
    return new String('x', 10 * 1024);
}
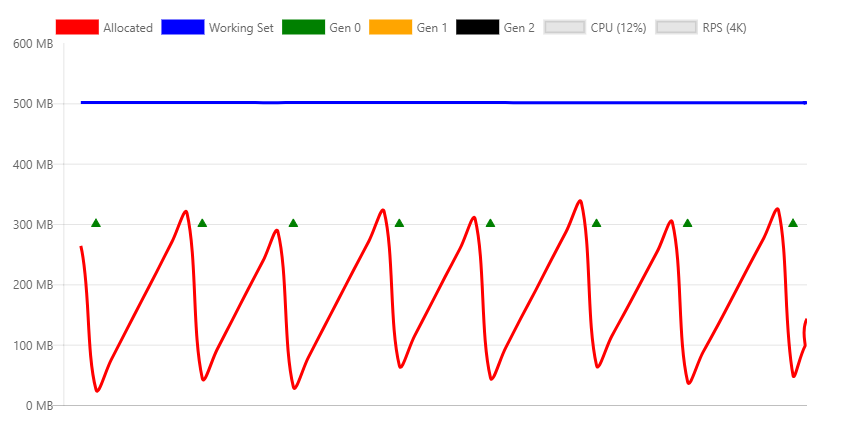
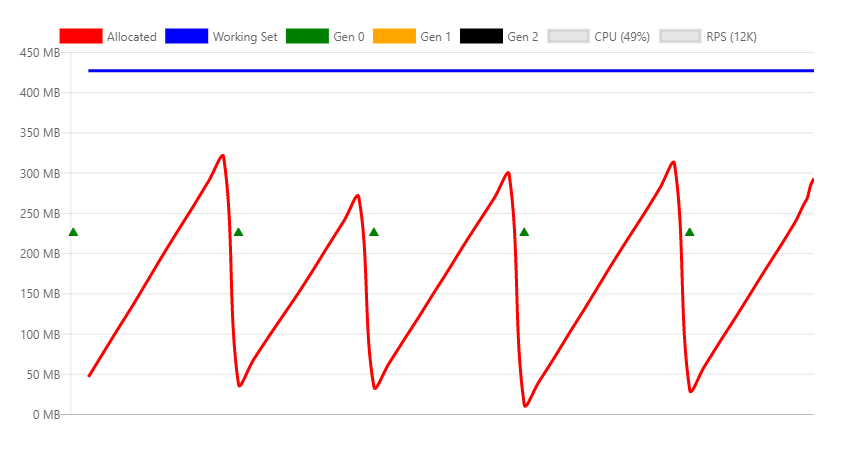
The following graph is generated with a relatively small load of 5K RPS in order to see how the memory allocations are impacted by the GC.
In this example, the GC collect the generation 0 instances about every two seconds once the allocations reach a threshold of a little above 300 MB. The working set is stable at around 500 MB, and the CPU usage is low.
What this graph shows is how on a relatively low requests throughput the memory consumption is very stable to an amount that has been chosen by the GC.
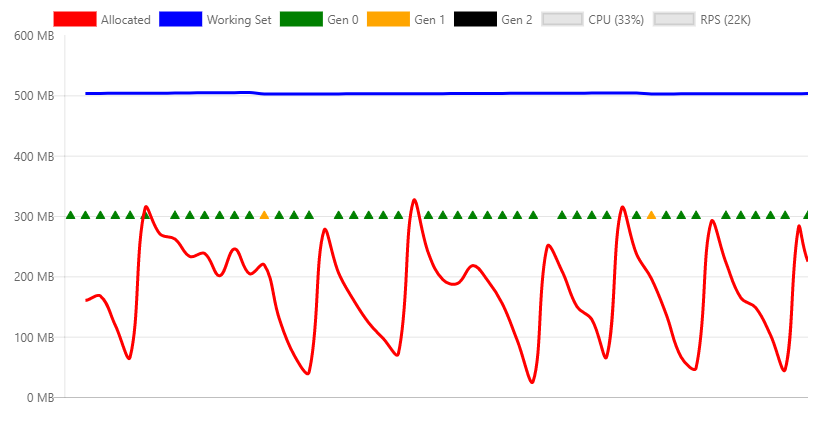
The following chart is taken once the load is increased to the max throughput that can be handled by the machine.
There are some notable points:
- The collections happen much more frequently, as in many times per second
- There are now generation 1 collections, which is due to the fact that we allocated much more of them in the same time interval
- The working set is still stable
What we see is that as long as the CPU is not over-utilized, the garbage collection can deal with a high number of allocations.
The .NET Garbage Collector can work in two different modes, namely the Workstation GC and the Server GC. As their names suggest, they are optimized for different workloads. ASP.NET applications default to the Server GC mode, while desktop applications use the Workstation GC mode.
To visualize the actual impact of these modes, we can force the Workstation GC on our web application by using the ServerGarbageCollection parameter in the project file (.csproj). This will require the application to be rebuilt.
<ServerGarbageCollection>false</ServerGarbageCollection>It can also be done by setting the System.GC.Server property in the runtimeconfig.json file of the published application.
Here is the memory profile under a 5K RPS for the Workstation GC.
The differences are drastic:
- The working set came from 500MB to 70MB
- The GC does generation 0 collections multiple times per second instead of every two seconds
- The GC threshold went from 300MB to 10MB
On a typical web server environment the CPU resource is more critical than memory, hence using the Server GC is better suited. However, some server scenarios might be more adapted for a Workstation GC, for instance on a high density hosting several web application where memory becomes a scarce resource.
Note: On machines with a single core, the GC mode will always be Workstation.
Even though the garbage collector does a good job at preventing memory to grow, if objects are simply held live by the user code GC cannot release them. If the amount of memory used by such objects keeps increasing, it’s called a managed memory leak.
The following API creates a 10KB String instance and returns it to the client. The difference with the first example is that this instance is referenced by a static member, which means it will never available for collection.
private static ConcurrentBag<string> _staticStrings = new ConcurrentBag<string>();

[HttpGet("staticstring")]
public ActionResult<string> GetStaticString()
{
    var bigString = new String('x', 10 * 1024);
    _staticStrings.Add(bigString);
    return bigString;
}
This is a typical user code memory leak as the memory will keep increasing until the process crashes with an OutOfMemory exception.
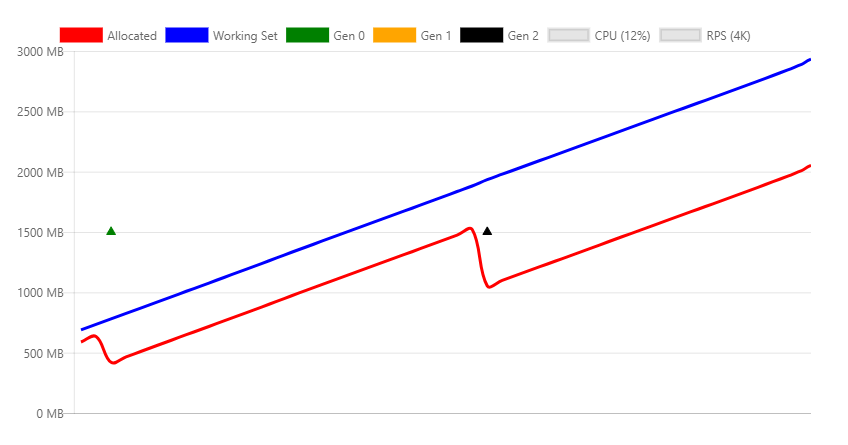
What we can see on this chart once we start issuing requests on this new endpoint is that the working set is no more stable and increases constantly. During that increase the GC tries to free memory as the memory pressure grows, by calling a generation 2 collection. This succeeds and frees some of it, but this can't stop the working set from increasing.
Some scenarios require to keep object references indefinitely, in which case a way to mitigate this issue would be to use the WeakReference class in order to keep a reference on an object that can still be collected under memory pressure. This is what the default implementation of IMemoryCache does in ASP.NET Core.
Memory leaks don't have to be caused by eternal references to managed objects. Some .NET objects rely on native memory to function. This memory cannot be collected by the GC and the .NET objects need to free it using native code.
Fortunately .NET provides the IDisposable interface to let developers release this native memory proactively. And even if Dispose() is not called in time, classes usually do it automatically when the finalizer runs... unless the class is not correctly implemented.
Let's take a look at this code for instance:
[HttpGet("fileprovider")]
public void GetFileProvider()
{
    var fp = new PhysicalFileProvider(TempPath);
    fp.Watch("*.*");
}
PhysicaFileProvider is a managed class, so any instance will be collected at the end of the request.
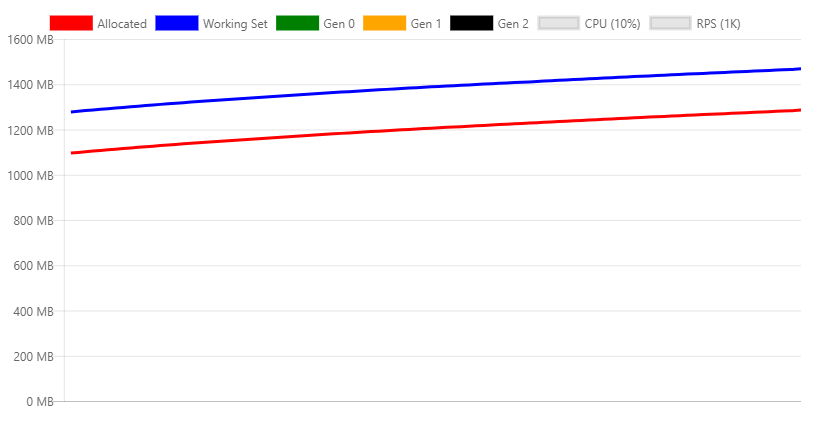
Here is the resulting memory profile while invoking this API continuously.
This chart shows an obvious issue with the implementation of this class, as it keeps increasing memory usage. This is a known issue that is being tracked here https://github.com/aspnet/Home/issues/3110
The same issue could be easily happening in user code, by not releasing the class correctly or forgetting to invoke the Dispose() method of the dependent objects which should be disposed.
As memory gets allocated and freed continuously, fragmentation in the memory can happen. This is an issue as objects have to be allocated in a contiguous block of memory. To mitigate this issue, whenever the garbage collector frees some memory, it will try to defragment it. This process is called compaction.
The problem that compaction faces is that the bigger the object, the slower it is to move it. There is a size after which an object will take so much time to be moved that it is not as efficient anymore to move it. For this reason the GC creates a special memory zone for these large objects, called the Large Object Heap (LOH). Object that are greater than 85,000 bytes (not 85 KB) are placed there, not compacted, and eventually released during generation 2 collections. But another effect is that whenever the LOH is full, it will trigger an automatic generation 2 collection, which is inherently slower as it triggers a collection on all other generations too.
Here is an API that illustrates this behavior:
[HttpGet("loh/{size=85000}")]
public int GetLOH1(int size)
{
    return new byte[size].Length;
}
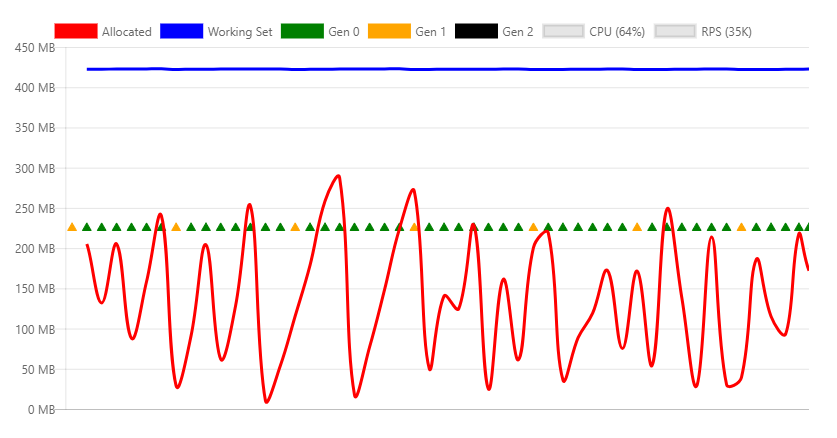
The following chart shows the memory profile of calling this endpoint with a 84,975 bytes array, under maximum load:
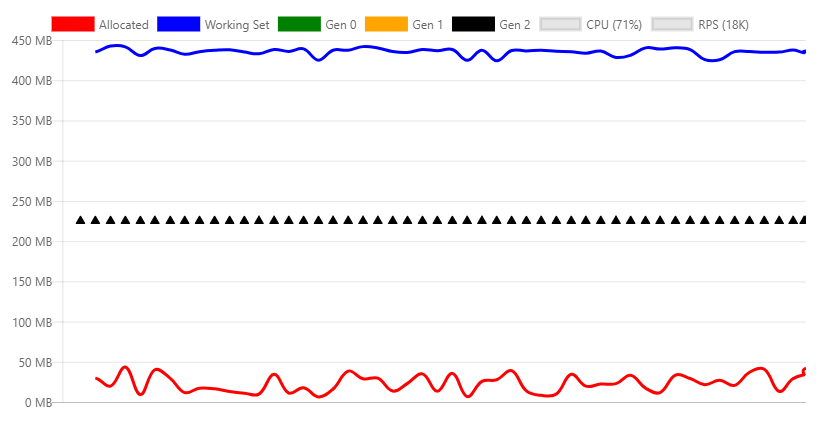
And then the chart when calling the same endpoint but using just one more byte, i.e. 84,976 bytes (the byte[] structure has some little overhead on top of the actual bytes serialization).
The working set is about the same on both scenarios, at a steady 450 MB. But what we notice is that instead of having mostly generation 0 collections, we instead get generation 2 collections, which require more CPU time and directly impacts the throughput which decreases from 35K to 18K RPS, almost halving it.
This shows that very large objects should be avoided. As an example the Response Caching middleware in ASP.NET Core split the cache entries in block of a size lower than 85,000 bytes to handle this scenario.
Here are some links to the specific implementation handling this behavior
- https://github.com/aspnet/ResponseCaching/blob/c1cb7576a0b86e32aec990c22df29c780af29ca5/src/Microsoft.AspNetCore.ResponseCaching/Streams/StreamUtilities.cs#L16
- https://github.com/aspnet/ResponseCaching/blob/c1cb7576a0b86e32aec990c22df29c780af29ca5/src/Microsoft.AspNetCore.ResponseCaching/Internal/MemoryResponseCache.cs#L55
Not specifically a memory leak issue, more of a resource leak one, but this has been seen enough times in user code that it deserved to be mentioned here.
Seasoned .NET developer are used to disposing objects that implement IDisposable. Not doing so might result is leaked memory (see previous examples), or other native resources like database connections and file handlers.
But HttpClient, even though it implements IDisposable, should not be used then disposed on every invocation but reused instead.
Here is an API endpoint that creates and disposes a new instance on every request.
[HttpGet("httpclient1")]
public async Task<int> GetHttpClient1(string url)
{
    using (var httpClient = new HttpClient())
    {
        var result = await httpClient.GetAsync(url);
        return (int)result.StatusCode;
    }
}
While putting some load on this endpoint, some error messages are logged:
fail: Microsoft.AspNetCore.Server.Kestrel[13]
      Connection id "0HLG70PBE1CR1", Request id "0HLG70PBE1CR1:00000031": An unhandled exception was thrown by the application.
System.Net.Http.HttpRequestException: Only one usage of each socket address (protocol/network address/port) is normally permitted ---> System.Net.Sockets.SocketException: Only one usage of each socket address (protocol/network address/port) is normally permitted
   at System.Net.Http.ConnectHelper.ConnectAsync(String host, Int32 port, CancellationToken cancellationToken)
What happens is that even though the HttpClient instances are disposed, the actual network connection will take some time to be released by the operating system. By continuously creating new connections we finally hit ports exhaustion as each client connection requires its own client port.
The solution is to actually reuse the same HttpClient instance like this:
private static readonly HttpClient _httpClient = new HttpClient();

[HttpGet("httpclient2")]
public async Task<int> GetHttpClient2(string url)
{
    var result = await _httpClient.GetAsync(url);
    return (int)result.StatusCode;
}
This instance will eventually get released when the application stops.
This shows that it's not because a resource is disposable that it needs to be disposed right away.
Note: there are better ways to handle the lifetime of an
HttpClientinstance since ASP.NET Core 2.1 https://blogs.msdn.microsoft.com/webdev/2018/02/28/asp-net-core-2-1-preview1-introducing-httpclient-factory/
In the previous example we saw how the HttpClient instance can be made static and reused by all requests to prevent resource exhaustion.
A similar pattern is to use object pooling. The idea is that if an object is expensive to create, then we should reuse its instances to prevent resource allocations. A pool is a collection of pre-initialized objects that can be reserved and released across threads. Pools can define allocation rules like hard limits, predefined sizes, or growth rate.
The Nuget package Microsoft.Extensions.ObjectPool contains classes that help to manage such pools.
To show how beneficial it can be, let's use an API endpoint that instantiates a byte buffer that is filled with random numbers on each request:
        [HttpGet("array/{size}")]
        public byte[] GetArray(int size)
        {
            var random = new Random();
            var array = new byte[size];
            random.NextBytes(array);

            return array;
        }
With some load we can see generation 0 collections happening around every second.
To optimize this code we can pool the byte buffer by using the ArrayPool<> class. A static instance is reused across requests.
The special part of this scenario is that we are returning a pooled object from the API, which means we lose control of it as soon as we return from the method, and we can't release it. To solve that we need to encapsulate the pooled array in a disposable object and then register this special object with HttpContext.Response.RegisterForDispose(). This method will take care of calling Dispose() on the target object so that it's only released when the HTTP request is done.
private static ArrayPool<byte> _arrayPool = ArrayPool<byte>.Create();

private class PooledArray : IDisposable
{
    public byte[] Array { get; private set; }

    public PooledArray(int size)
    {
        Array = _arrayPool.Rent(size);
    }

    public void Dispose()
    {
        _arrayPool.Return(Array);
    }
}

[HttpGet("pooledarray/{size}")]
public byte[] GetPooledArray(int size)
{
    var pooledArray = new PooledArray(size);

    var random = new Random();
    random.NextBytes(pooledArray.Array);

    HttpContext.Response.RegisterForDispose(pooledArray);

    return pooledArray.Array;
}
Applying the same load as the non-pooled version results in the following chart:
You can see that the main difference is allocated bytes, and as a consequence much fewer generation 0 collections.
Understanding how Garbage Collection works together with ASP.NET Core can be helpful to investigate memory pressure issues, and ultimately the performance of an application.
Applying the practices explained in this article should prevent applications from showing signs of memory leaks.
To go further in the understanding of how memory management works in .NET, here are some recommended articles.
Understanding different GC modes with Concurrency Visualizer
