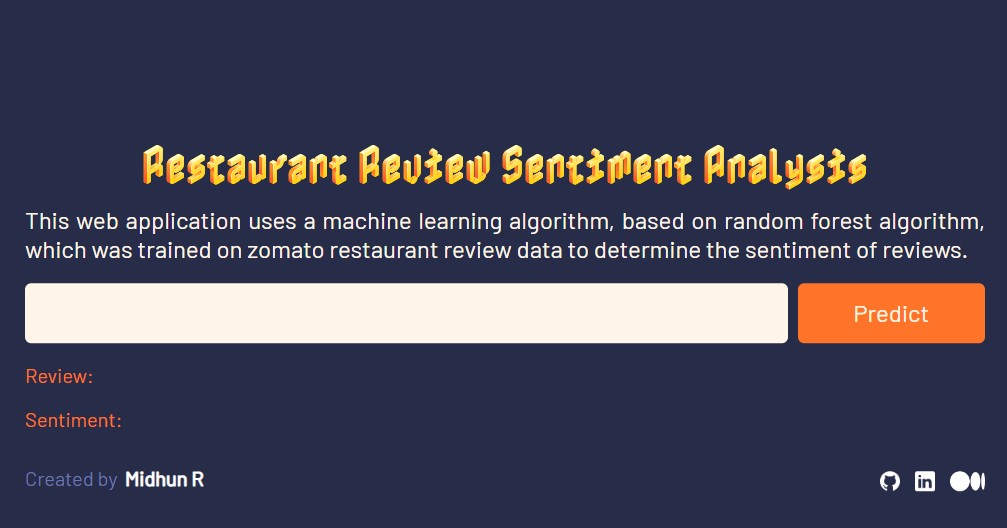
 Link to deployed model: http://sentimenent-analysis-zomato-review.ap-south-1.elasticbeanstalk.com/
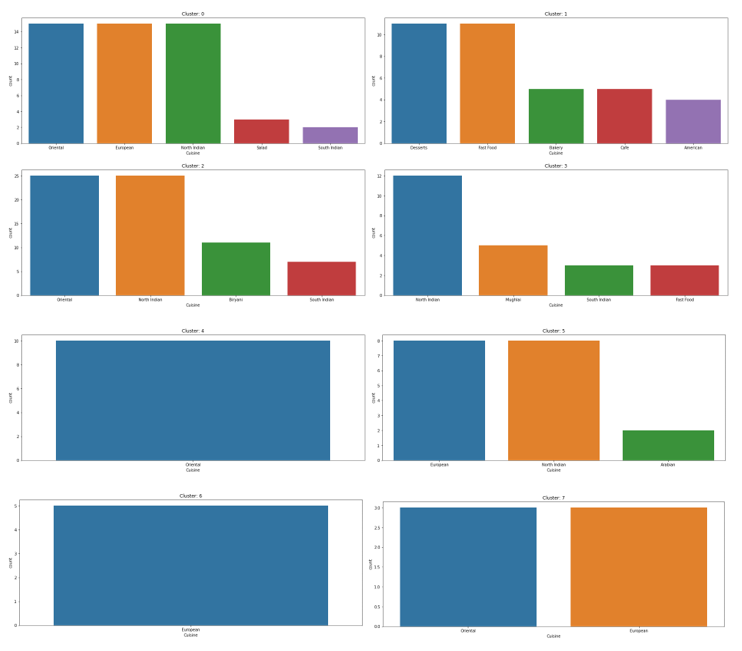
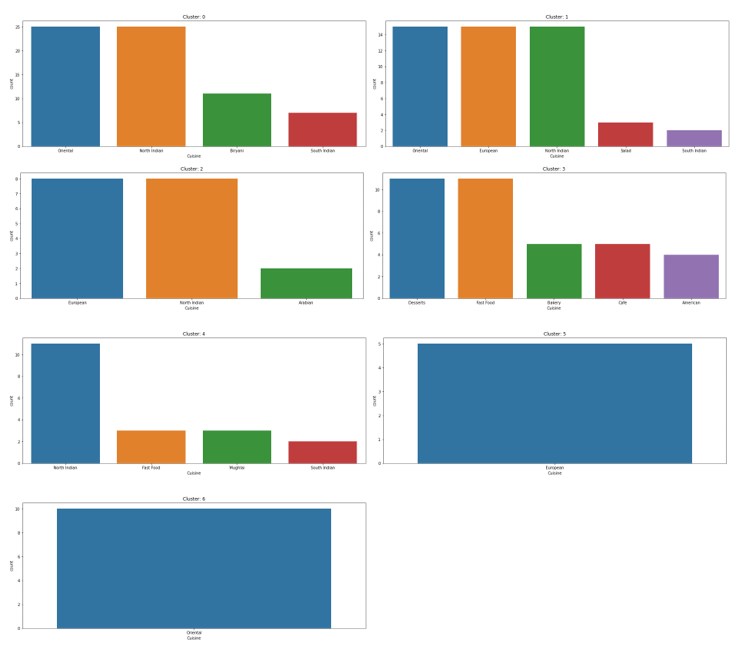
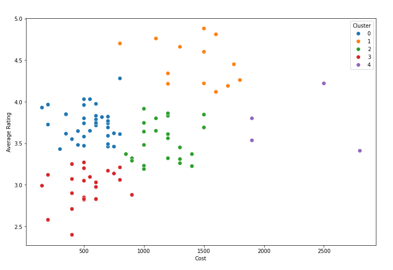
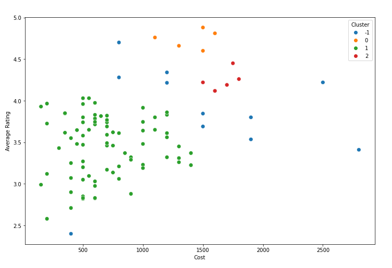
In this project, I have attempted to analyze the metadata and reviews of popular restaurants in Hyderabad and build machine learning models to cluster the restaurants into different segments based on cuisines and analyze the sentiments of the reviews given by the customers.
This project contains an executable iPython Notebook, a presentation and source as follows:
- Zomato_Restaurant_Clustering_and_Sentiment_Analysis.ipynb - Google Colab notebook containing data summary, exploration, visualisations, feature engineering, text processing, modelling, performance evaluation and conclusion.
- Presentation PDF - Unsupervised Machine Learning - Zomato Restaurant Clustering and Sentiment Analysis - Capstone Project.pdf - Presentation slideshow of the project.
- Data & Resources.zip - Includes metadata and review data of restaurants listed by Zomato in Hyderabad.
Zomato is an Indian restaurant aggregator and food delivery start-up founded by Deepinder Goyal and Pankaj Chaddah in 2008. Zomato provides information, menus, and user-reviews of restaurants, and also has food delivery options from partner restaurants in select cities. The main objective is to understand the existing data and analyze their trends and patterns, so that machine learning models can be built, one for segmentation of restaurant types and another for sentiment analysis of reviews.
- Understanding the business task.
- Reading data from files given and providing a summary.
- Data cleaning, which involves removing irregularities in the data.
- Exploratory data analysis, to find which factors affect sales and how they affect it.
- Feature engineering, to prepare data for modelling.
- Text Processing, to convert text to numeric data for modelling.
- Modelling data (for both clustering and sentiment analysis) and comparing the models to find out the most suitable one for forecasting.
- Conclusion.
The following insights were gained from EDA:
Link to deployed model: http://sentimenent-analysis-zomato-review.ap-south-1.elasticbeanstalk.com/
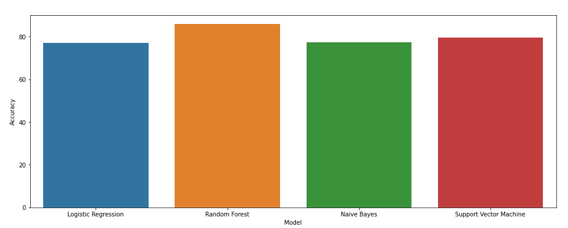
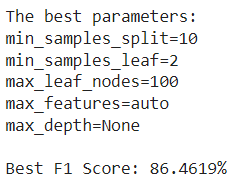
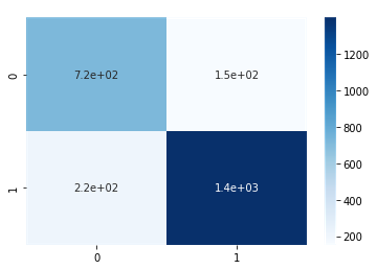
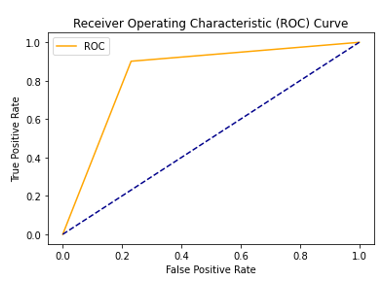
The following conclusions were drawn from Modelling:
Midhun R | Avid Learner | Data Analyst | Data Scientist | Machine Learning Enthusiast
Contact me for Data Science Project Collaborations
Scikit Learn, 'sklearn.preprocessing.MultiLabelBinarizer'. [Online].
Available: https://scikit-learn.org/stable/modules/generated/sklearn.preprocessing.MultiLabelBinarizer.html/
Towards Data Science, 'A One-Stop Shop for Principal Component Analysis'. [Online].
Available: https://towardsdatascience.com/a-one-stop-shop-for-principal-component-analysis-5582fb7e0a9c/
Medium, 'Silhouette Analysis in K-means Clustering'. [Online].
Available: https://medium.com/@cmukesh8688/silhouette-analysis-in-k-means-clustering-cefa9a7ad111/
