Author: Connor Lindsey
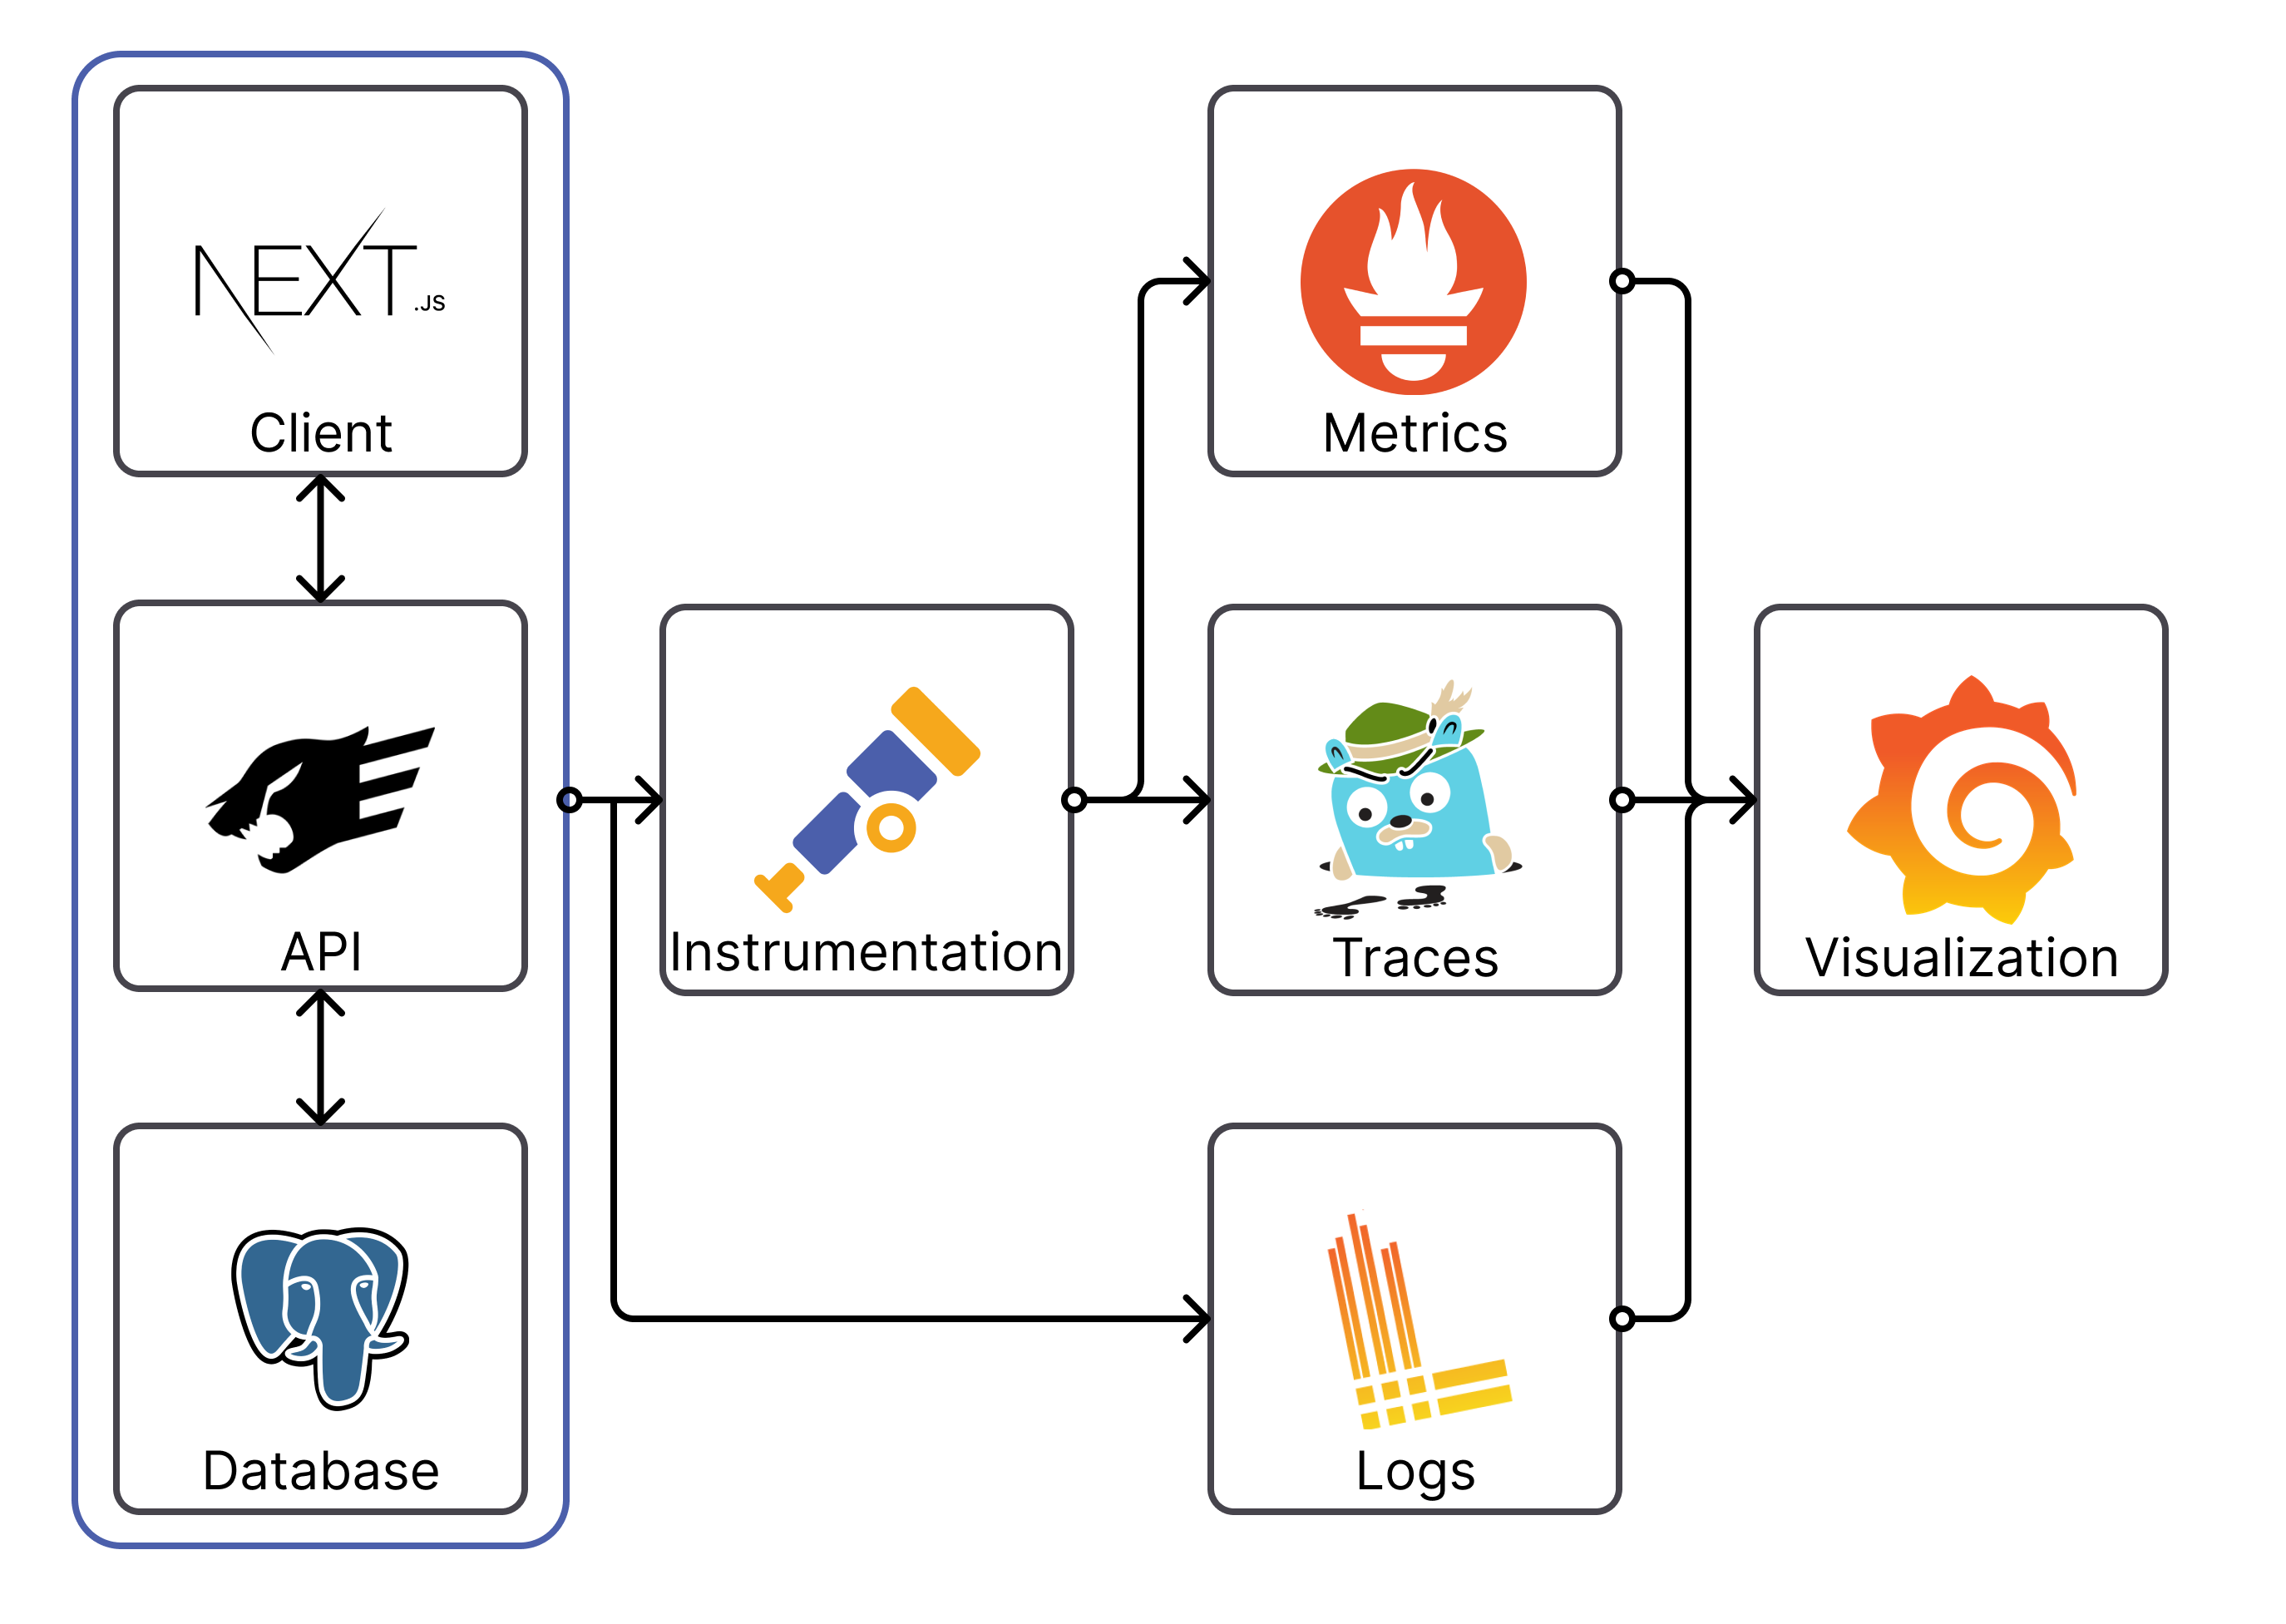
This demo application demonstrates how to monitor a JavaScript application using open source observability software. The following projects are used:
- OpenTelemetry - Instrument the application and send observability data to each backend.
- Jaeger - Distributed tracing backend.
- Prometheus - Metrics and alerting backend.
- Loki - Logs aggregation system.
- Grafana - Visualize all of our observability data.
- api/ - Fastify API. Instrumented with OpenTelemetry
- app/ - Simple Next.js app.
- db/ - Stores copy of Postgres data for persistence.
- config/ - Standard configuration for Prometheus, Promtail, Loki, etc.
- data/ - Stores server logs
- Run with
npm run dev. Requires Docker and docker-compose. - Optionally, run
npm installin/apiand/app. - Open the app at http://localhost
- View traces, logs, and metrics in Grafana at http://localhost:3000
- Grafana Demo
- Grafana Cloud - Actually useful free tier
- OpenTelemetry Key Terms
- OpenTelemetry JS
- OpenTelemetry JS Contrib
- OpenTelemetry Status
- UtahJS Slides
