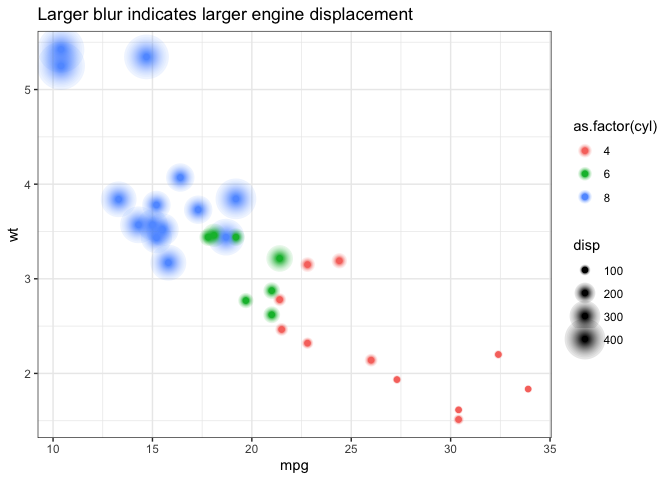
ggblur provides geom_point_blur() for use in ggplot - this geom
allows you to control the blurriness of the drawn points, but is
otherwise identical to the standard geom_point().
geom_point_blur()- same as
geom_point()but now acceptsblur_sizeas an aesthetic - also allows for control of the smoothness of the blur
(
blur_steps)
- same as
scale_blur_size_continuous(),scale_blur_size_discrete()andscale_blur_size_manual()for controllingblur_sizewhen used as a mapped aesthetic/
- ggecho is an earlier
experiment of mine from 2019 where I echo components using a custom
stat
stat_echo. This solution works across multiple geoms, but didn’t allow for adjusting the echo for individual points. - ggfx adds blur at the layer level i.e. no individual control over the amount of blur for each point.
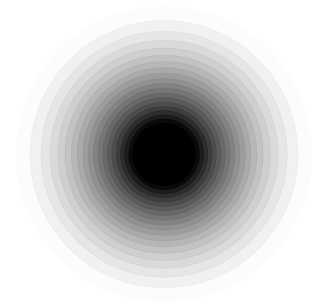
Blur is simulated by keeping the original point, and drawing a sequence of larger, faded points behind it (illustrated below).
The number of points rendered is controlled by blur_steps and the
distance to which the blur extends beyond the edge of the original point
is controlled by blur_size.
Note: Paul Murrell has some experiments to add radial gradients to grid graphics (see his github) and if this becomes part of grid it may be a better method of simulating blur.
You can install the development version from GitHub with:
# install.packages("devtools")
devtools::install_github("coolbutuseless/ggblur")When not used as a mapped aesthetic within aes(), the same blur_size
is applied to every point.
library(ggplot2)
library(ggblur)

ggplot(mtcars) +
  geom_point_blur(aes(mpg, wt), blur_size = 10) +
  theme_bw() +
  labs(title = "Same blur for each point")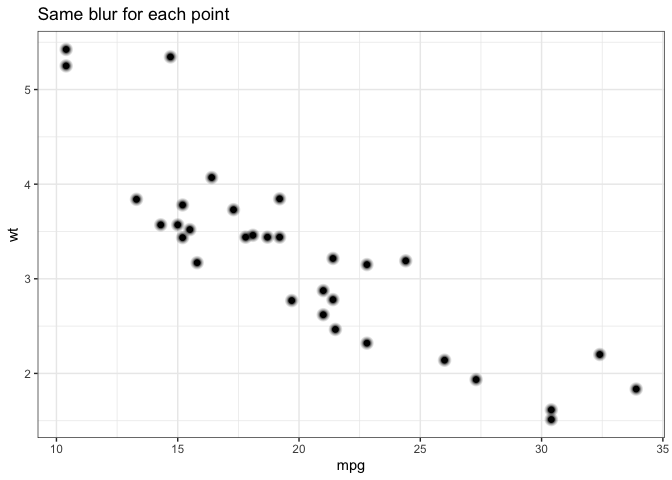
When used as a mapped aesthetic within aes(), the blur_size is
calculated individually for each point.
library(ggplot2)
library(ggblur)

ggplot(mtcars) +
  geom_point_blur(aes(mpg, wt, blur_size = disp)) +
  theme_bw() +
  labs(title = "Larger blur indicates larger engine displacement")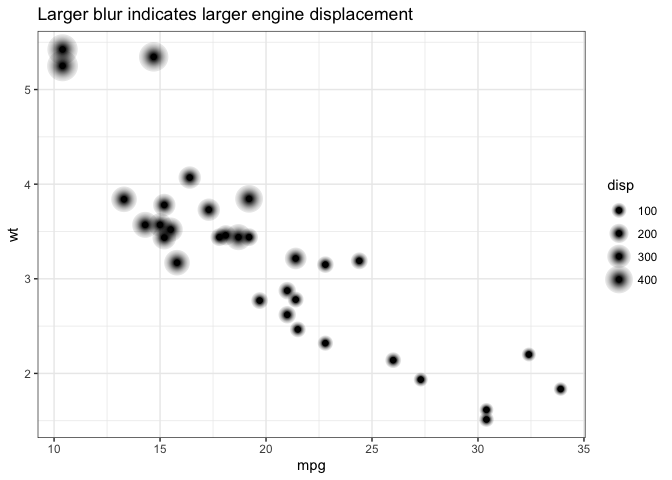
blur_steps and scale_blue_size_continuous/discrete/manual() can be
used to further customise the appearance.
ggplot(mtcars) +
  geom_point_blur(aes(mpg, wt, blur_size = disp), blur_steps = 3) +
  scale_blur_size_continuous(range = c(1, 15)) +
  theme_bw() +
  labs(title = "Larger blur indicates larger engine displacement")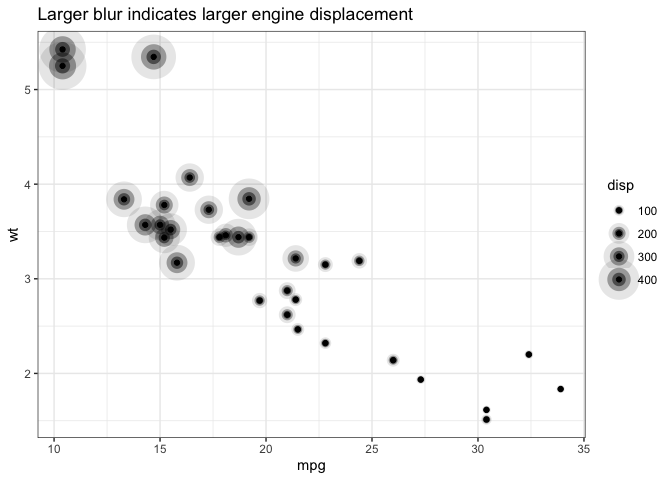
ggplot(mtcars) +
  geom_point_blur(aes(mpg, wt, blur_size = disp, colour = as.factor(cyl))) +
  scale_blur_size_continuous(range = c(1, 15)) +
  theme_bw() +
  labs(title = "Larger blur indicates larger engine displacement")