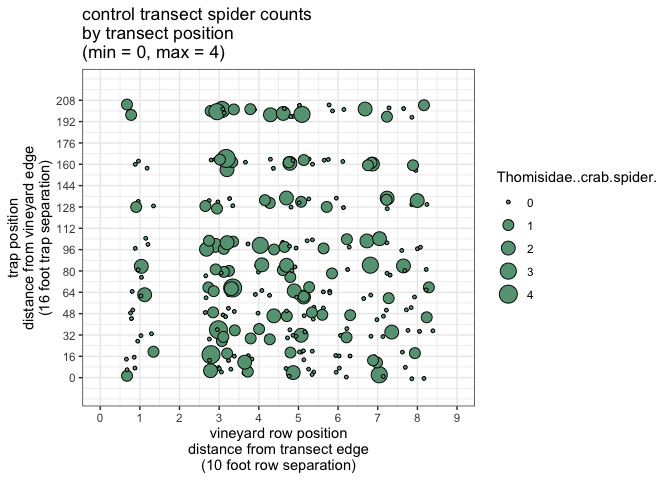
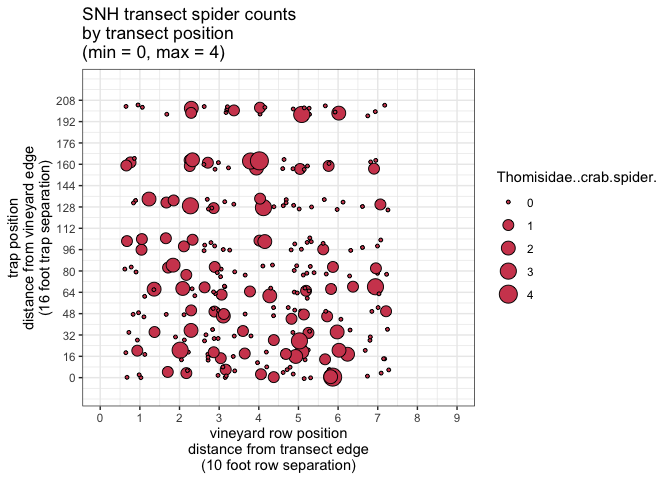
Abundance Estimate
| Control Transect | SNH Transect |
|---|---|
| 0.9573448 spiders/sq-ft | 0.9118289 spiders/sq-ft |
| 95% CI=( 0.8170945 to 1.196123 ) | 95% CI=( 0.7399267 to 1.187072 ) |
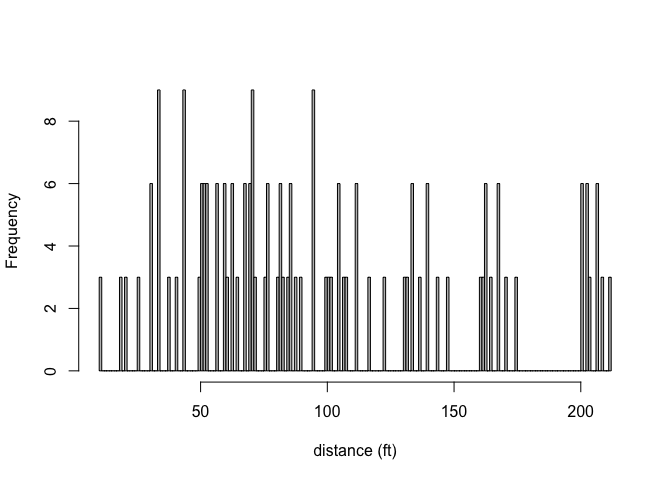
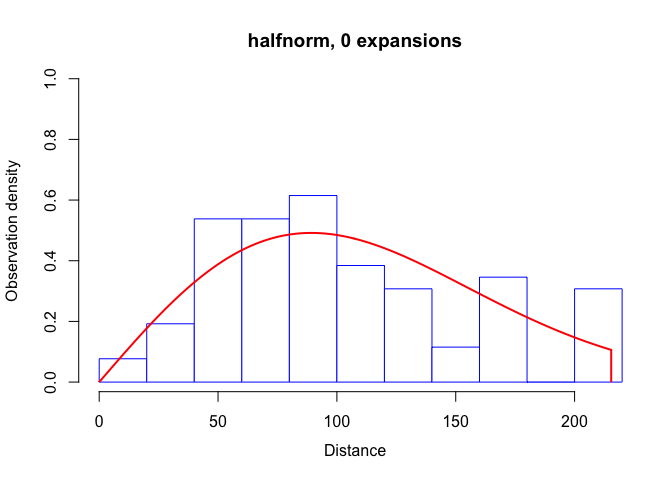
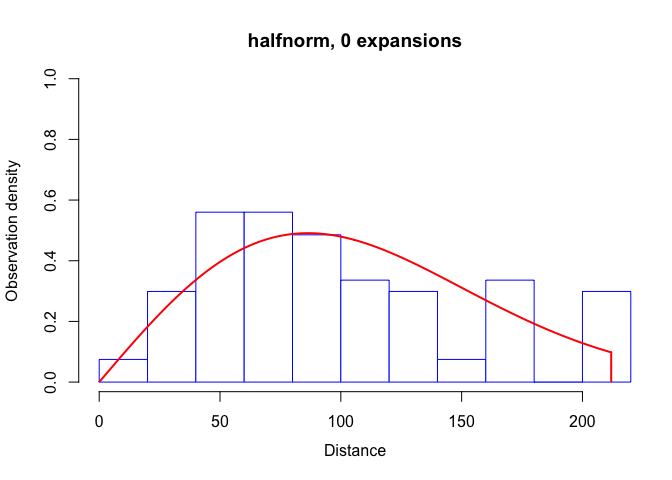
diagnostics (below) from Beginner Point-Transect Analysis in Rdistance (https://cran.r-project.org/web/packages/Rdistance/vignettes/Rdistance_BeginnerPointTransects.pdf)
For each method, the primary survey comprises a random sample of points, or more usually a systematic grid of points, through the region of interest. Animals are lured to a point, or trapped at a point, and the number of animals observed at each point is recorded. A separate study is conducted on a subset of animals, to record whether they respond to the lure or enter the trap, for a range of known distances from the point. These data are used to estimate the probability that an animal will respond to the lure or enter the trap, as a function of its initial distance from the point. This allows the counts to be converted to an estimate of abundance in the survey region. https://besjournals.onlinelibrary.wiley.com/doi/full/10.1111/j.1365-2664.2006.01135.x#b4
Point transect methods work well for many species, but some species are insufficiently visible or noisy to allow adequate numbers of detections by observers standing at random points. This has led to the development of methods that combine trapping studies with point transect sampling. The standard method for this is the trapping web (Anderson et al. 1983; Lukacs, Franklin & Anderson 2004). A single web typically contains 90 or more traps, which are arranged rather like a circular spider’s web, with a higher density of traps at the centre than at the edges. Conceptually, the point of the point transect is at the centre of the web, and trapping density is sufficient to be certain of trapping any animals located at or near the web centre. https://besjournals.onlinelibrary.wiley.com/doi/full/10.1111/j.1365-2664.2006.01135.x#b7 * https://besjournals.onlinelibrary.wiley.com/doi/full/10.1111/j.1365-2664.2006.01135.x#b19 *
A fundamental characteristic of distance-sampling analyses is that sightability (probability of detection) of targets is assumed to decline as off-transect distances increase. Targets far from the transect are assumed to be harder to detect than targets close to the transect. https://github.com/tmcd82070/Rdistance/wiki/Basic-information-on-distance-sampling
User-Defined Likelihood Functions in Rdistance https://cran.r-project.org/web/packages/Rdistance/vignettes/Rdistance_CustomDetectionFunction.pdf
Distance software: design and analysis of distance sampling surveys for estimating population size https://www.ncbi.nlm.nih.gov/pmc/articles/PMC2847204/
Distance Sampling https://onlinelibrary.wiley.com/doi/abs/10.1002/0470011815.b2a16019
