maup is the geospatial toolkit for redistricting data. The package streamlines
the basic workflows that arise when working with blocks, precincts, and
districts, such as
- Assigning precincts to districts,
- Aggregating block data to precincts,
- Disaggregating data from precincts down to blocks,
- Prorating data when units do not nest neatly, and
- Fixing topological issues, overlaps, and gaps
The project's priorities are to be efficient by using spatial indices whenever possible and to integrate well with the existing ecosystem around pandas, geopandas and shapely. The package is distributed under the MIT License.
To install maup from PyPI, run pip install maup from your terminal.
For development, maup uses Poetry.
To develop new maup features, clone this repository and run poetry install.
Here are some basic situations where you might find maup helpful. For these
examples, we use test data from Providence, Rhode Island, which you can find in
our
Rhode Island shapefiles repo, or
in the examples folder of this repo, reprojected to a non-geographic coordinate
reference system (CRS) optimized
for Rhode Island.
** Many of maup's functions behave badly in geographic projections (i.e., lat/long coordinates), which are the default for shapefiles from the U.S. Census bureau. In order to find an appropriate CRS for a particular shapefile, consult the database at https://epsg.org.**
>>> import geopandas
>>> import pandas
>>>
>>> blocks = geopandas.read_file("zip://./examples/blocks.zip").to_crs(32030)
>>> precincts = geopandas.read_file("zip://./examples/precincts.zip").to_crs(32030)
>>> districts = geopandas.read_file("zip://./examples/districts.zip").to_crs(32030)The assign function in maup takes two sets of geometries called sources
and targets and returns a pandas Series. The Series maps each geometry in
sources to the geometry in targets that covers it. (Here, geometry A
covers geometry B if every point of A and its boundary lies in B or its
boundary.) If a source geometry is not covered by one single target geometry, it
is assigned to the target geometry that covers the largest portion of its area.
>>> import maup
>>>
>>> precinct_to_district_assignment = maup.assign(precincts, districts)
>>> # Add the assigned districts as a column of the `precincts` GeoDataFrame:
>>> precincts["DISTRICT"] = precinct_to_district_assignment
>>> precinct_to_district_assignment.head()
0     7
1     5
2    13
3     6
4     1
dtype: int64
As an aside, you can use that precinct_to_district_assignment object to create a
gerrychain Partition
representing this districting plan.
Precinct shapefiles usually come with election data, but not demographic data.
In order to study their demographics, we need to aggregate demographic data from
census blocks up to the precinct level. We can do this by assigning blocks to
precincts and then aggregating the data with a Pandas
groupby
operation:
>>> variables = ["TOTPOP", "NH_BLACK", "NH_WHITE"]
>>>
>>> blocks_to_precincts_assignment = maup.assign(blocks, precincts)
>>> precincts[variables] = blocks[variables].groupby(blocks_to_precincts_assignment).sum()
>>> precincts[variables].head()
   TOTPOP  NH_BLACK  NH_WHITE
0    5907       886       380
1    5636       924      1301
2    6549       584      4699
3    6009       435      1053
4    4962       156      3713
If you want to move data from one set of geometries to another but your source and target geometries do not nest neatly (e.g., have overlaps), see Prorating data when units do not nest neatly.
It's common to have data at a coarser scale that you want to attach to finer-scaled geometries. Usually this happens when vote totals for a certain election are only reported at the county level, and we want to attach that data to precinct geometries.
Let's say we want to prorate the vote totals in the columns "PRES16D",
"PRES16R" from our precincts GeoDataFrame down to our blocks GeoDataFrame.
The first crucial step is to decide how we want to distribute a precinct's data
to the blocks within it. Since we're prorating election data, it makes sense to
use a block's total population or voting-age population. Here's how we might
prorate by population ("TOTPOP"):
>>> election_columns = ["PRES16D", "PRES16R"]
>>> blocks_to_precincts_assignment = maup.assign(blocks, precincts)
>>>
>>> # We prorate the vote totals according to each block's share of the overall
>>> # precinct population:
>>> weights = blocks.TOTPOP / blocks_to_precincts_assignment.map(blocks.TOTPOP.groupby(blocks_to_precincts_assignment).sum())
>>> prorated = maup.prorate(blocks_to_precincts_assignment, precincts[election_columns], weights)
>>>
>>> # Add the prorated vote totals as columns on the `blocks` GeoDataFrame:
>>> blocks[election_columns] = prorated
>>>
>>> # We'll call .round(2) to round the values for display purposes, but note that the
>>> # actual values should NOT be rounded in order to avoid accumulation of rounding
>>> # errors.
>>> blocks[election_columns].round(2).head()
   PRES16D  PRES16R
0     0.00     0.00
1    12.26     1.70
2    15.20     2.62
3    15.50     2.67
4 3.28 0.45We strongly urge you not to prorate by area! The area of a census block is not a good predictor of its population. In fact, the correlation goes in the other direction: larger census blocks are less populous than smaller ones.
(1) Many states contain Census blocks and precincts that have zero population. In the example above, a zero-population precinct leads to division by zero in the definition of the weights, which results in NaN values for some entries.
Although it is not strictly necessary to resolve this in the example above, sometimes this creates issues down the line. One option is to replace NaN values with zeros, using
>>> weights = weights.fillna(0)(2) In some cases, zero-population precincts may have a small nonzero number of recorded votes in some elections. The procedure outlined above will lose these votes in the proration process due to the zero (or NaN) values for the weights corresponding to all the blocks in those precincts. If it is crucial to keep vote totals perfectly accurate, these votes will need to be assigned to the new units manually.
Suppose you have a shapefile of precincts with some election results data and you want to join that data onto a different, more recent precincts shapefile. The two sets of precincts will have overlaps, and will not nest neatly like the blocks and precincts did in the above examples. (Not that blocks and precincts always nest neatly---in fact, they usually don't!)
In most cases, election data should be prorated from each old precincts to the new precincts with weights proportional to the population of the intersections between the old precinct and each new precinct. The most straightforward way to accomplish this is to first disaggregate the data from the old precincts to Census blocks as in the example above, and then reaggregate from blocks to the new precincts.
>>> old_precincts = precincts
>>> new_precincts = geopandas.read_file("zip://./examples/new_precincts.zip").to_crs(32030)
>>>
>>> election_columns = ["SEN18D", "SEN18R"]
>>>
>>> blocks_to_old_precincts_assignment = maup.assign(blocks, old_precincts)
>>> blocks_to_new_precincts_assignment = maup.assign(blocks, new_precincts)
>>>
>>> # We prorate the vote totals according to each block's share of the overall
>>> # old precinct population:
>>> weights = blocks.TOTPOP / blocks_to_old_precincts_assignment.map(blocks.TOTPOP.groupby(blocks_to_old_precincts_assignment).sum()).fillna(0)
>>> prorated = maup.prorate(blocks_to_old_precincts_assignment, precincts[election_columns], weights)
>>>
>>> # Add the prorated vote totals as columns on the `blocks` GeoDataFrame:
>>> blocks[election_columns] = prorated
>>>
>>> new_precincts[election_columns] = blocks[election_columns].groupby(blocks_to_new_precincts_assignment).sum()
>>> new_precincts[election_columns].round(2).head()
    SEN18D   SEN18R
0   728.17    49.38
1	370.00	  21.00
2	 97.00	  17.00
3	 91.16	   5.55
4	246.00	  20.00
As a sanity check, let's make sure that no votes were lost in either step. Total votes in the old precincts:
>>> old_precincts[election_columns].sum()
SEN18D    23401
SEN18R     3302
dtype: float64
>>>
>>> blocks[election_columns].sum()
SEN18D    23401.0
SEN18R     3302.0
dtype: float64
>>>
>>> new_precincts[election_columns].sum()
SEN18D    20565.656675
SEN18R     2947.046857
dtype: float64
Oh no - what happened??? All votes were successfully disaggregated to blocks, but a significant percentage were lost when reaggregating to new precincts.
It turns out that when blocks were assigned to both old and new precincts, many blocks were not assigned to any precincts. We can count how many blocks were unassigned in each case:
print(len(blocks))
print(blocks_to_old_precincts_assignment.isna().sum())
print(blocks_to_new_precincts_assignment.isna().sum())
3014
884
1227
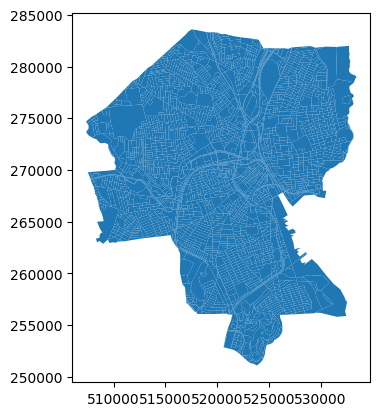
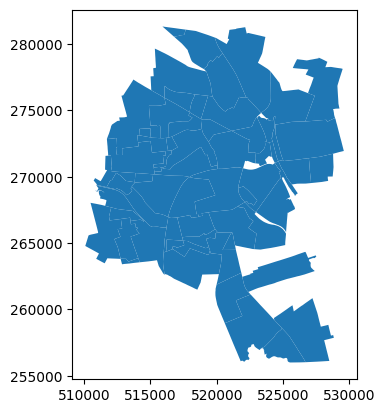
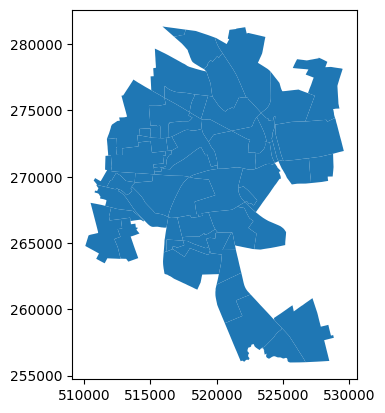
So, out of 3,014 total Census blocks, 884 were not assigned to any old precinct and 1,227 were not assigned to any new precinct. If we plot the shapefiles, we can see why:
>>> blocks.plot()>>> old_precincts.plot()>>> new_precincts.plot()The boundaries of the regions covered by these shapefiles are substantially different---and that doesn't even get into the possibility that the precinct shapefiles may have gaps between precinct polygons that some blocks may fall into.
Once we know to look for this issue, we can see that it affected the previous example as well:
>>> blocks[variables].sum()
TOTPOP      178040
NH_BLACK     23398
NH_WHITE     66909
dtype: int64
>>>
>>> precincts[variables].sum()
TOTPOP      140332
NH_BLACK     19345
NH_WHITE     46667
dtype: int64These issues should be diagnosed and repaired to the greatest extent possible before moving data around between shapefiles; see Fixing topological issues, overlaps, and gaps below for details about how maup can help with this.
For long-running operations, the user might want to see a progress bar to estimate how much longer a task will take (and whether to abandon it altogether).
maup provides an optional progress bar for this purpose. To temporarily activate
a progress bar for a certain operation, use with maup.progress()::
>>> with maup.progress():
...     assignment = maup.assign(precincts, districts)
...
To turn on progress bars for all applicable operations (e.g. for an entire script),
set maup.progress.enabled = True:
>>> maup.progress.enabled = True
>>> # Now a progress bar will display while this function runs:
>>> assignment = maup.assign(precincts, districts)
>>> # And this one too:
>>> pieces = maup.intersections(old_precincts, new_precincts, area_cutoff=0)Precinct shapefiles are often created by stitching together collections of precinct geometries sourced from different counties or different years. As a result, the shapefile often has gaps or overlaps between precincts where the different sources disagree about the boundaries. These gaps and overlaps pose problems when you are interested in working with the adjacency graph of the precincts, and not just in mapping the precincts. This adjacency information is especially important when studying redistricting, because districts are almost always expected to be contiguous.
maup provides functions for closing gaps and resolving overlaps in a
collection of geometries. As an example, we'll apply both functions to these
geometries, which have both an overlap and a gap:
Usually the gaps and overlaps in real shapefiles are tiny and easy to miss, but this exaggerated example will help illustrate the functionality.
First, we'll use shapely to create the polygons from scratch:
from shapely.geometry import Polygon
geometries = geopandas.GeoSeries([
    Polygon([(0, 0), (2, 0), (2, 1), (1, 1), (1, 2), (0, 2)]),
    Polygon([(2, 0), (4, 0), (4, 2), (2, 2)]),
    Polygon([(0, 2), (2, 2), (2, 4), (0, 4)]),
    Polygon([(2, 1), (4, 1), (4, 4), (2, 4)]),
])
Now we'll close the gap:
without_gaps = maup.close_gaps(geometries)The without_gaps geometries look like this:
And then resolve the overlaps:
without_overlaps_or_gaps = maup.resolve_overlaps(without_gaps)The without_overlaps_or_gaps geometries look like this:
Alternatively, there is also a convenience maup.autorepair() function provided that
attempts to resolve topological issues as well as close gaps and resolve overlaps:
without_overlaps_or_gaps = maup.autorepair(geometries)The functions resolve_overlaps, close_gaps, and autorepair accept a
relative_threshold argument. This threshold controls how large of a gap or
overlap the function will attempt to fix. The default value of
relative_threshold is 0.1, which means that the functions will leave alone
any gap/overlap whose area is more than 10% of the area of the geometries that
might absorb that gap/overlap. In the above example, we set
relative_threshold=None to ensure that no gaps or overlaps were ignored.
The name of this package comes from the
modifiable areal unit problem (MAUP):
the same spatial data will look different depending on how you divide up the
space. Since maup is all about changing the way your data is aggregated and
partitioned, we have named it after the MAUP to encourage users to use the
toolkit thoughtfully and responsibly.


