Subspace node and farmer with monitoring stack using Docker Compose.
This is a basic setup that is only recommended for use on a computer/server which is on a secure network with fully understood ingress. This is becuase we will be opening ports to the whole network that should always be controlled with additional access rules when that means the internet.
This repository extends the official Subspace Docker compose setup to include a monitoring solution that allows the user to track instantaneous performance as well as look for trends in the way their node is operating over time. It is made up of the following components:
- Subspace Node
- Subspace Farmer
- Grafana
- Prometheus
- Node Exporter
In this version, all of these items are setup to run under a single docker-compose.yml though there are ways to use the same stack (or parts thereof) as bare metal or remote by installing the relevant applications outside of Docker. In this sceanrio there are considerations to be made on how the Docker network will talk to the host or remote machine.
At the core of this solution are the Subspace Node and Farmer. These are containerised versions of the application which you can read more about here: https://github.com/subspace/subspace/blob/main/docs/farming.md. We take the example docker-compose.yml from the official ducumentation and add the following extra Docker images:
- Grafana (https://grafana.com/)
- Allows us to visualise the monitoring data we are collecting. It enables us to hook 'scraped' data up to dashboards that give us an easy on the eye way of interpreting the raw data.
- Prometheus (https://prometheus.io)
- Prometheus is an open-source systems monitoring and alerting toolkit. In our setup we are using Prometheus to organise and persist the data we are gathering from a few places and expose it in a common data format/source we will hook Grafana up to.
- Node Exporter (https://grafana.com/oss/prometheus/exporters/node-exporter)
- Exposes raw data about the hardware performance of the machine the stack is running on. CPU/IO usage for example.
A custom dashboard has been written that will automatically be provisioned when the user runs docker compose up.
- First, clone the repository at https://github.com/counterpointsoftware/subspace-monitoring. You can do this with the command
git clone https://github.com/counterpointsoftware/subspace-monitoring.git. This will get you the default setup which you will now need to customise in the following ways:- Ensure you have the latest images referenced by checking the 'Subspace' section against the official documentation at https://github.com/subspace/subspace/blob/main/docs/farming.md#-docker-instructions. We aim to keep the repository up-to-date but, until this is automated, there will be a short delay between the team updating their documentation and us reacting to that change.
- Enable the Prometheus stats on the Subspace node. This step is already taken care of in the extended
docker-compose.ymlin the repository but is included to document the changes that have been made from the official version. Enabling them is done by adding the following lines to thecommandsection of thenodeservice (remember you will need to add trailing commas as appropriate):"--prometheus-external""--prometheus-port", "9615"- In addition, we will need to expose port 9615 to the Docker network with:
expose:- "9615:9615"
- Follow the official instructions to ensure you customise Subspace parameters as necessary. At time of writing these are:
- Replace snapshot-DATE with the latest release (not pre-release!) snapshot (like snapshot-2022-apr-29)
- Replace INSERT_YOUR_ID with desired name that will be shown in telemetry (doesn't impact anything else)
- Replace WALLET_ADDRESS with your wallet address
- Replace PLOT_SIZE with plot size in gigabytes or terabytes, for instance 100G or 2T (but leave at least 10G of disk space for node)
- If you want to store files on a separate disk or customize port, read comments in the file
- Set Grafana admin username and use a strong password by editing these lines:
GF_SECURITY_ADMIN_USER=ADMINGF_SECURITY_ADMIN_PASSWORD=StrongPassword
Once all of these steps have been followed you should be able to open a terminal and navigate to the same folder the docker-compose.yml file you've been editing is located before running the docker compose up --detach command. Once the stack has initialised you should be able to access Grafana on http://localhost:3000. Login using the username and password you set and:
- Navigate to Dashboards -> Browse
- Expand the General folder if it is not already open
- Select the Subspace Dashboard
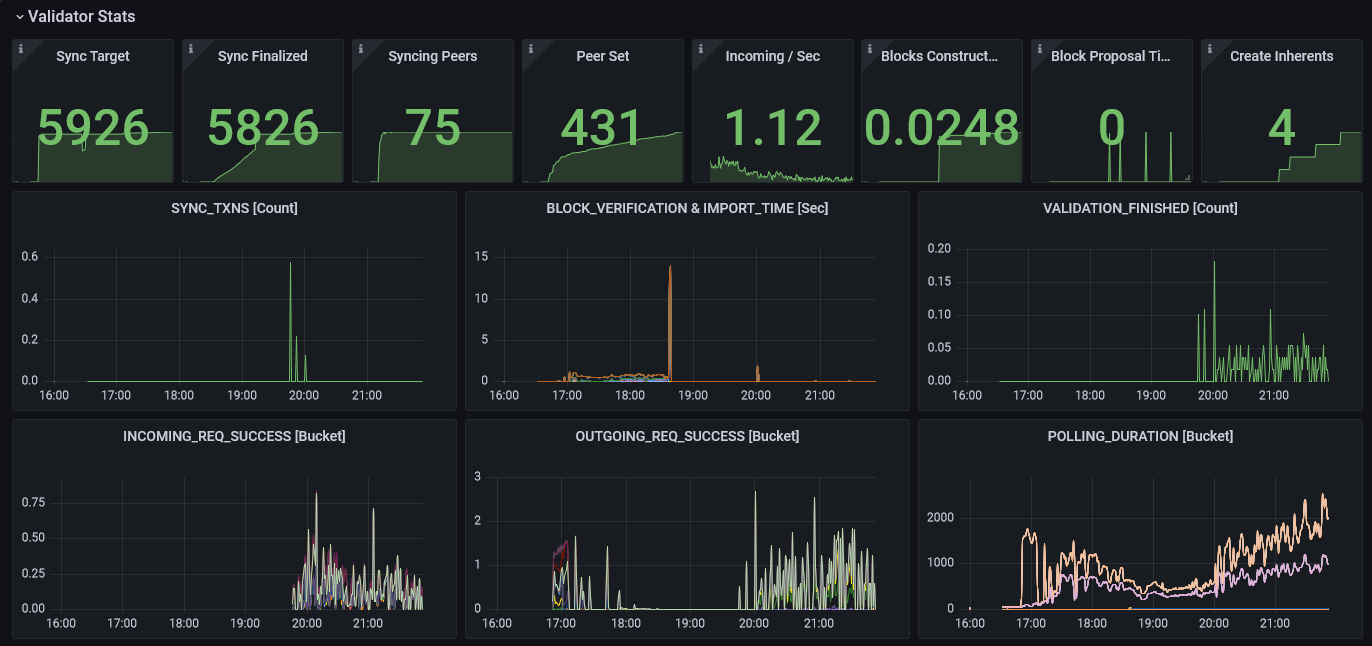
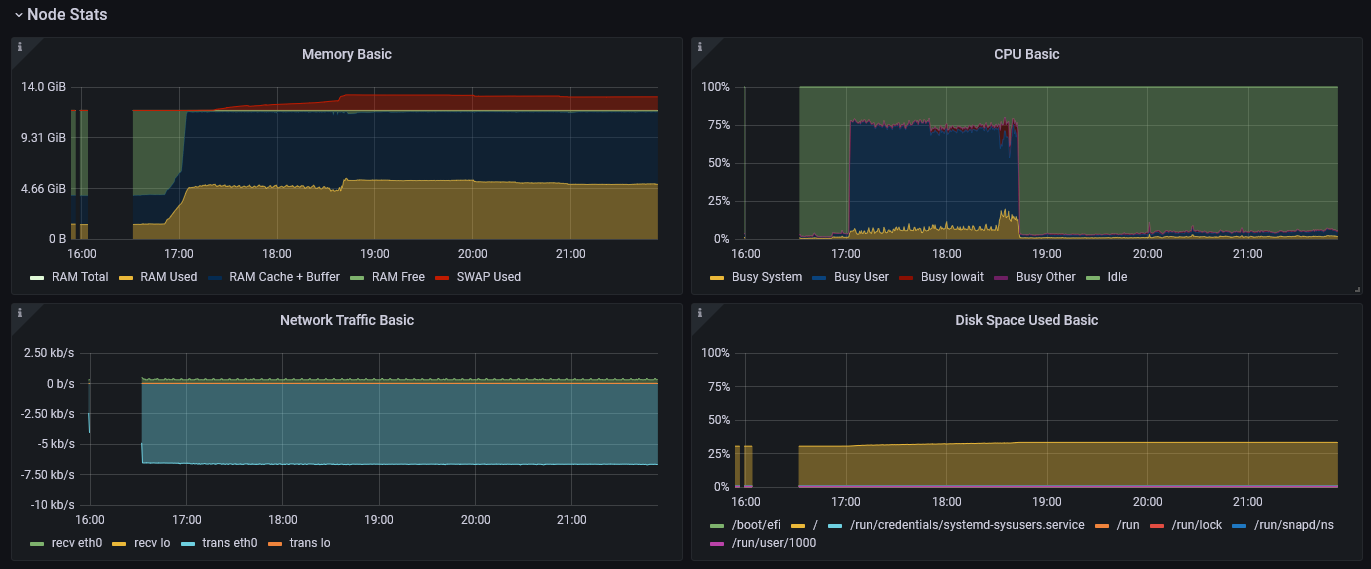
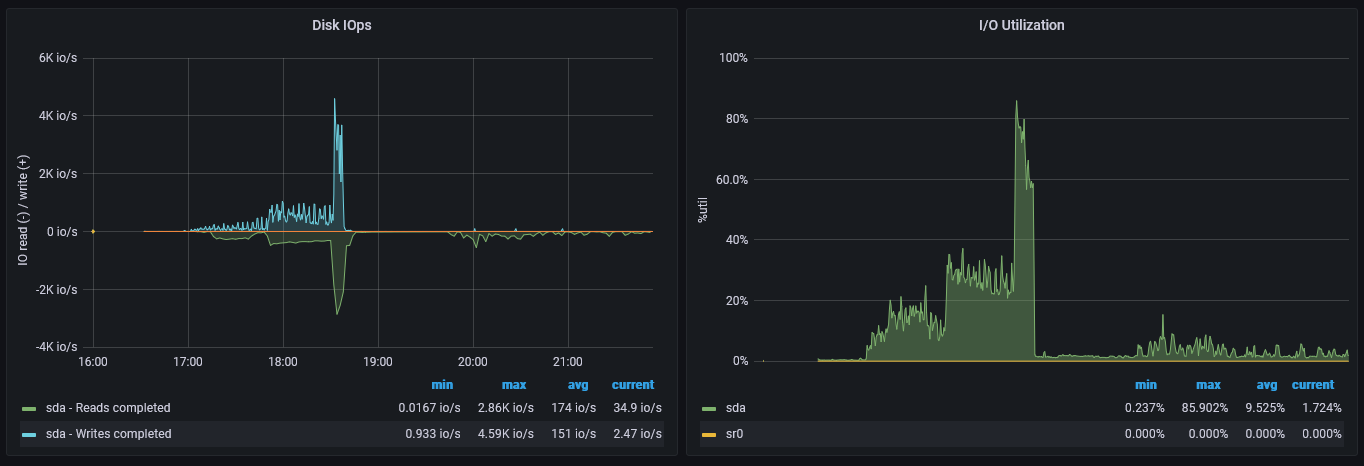
The main dashboard is split up into four sections:
An at-a-glance state of the how the host hardware is performing.
Metrics being exposed by the Prometheus interface on the Subspace Node. Credit goes to Alan Yoon#2149 on Discord for this section.
How are we doing with reaching the chainhead?
A closer look at some of the more relevant hardware metrics.
- To see what is going on with your containers you can issue the command
docker compose logs --tail=1000 --follow. Make sure you are in the same folder as yourdocker-compose.yml.
At the top of this readme there is a note that this simple configuration should only be used when the stack is being run on a machine which is already part of a secure network. This typically means a laptop or desktop PC which is in your home behind the same firewall that protects all of your home devices.
The reason for this is that Docker uses IP tables to setup its networks and will override certain software firewalls which may be running on your machine and results in ports being exposed to everyone on the internet. The main situation this would occur is where the Docker host is a server in a datacentre.
Additional security should be applied to harden the server so that only particular addresses (yours) should be able to access the Grafana port. A better alternative may be to setup a reverse proxy which gives finer control over access rules.
If you prefer to use bare metal rather than Docker solutions and would like to use this monitoring stack I would suggest you take a look at the subspace-utils repository on GitHub put together by jrwashburn#0765. We have collaborated so that you will end up with essentially the same solution but without the need for running Docker locally. It uses Grafana cloud and a Prometheus push so is more suited to a datacentre environment.
- Parameterised convenience script.
- Alerting.
- Explanation of host networking to mix bare metal and Docker components.
- Multi node support.
- Dashboard upload.
- Public playground.


