Pixie is an open source observability tool for Kubernetes applications. Use Pixie to view the high-level state of your cluster (service maps, cluster resources, application traffic) and also drill-down into more detailed views (pod state, flame graphs, individual full-body application requests).
Three features enable Pixie's magical developer experience:
-
Auto-telemetry: Pixie uses eBPF to automatically collect telemetry data such as full-body requests, resource and network metrics, application profiles, and more. See the full list of data sources here.
-
In-Cluster Edge Compute: Pixie collects, stores and queries all telemetry data locally in the cluster. Pixie uses less than 5% of cluster CPU, and in most cases less than 2%.
-
Scriptability: PxL, Pixie’s flexible Pythonic query language, can be used across Pixie’s UI, CLI, and client APIs.
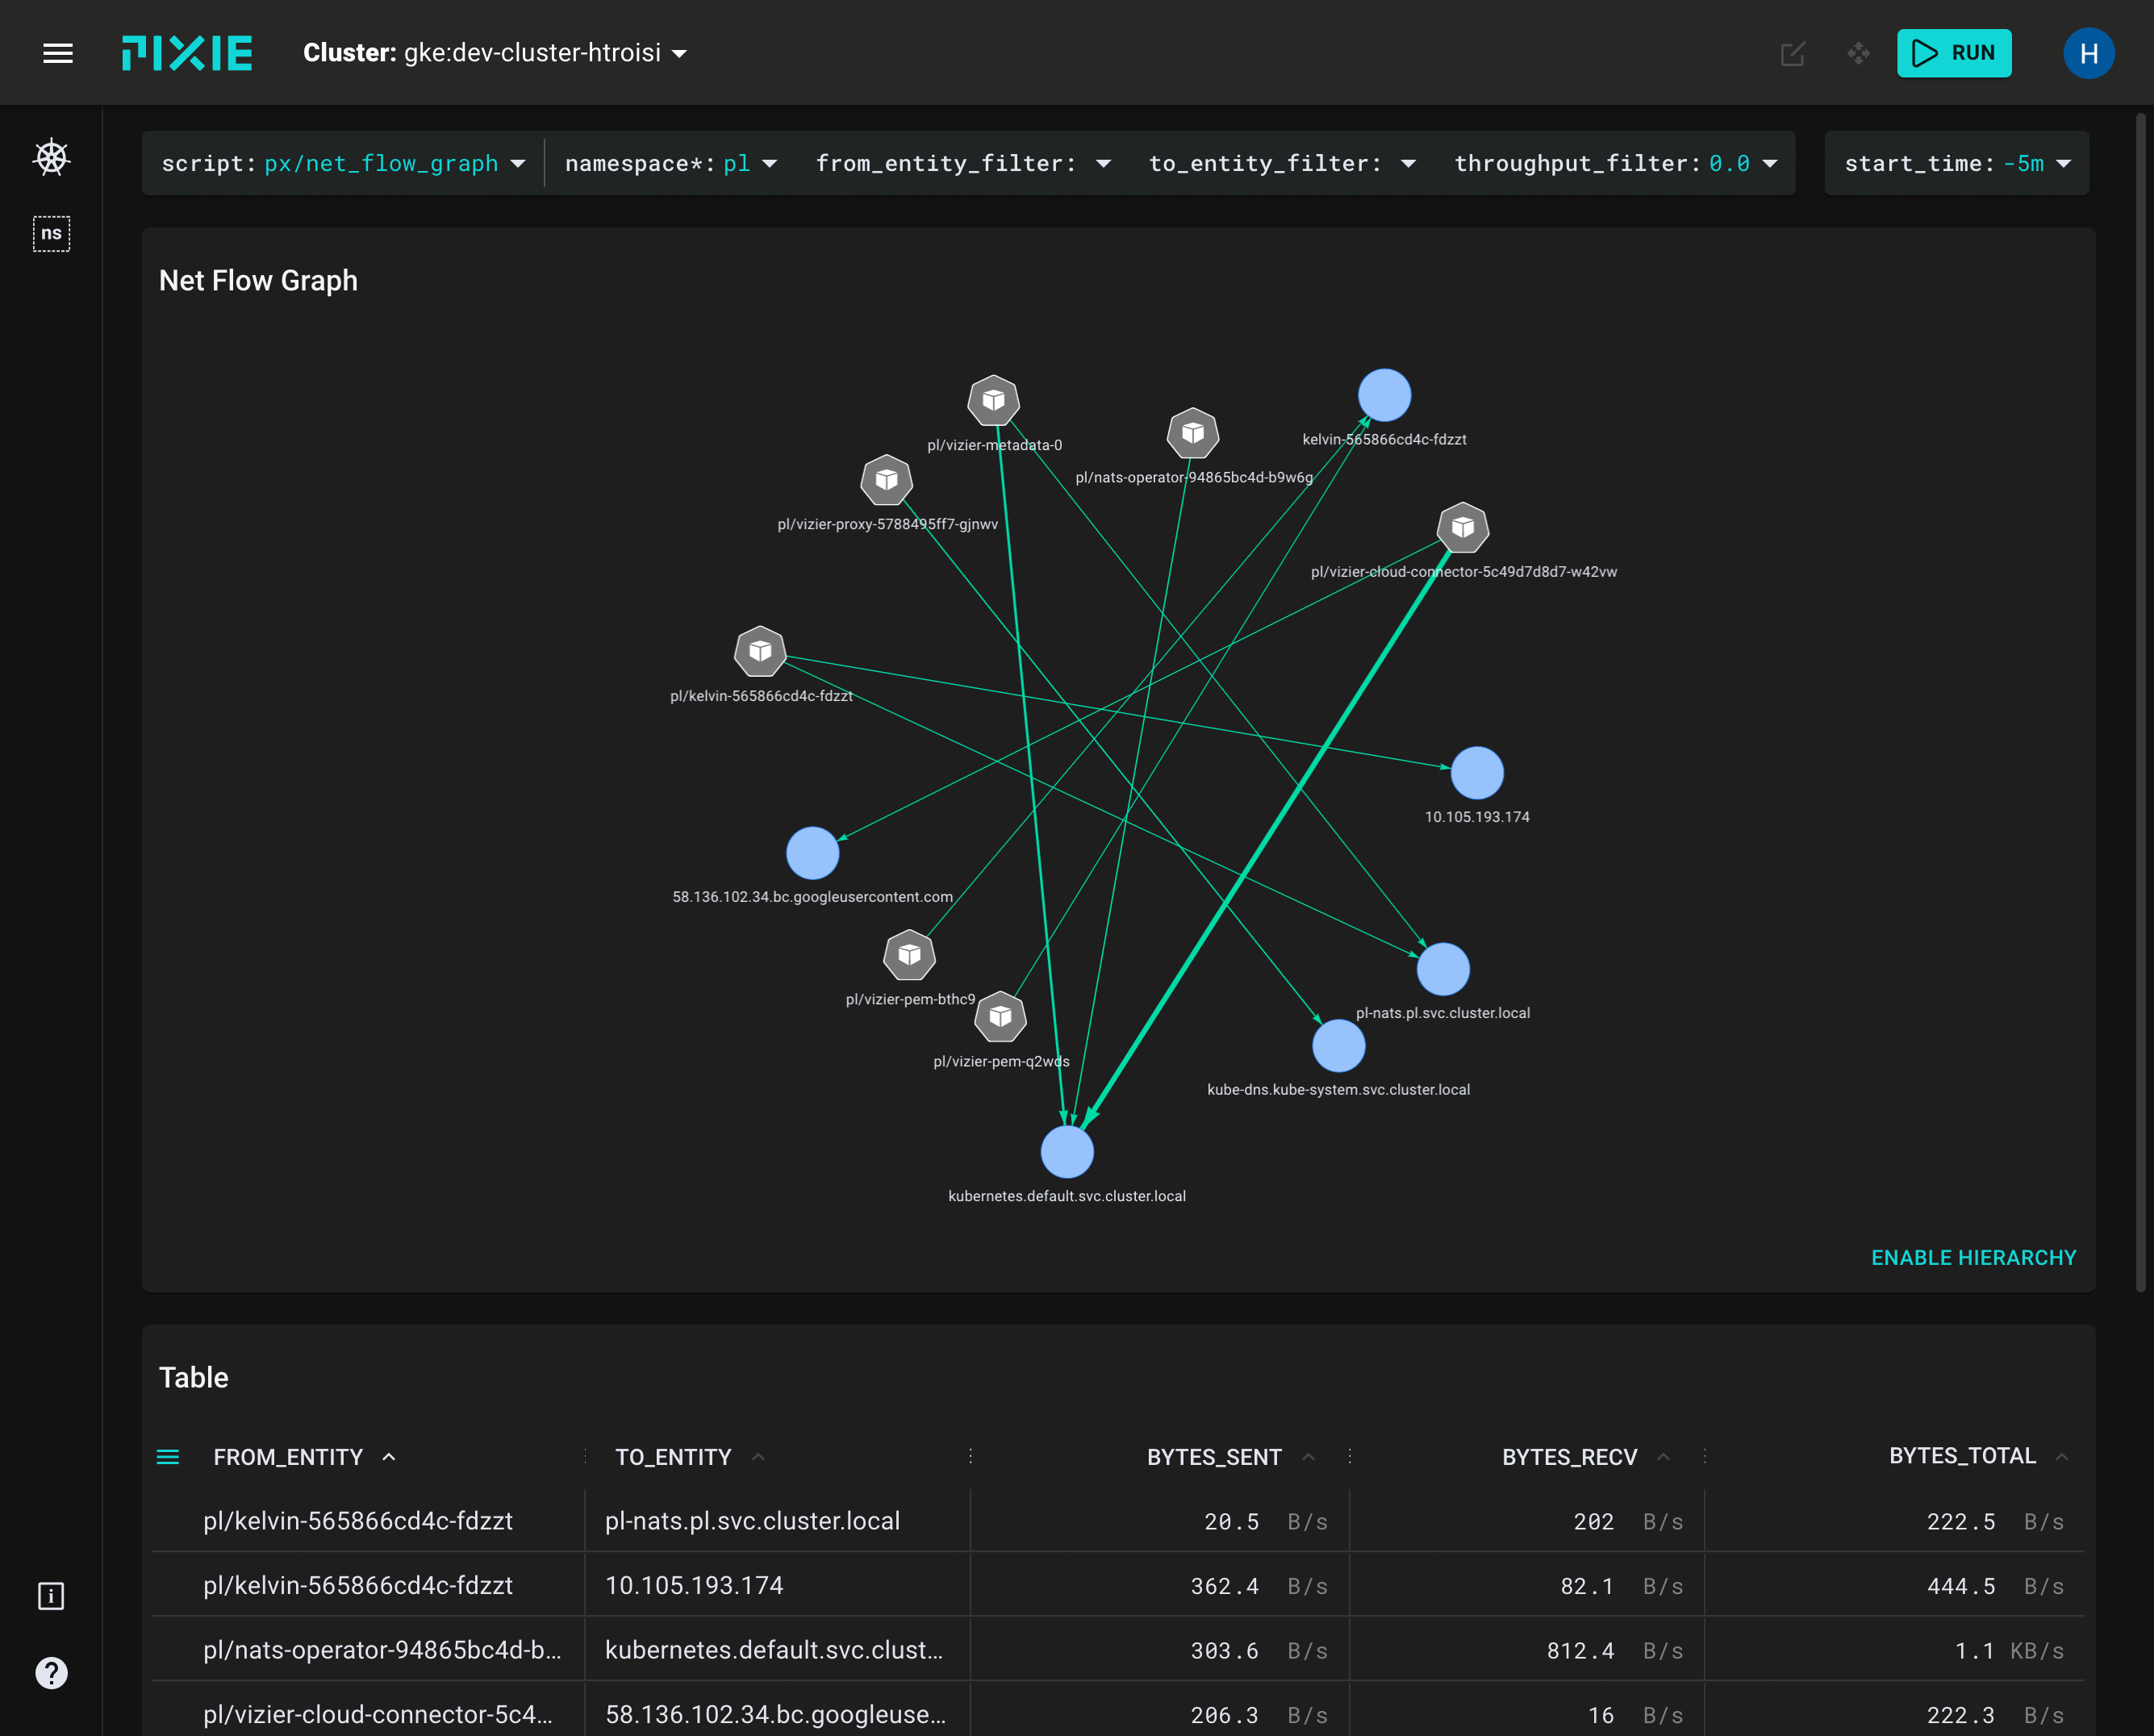
Use Pixie to monitor your network, including:
- The flow of network traffic within your cluster.
- The flow of DNS requests within your cluster.
- Individual full-body DNS requests and responses.
- A Map of TCP drops and TCP retransmits across your cluster.
For more details, check out the tutorial or watch an overview.
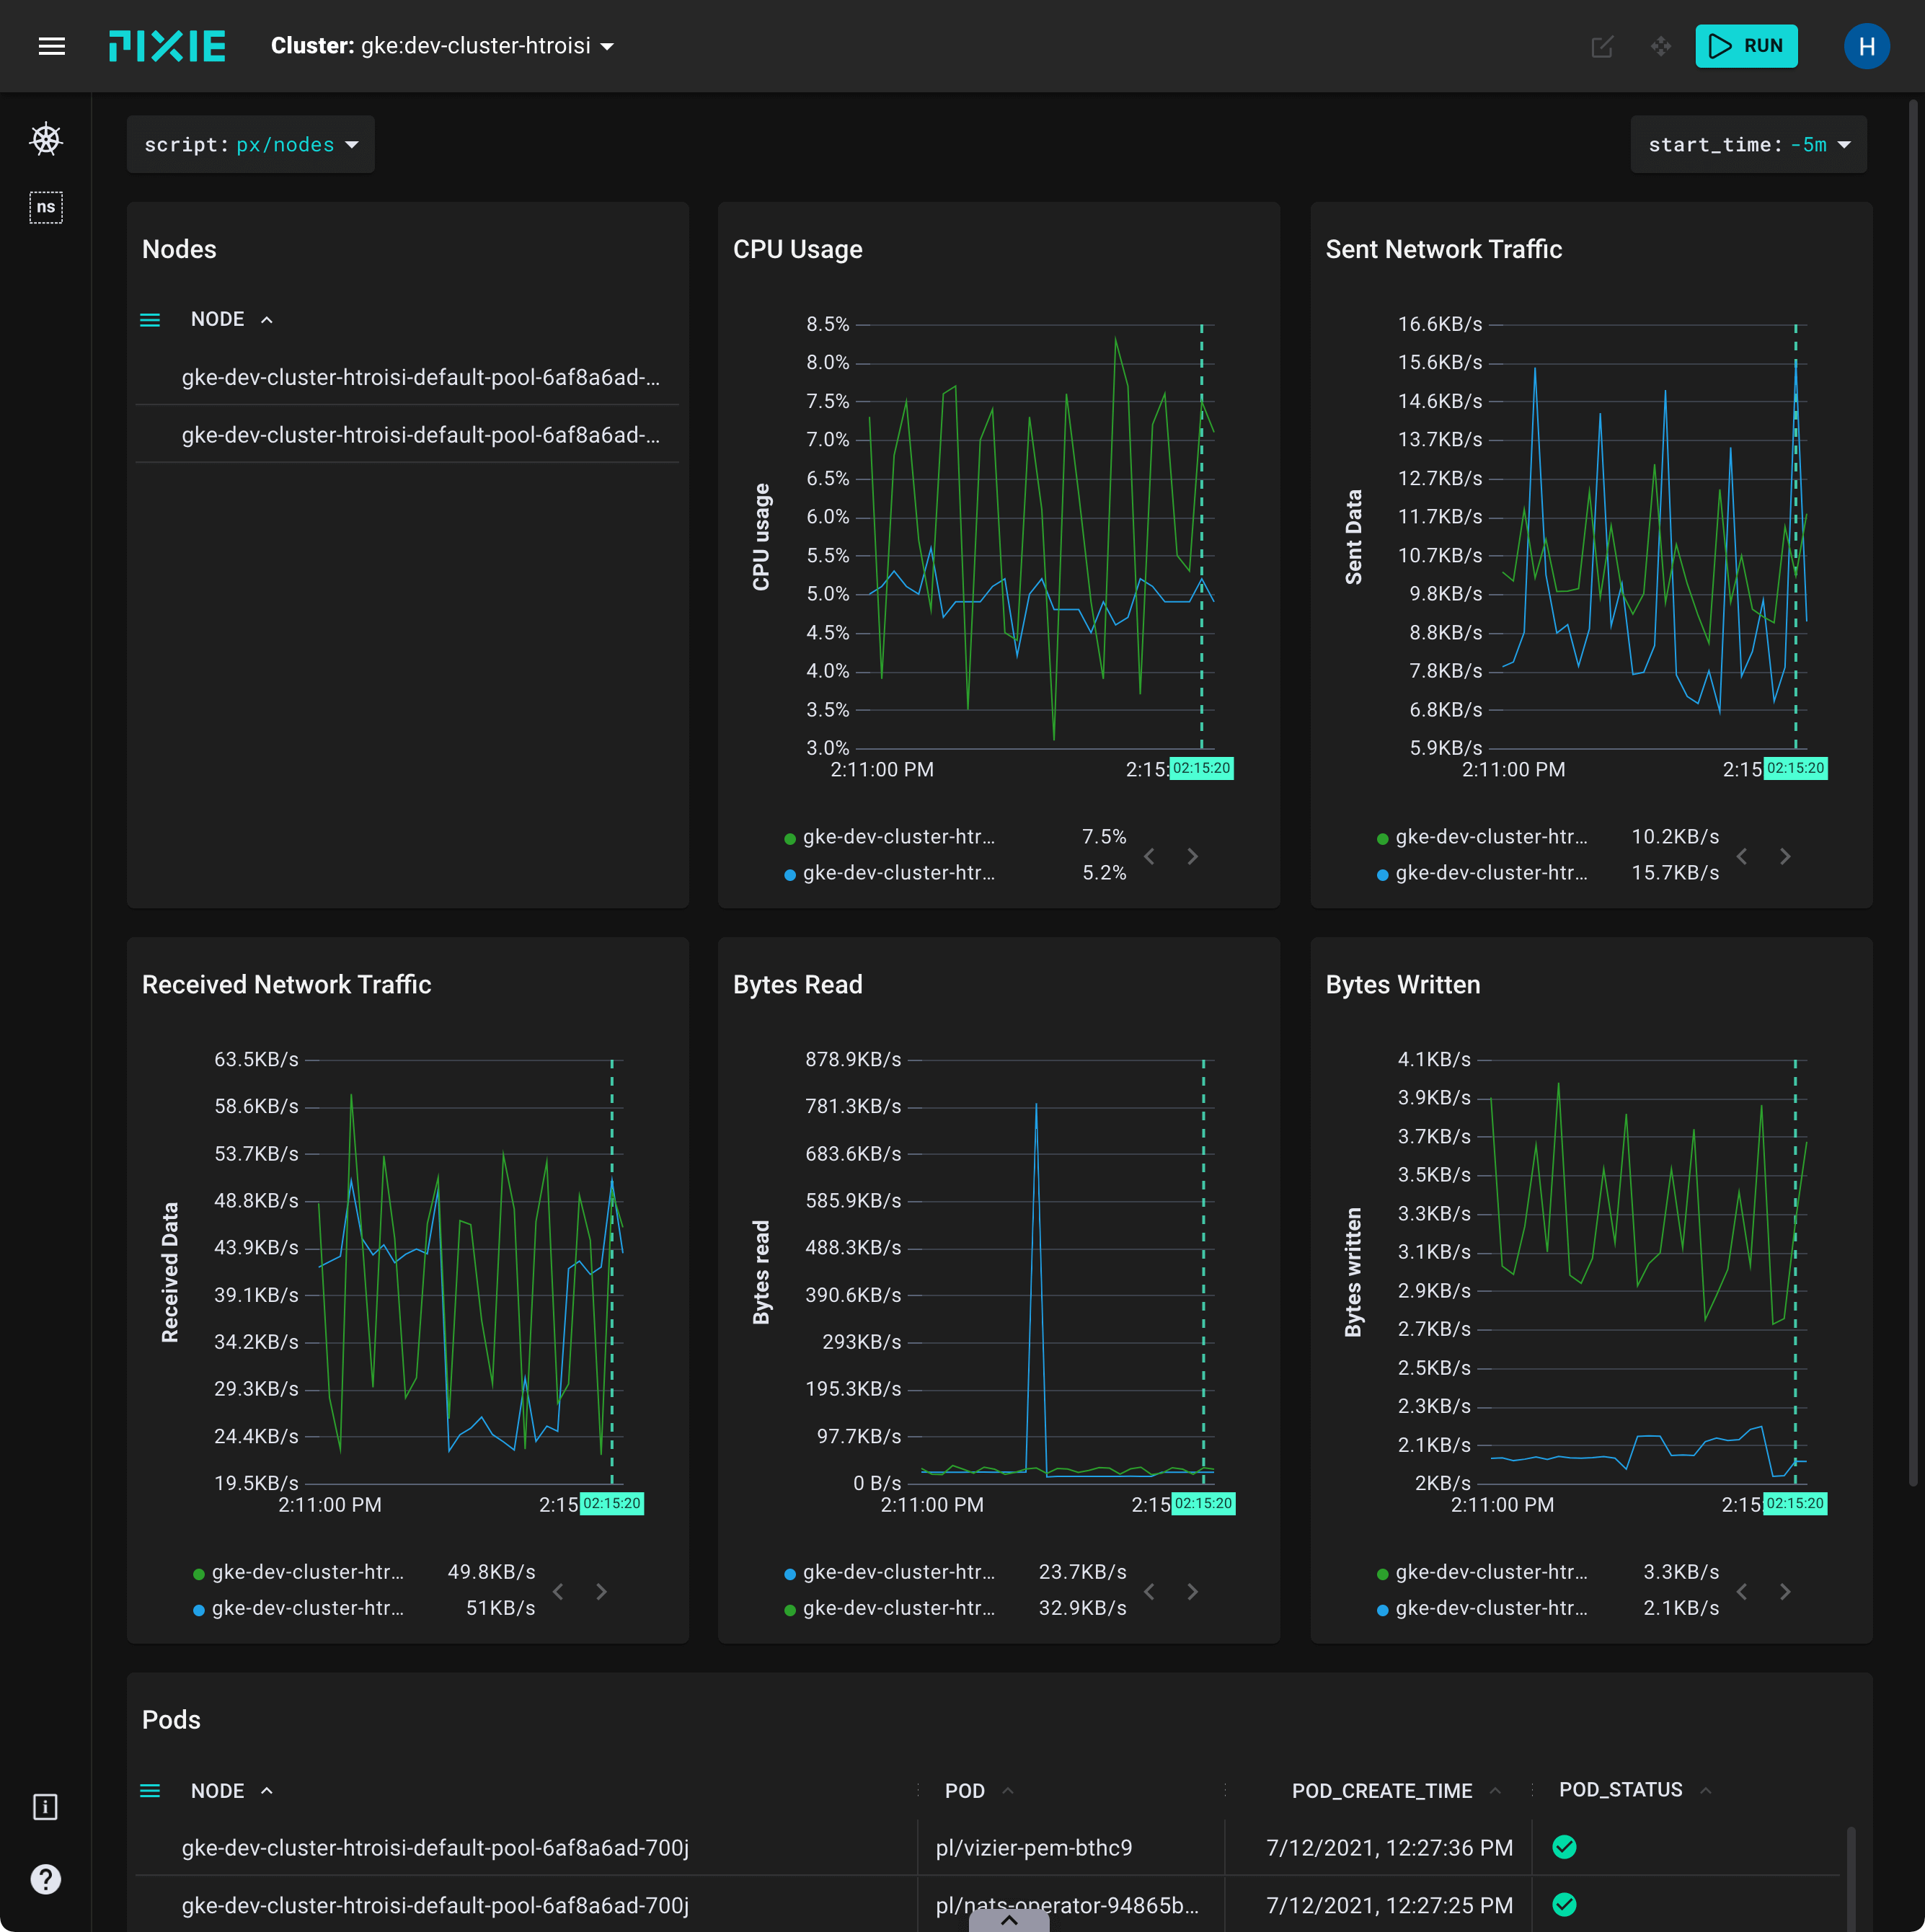
Monitor your infrastructure alongside your network and application layer, including:
- Resource usage by Pod, Node, Namespace.
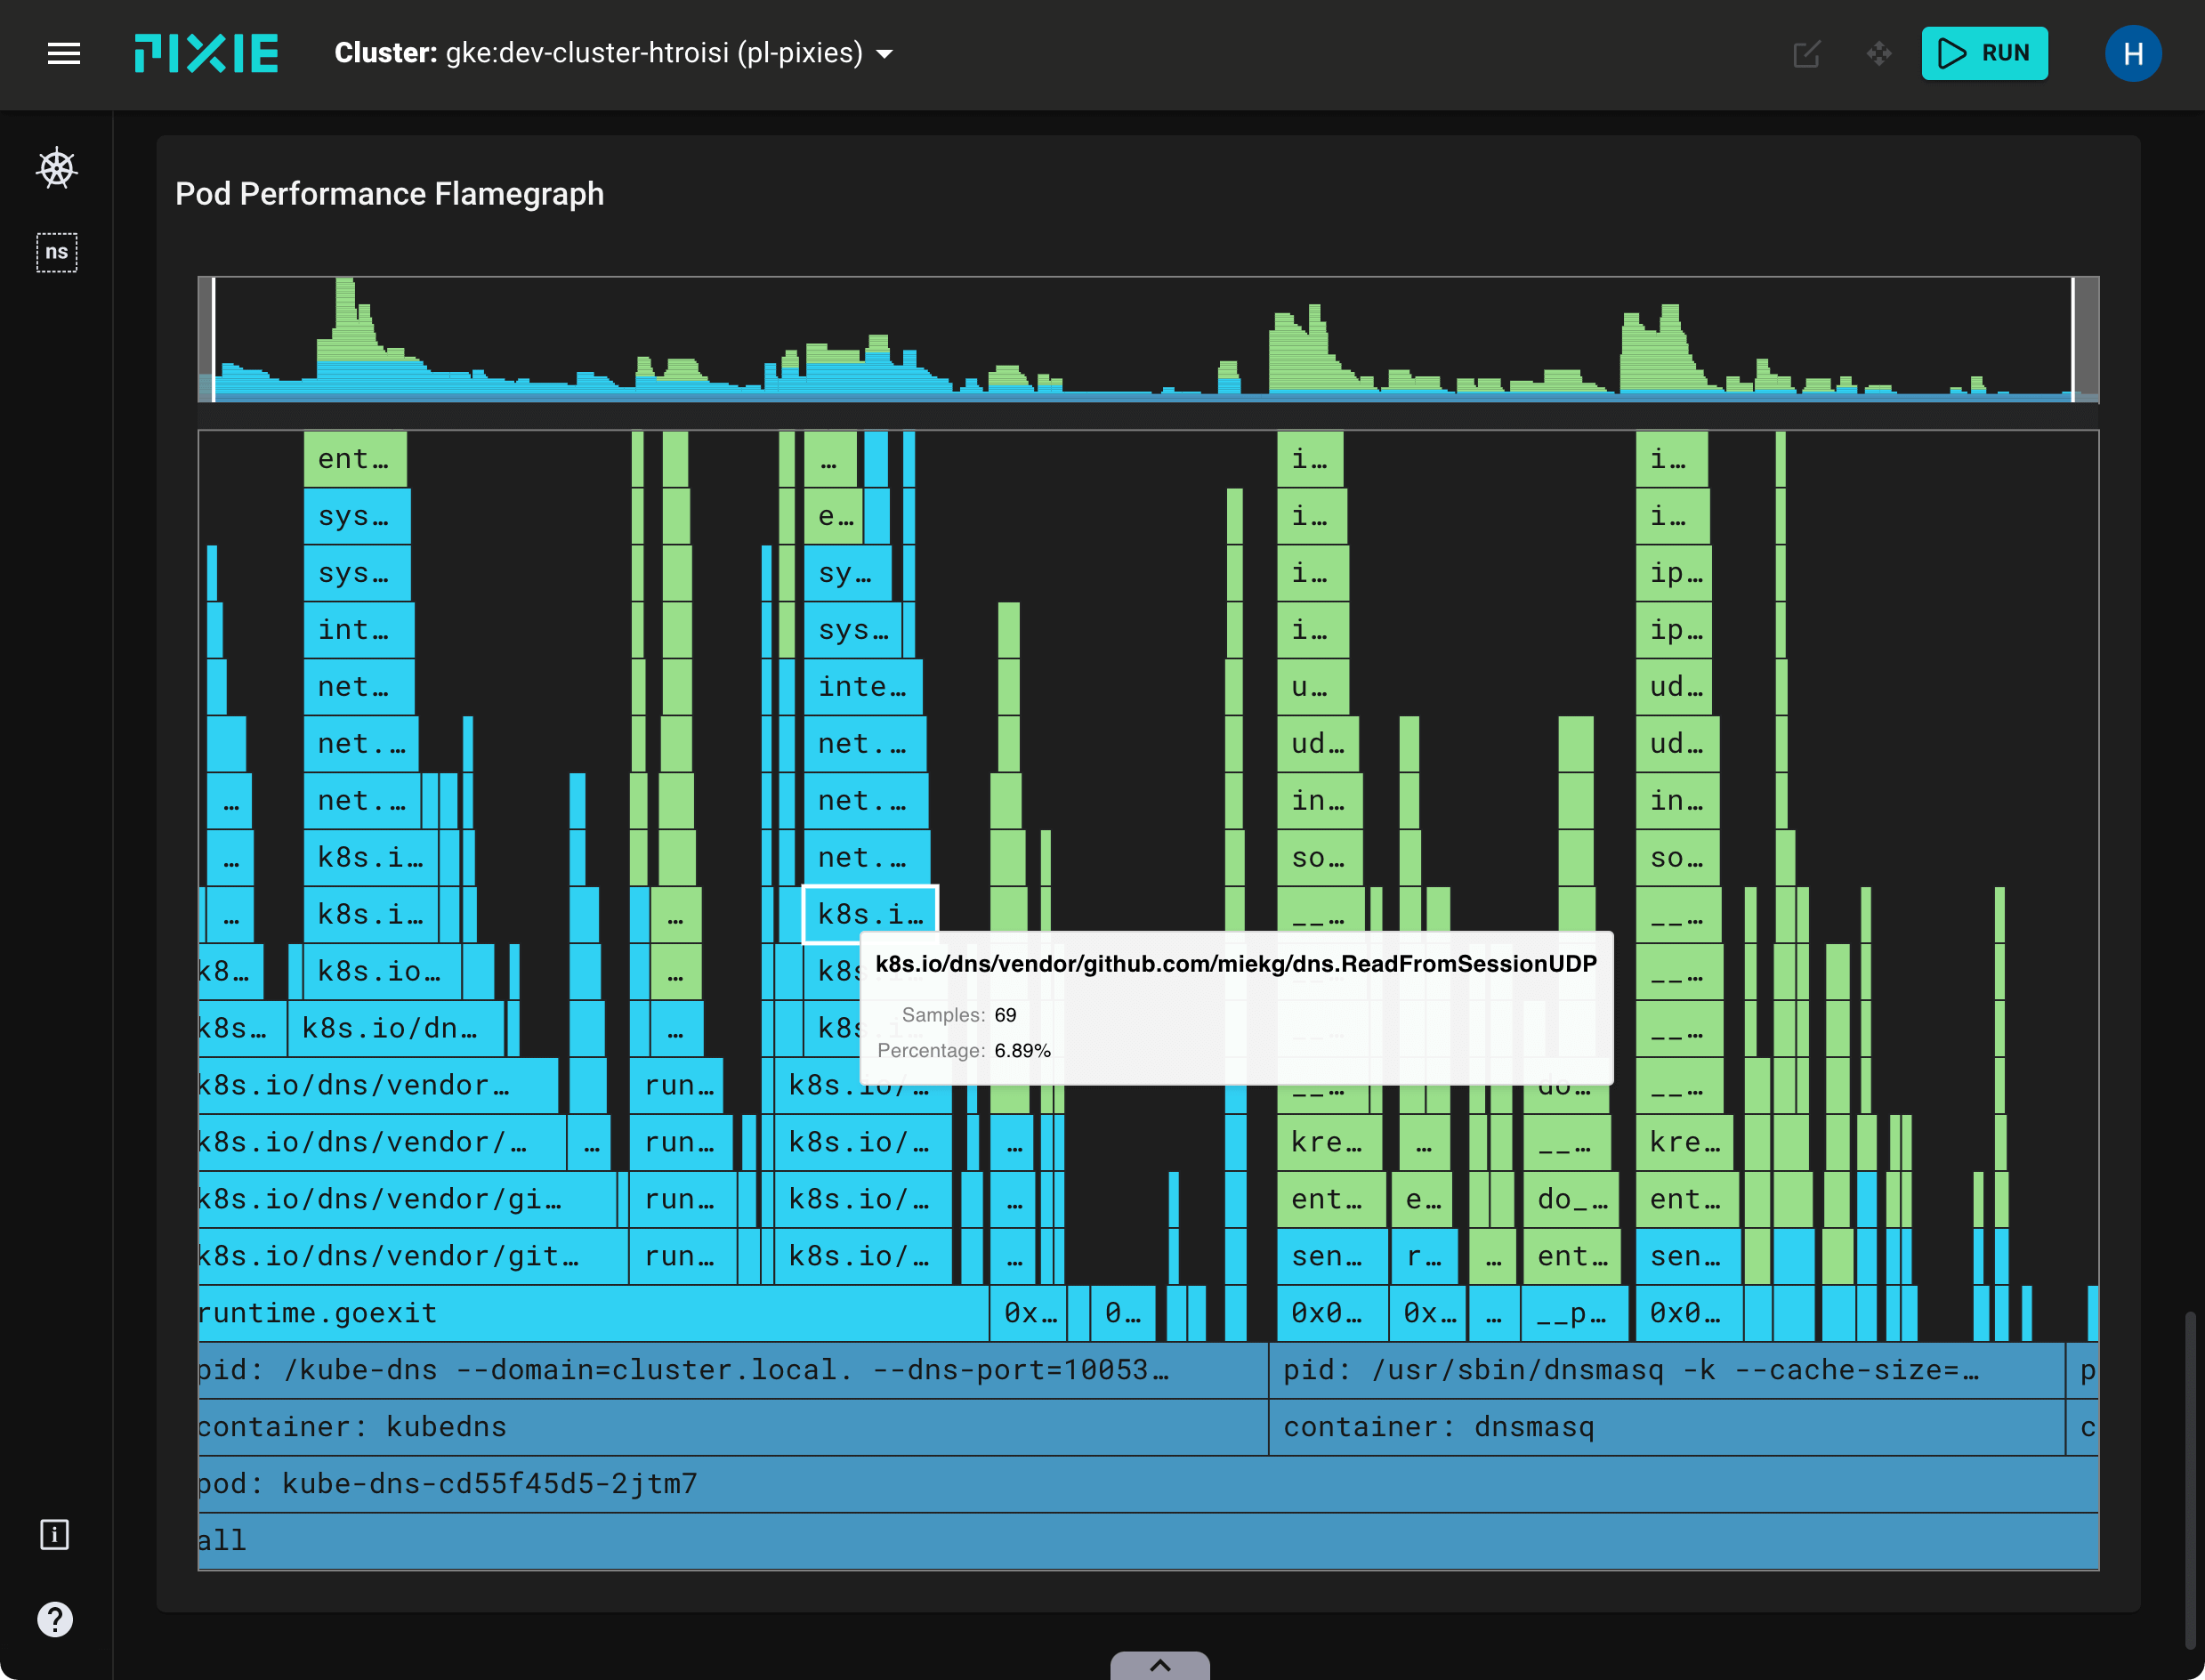
- CPU flamegraphs per Pod, Node.
For more details, check out the tutorial or watch an overview.
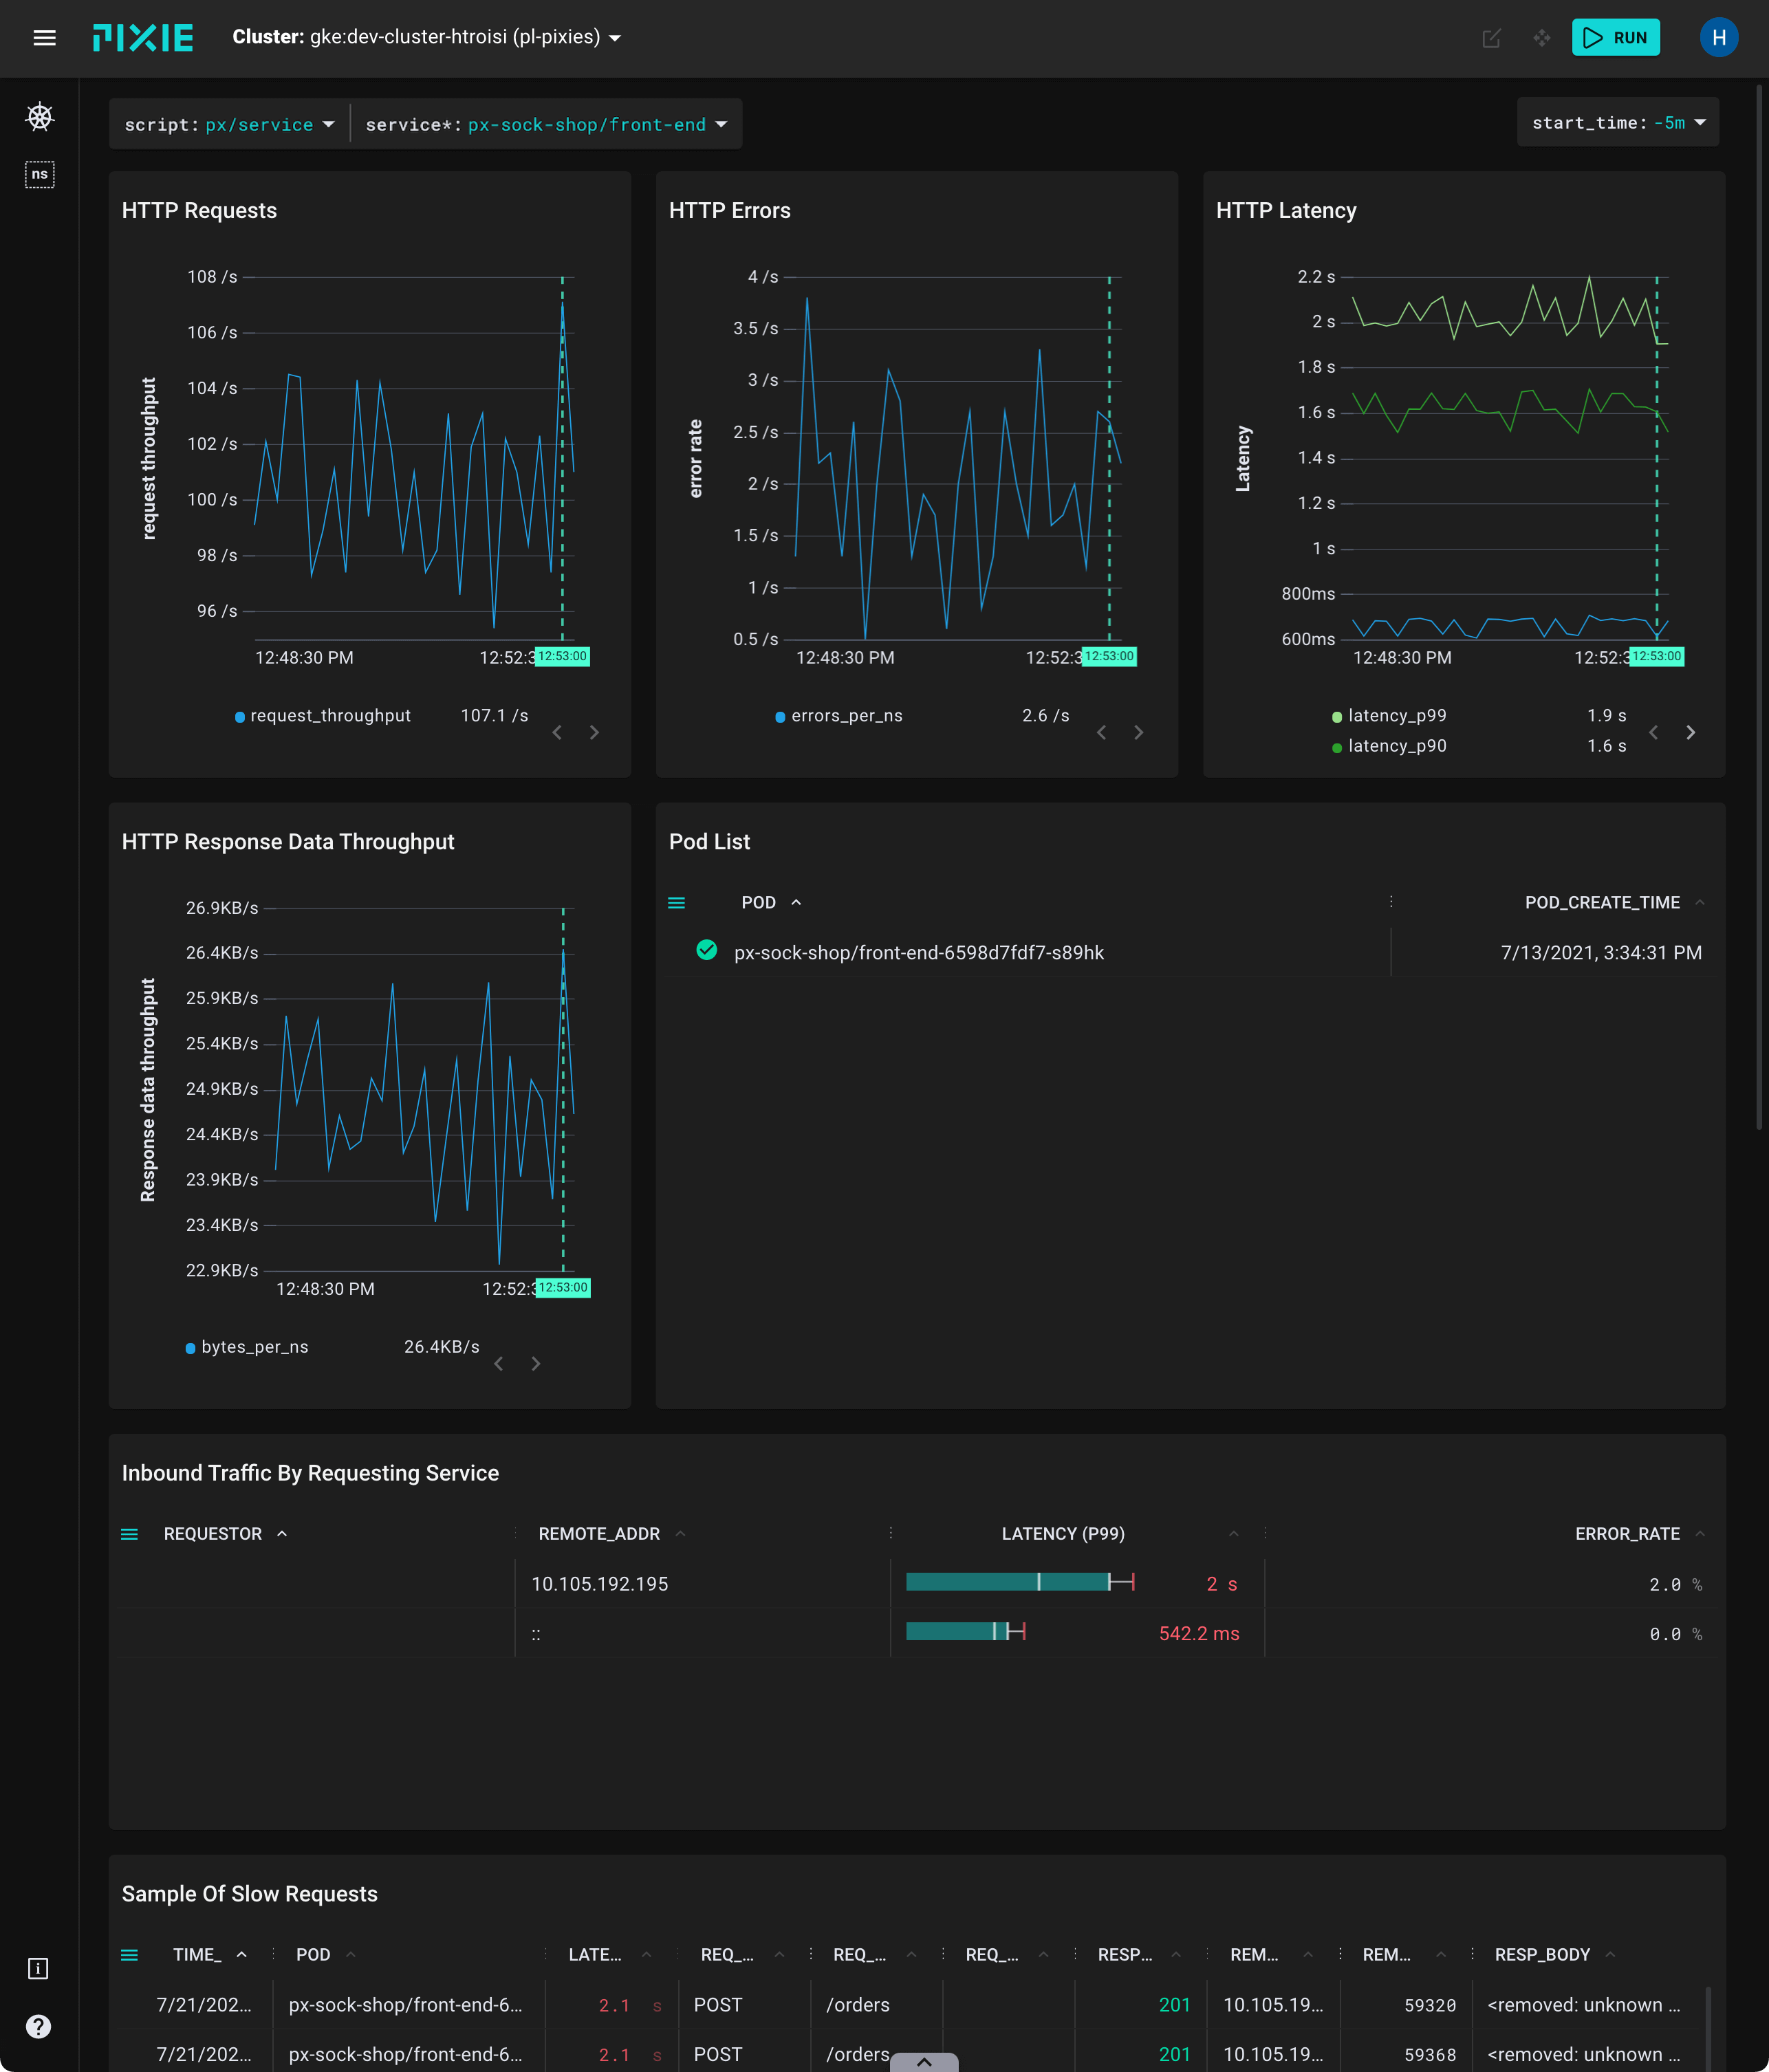
Pixie automatically traces a variety of protocols. Get immediate visibility into the health of your services, including:
- The flow of traffic between your services.
- Latency per service and endpoint.
- Sample of the slowest requests for an individual service.
For more details, check out the tutorial or watch an overview.
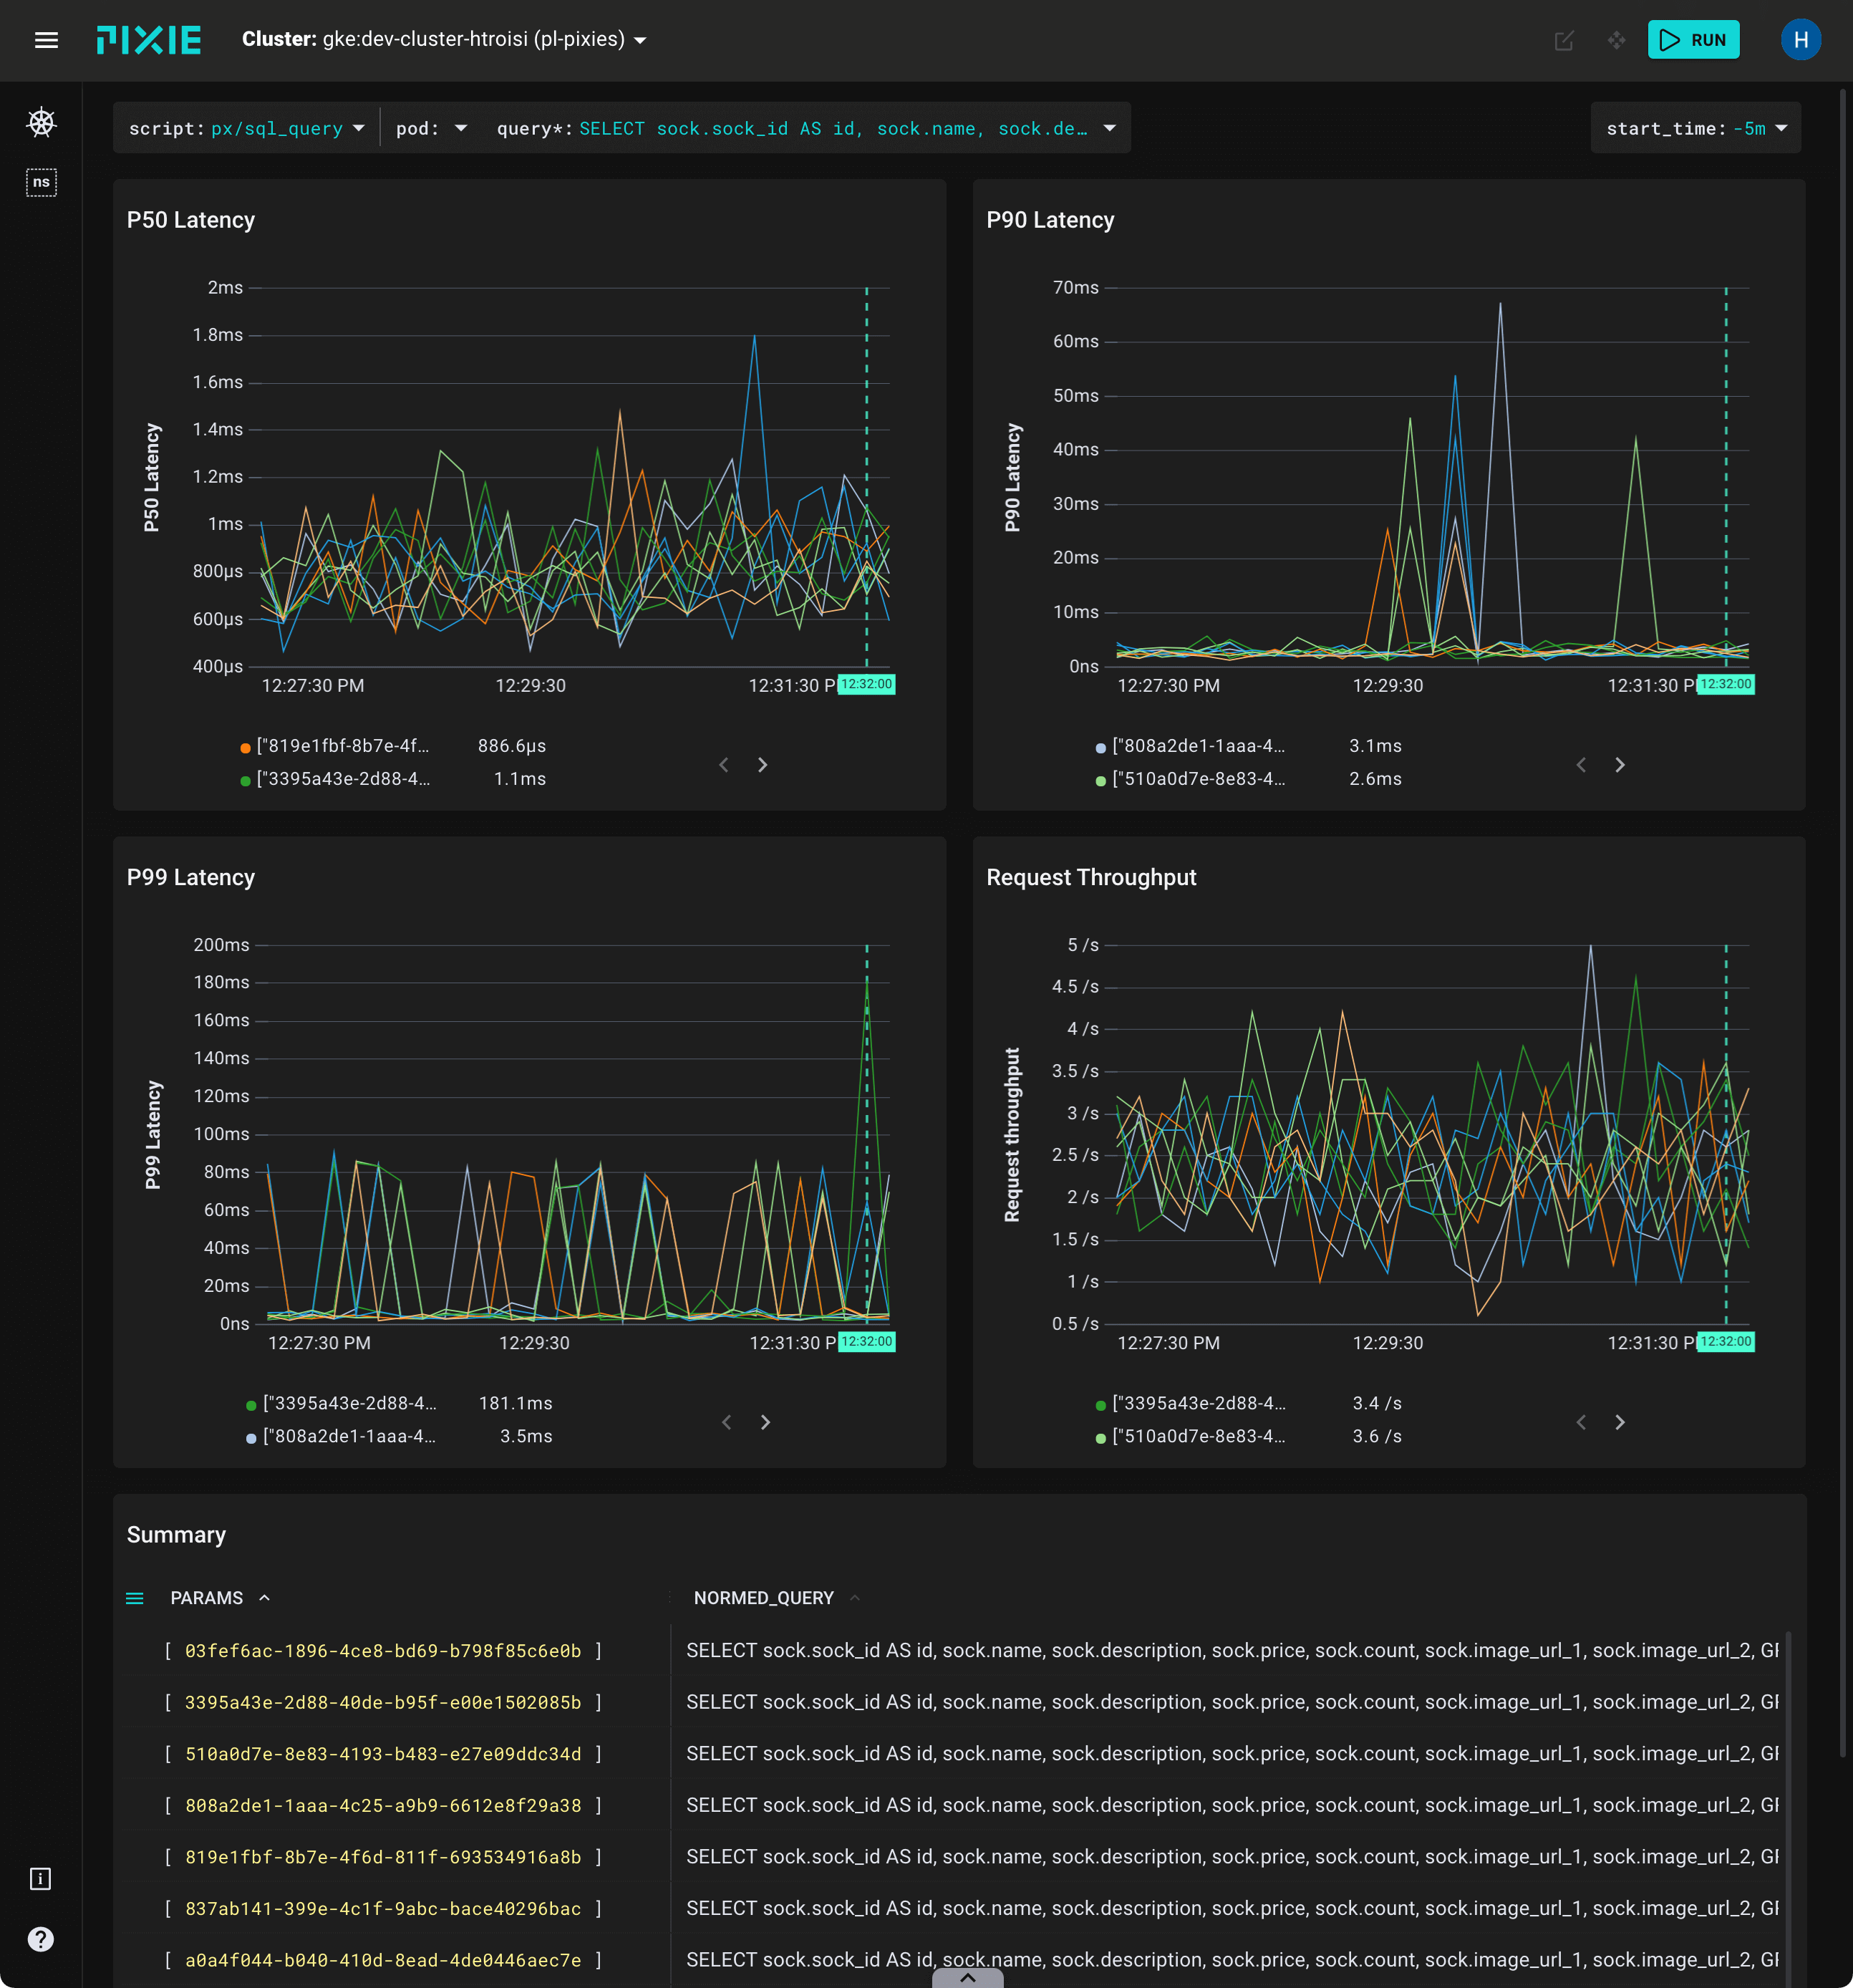
Pixie automatically traces a number of different database protocols. Use Pixie to monitor the performance of your database requests:
- Latency, error and throughput (LET) rate for all pods.
- LET rate per normalized query.
- Latency per individual full body query.
- Individual full-body requests and responses.
For more details, check out the tutorial or watch an overview.
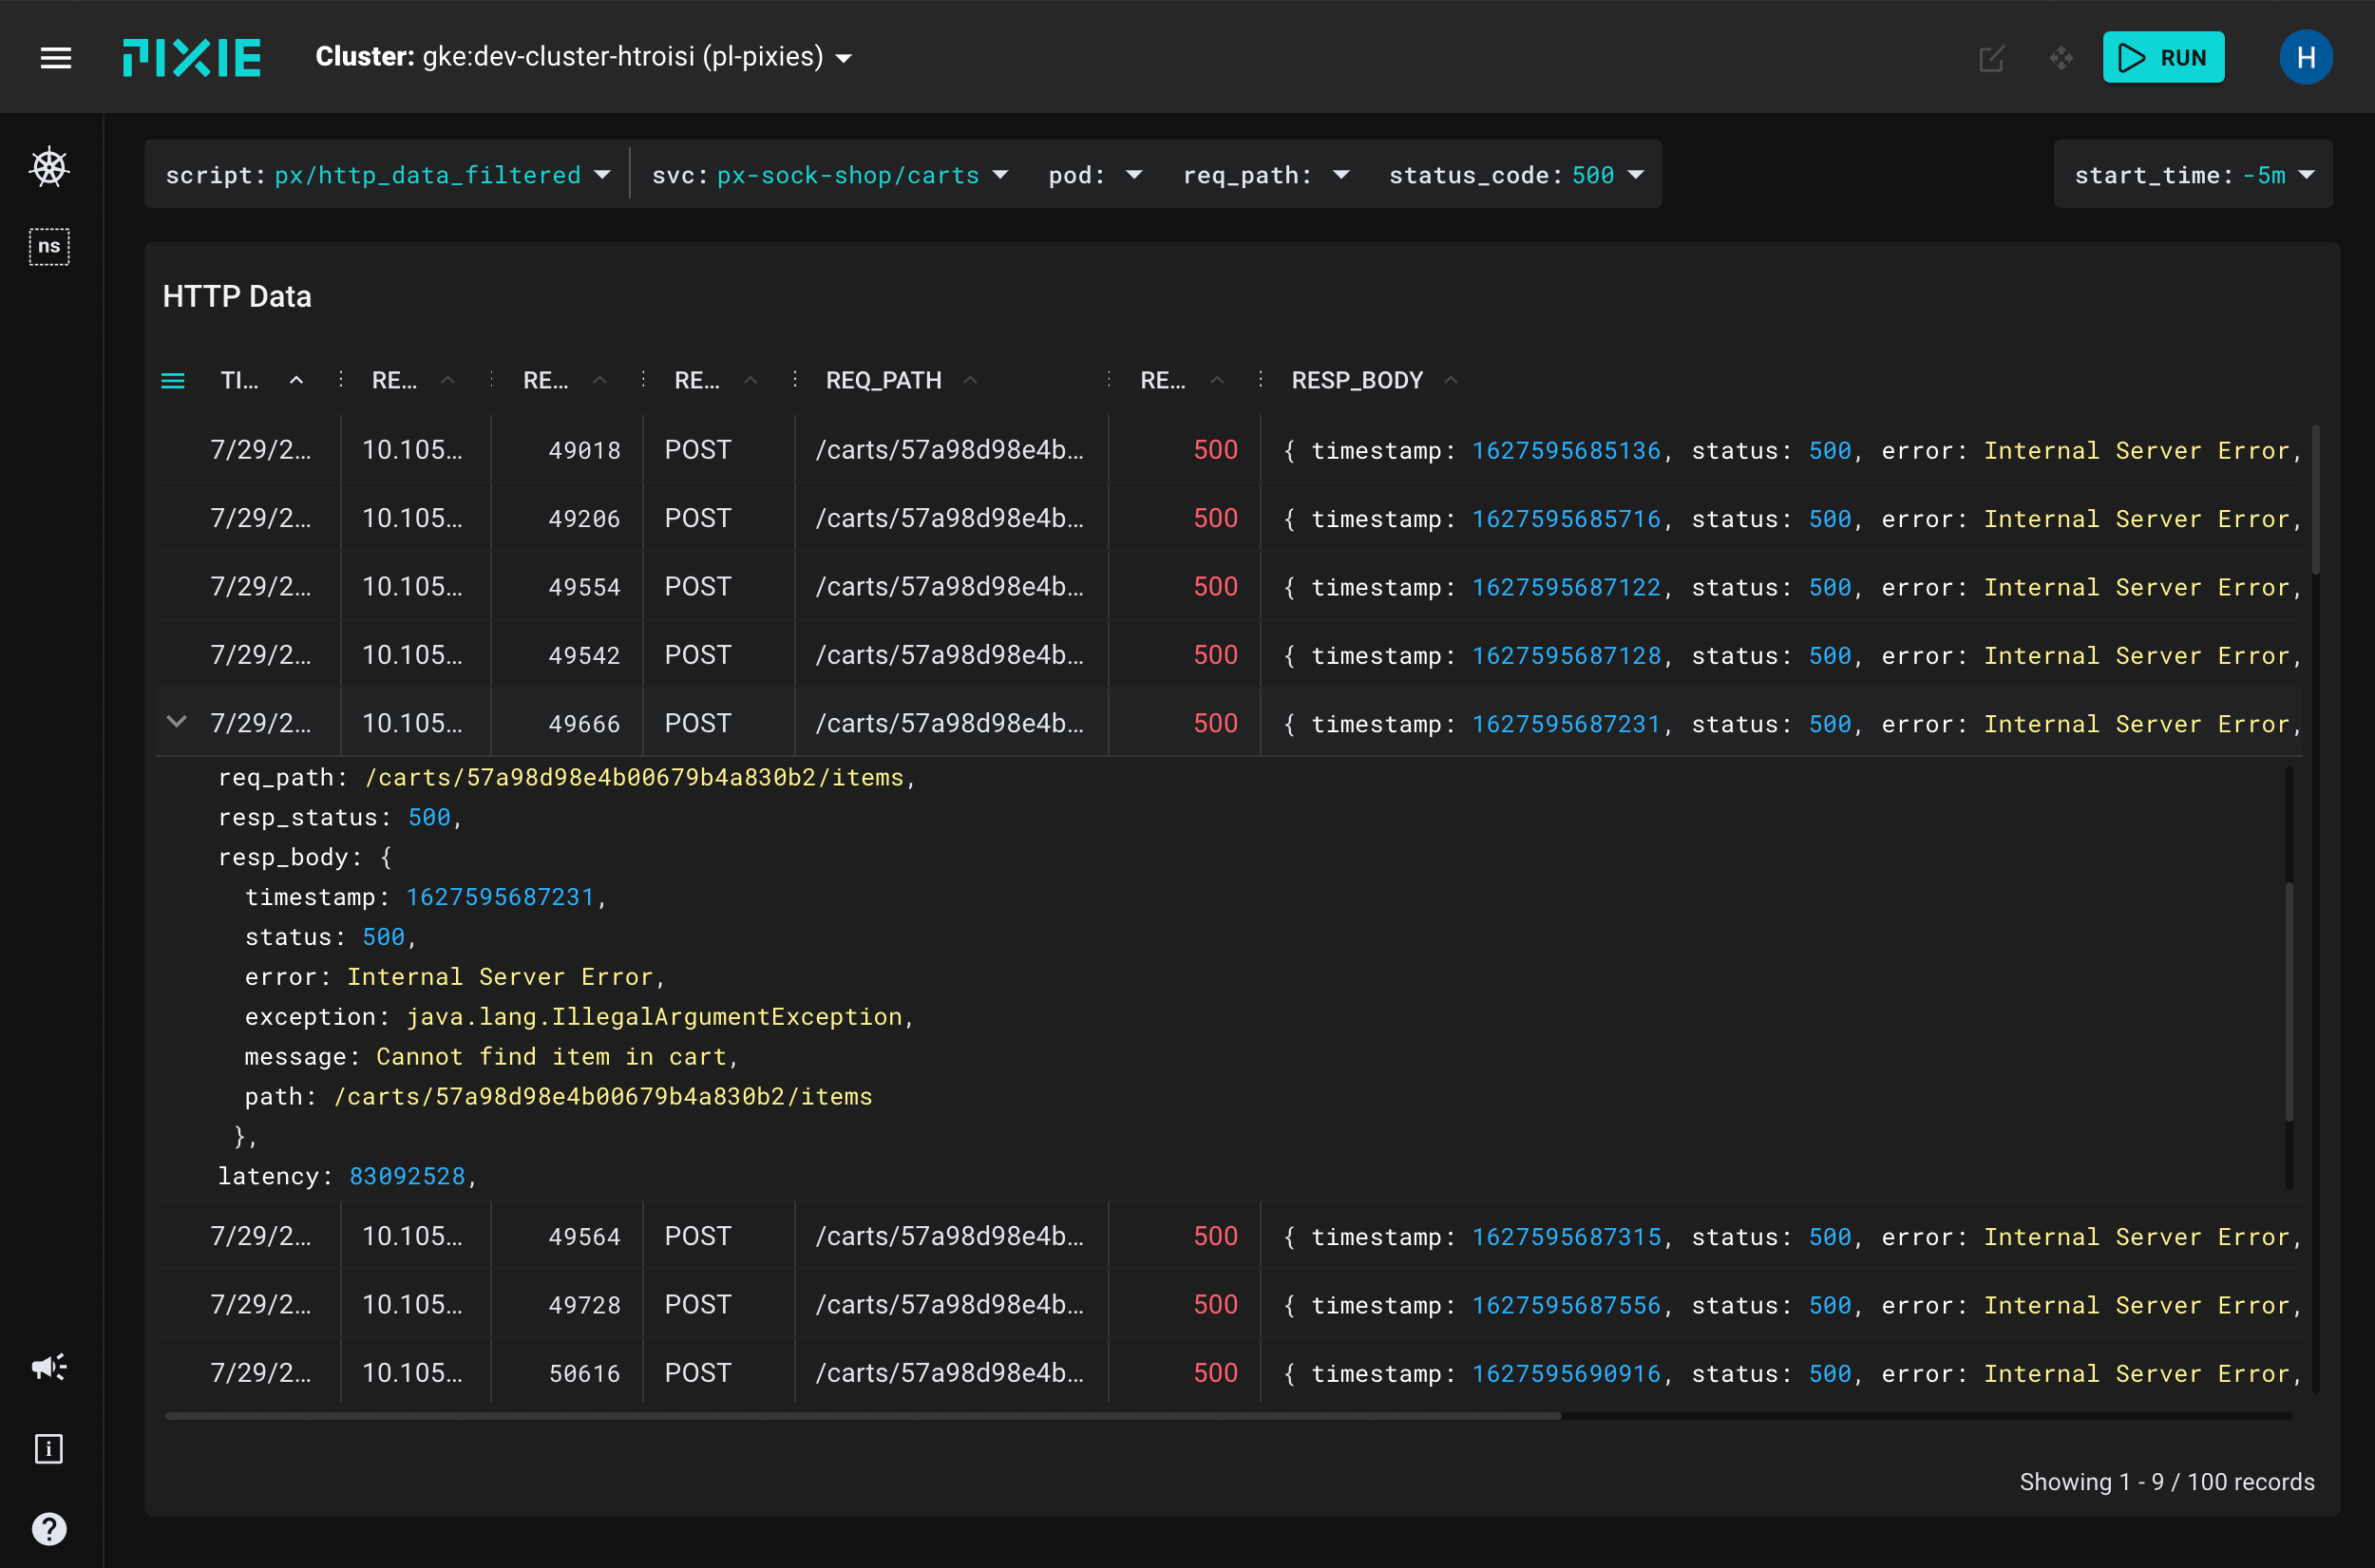
Pixie makes debugging this communication between microservices easy by providing immediate and deep (full-body) visibility into requests flowing through your cluster. See:
- Full-body requests and response for supported protocols.
- Error rate per Service, Pod.
For more details, check out the tutorial or watch an overview.
Use Pixie's continuous profiling feature to identify performance issues within application code.
For more details, check out the tutorial or watch an overview.
Use Pixie to deploy a bpftrace program to all of the nodes in your cluster. After deploying the program, Pixie captures the output into a table and makes the data available to be queried and visualized int he Pixie UI. TCP Drops pictured. For more details, check out the tutorial or watch an overview.
Debug Go binaries deployed in production environments without needing to recompile and redeploy. For more details, check out the tutorial or watch an overview.
It takes just a few minutes to install Pixie. To get started, check out the Install Guides.
Once installed, you can interact with Pixie using the:
Pixie is a community driven project; we welcome your contribution! For code contributions, please read our contribution guide.
- File a GitHub issue to report a bug or request a feature.
- Join our Slack for live conversations and quick questions.
- Follow us on Twitter and YouTube.
- Join our monthly community meetings.
- Provide feedback on our roadmap.
Pixie was contributed by New Relic, Inc. to the Cloud Native Computing Foundation as a Sandbox project in June 2021.
Pixie is licensed under Apache License, Version 2.0.


