G6: A Graph Visualization Framework in JavaScript.
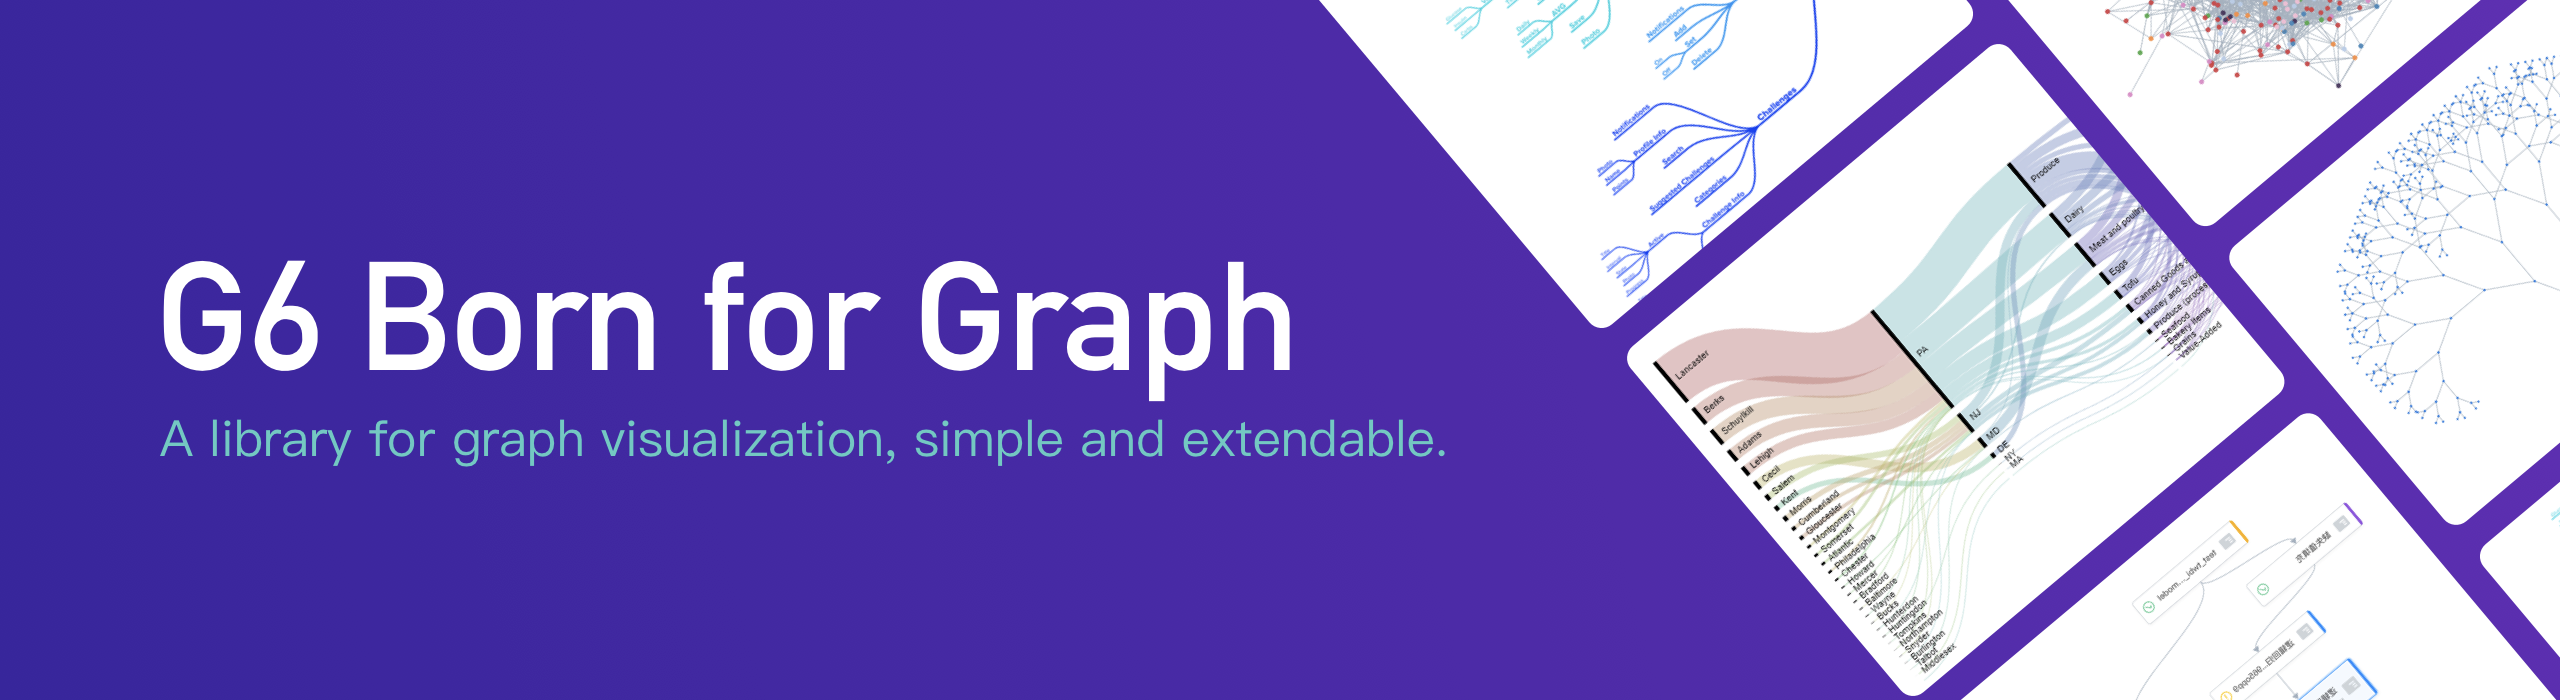


G6 is a graph visualization framework which provides a set of basic mechanisms. Developers are able to build graph visualization analysis application or graph visualization modeling application easily.
notice: G6 3.0 version is now beta testing which brings many breaking changes and new features. For more information please check 3.0 documentation.
See also 2.x Full documentation


G6-Editor


Installation
$ npm install @antv/g6
Usage
import G6 from '@antv/g6';

const data = {
  nodes: [{
    id: 'node1',
    x: 100,
    y: 200
  },{
    id: 'node2',
    x: 300,
    y: 200
  }],
  edges: [{
    target: 'node2',
    source: 'node1'
  }]
};
const graph = new G6.Graph({
  container: 'mountNode',
  width: 500,
  height: 500
});
graph.read(data);
Development
$ npm install

# run test case
$ npm run test-live

# build watching file changes and run demos
$ npm run dev
How to Contribute
Please let us know how can we help. Do check out issues for bug reports or suggestions first.
To become a contributor, please follow our contributing guide.
Experience Improvement
To better serve the users, G6 sends URL and version infomation back to AntV server: https://kcart.alipay.com/web/bi.do We will never collect other information. If you are worried about that, close it by:
G6.track(false);