Visualising transport energy use: from area to route network levels
Introduction
Passenger transport was — before the physical distancing measures and movement restrictions introduced in response to the Covid-19 Pandemic (e.g. Wilder-Smith and Freedman 2020; Mitjà et al. 2020; Jarvis et al. 2020) — a major, rapidly growing and particularly difficult-to-mitigate source of energy use and emissions (Gül et al. 2009; Moriarty and Honnery 2016; Gota et al. 2019). Notwithstanding the potential for societal transformation it is possible, if not likely, that passenger transport energy use will continue its upward trajectory when restrictions on movement are relaxed.
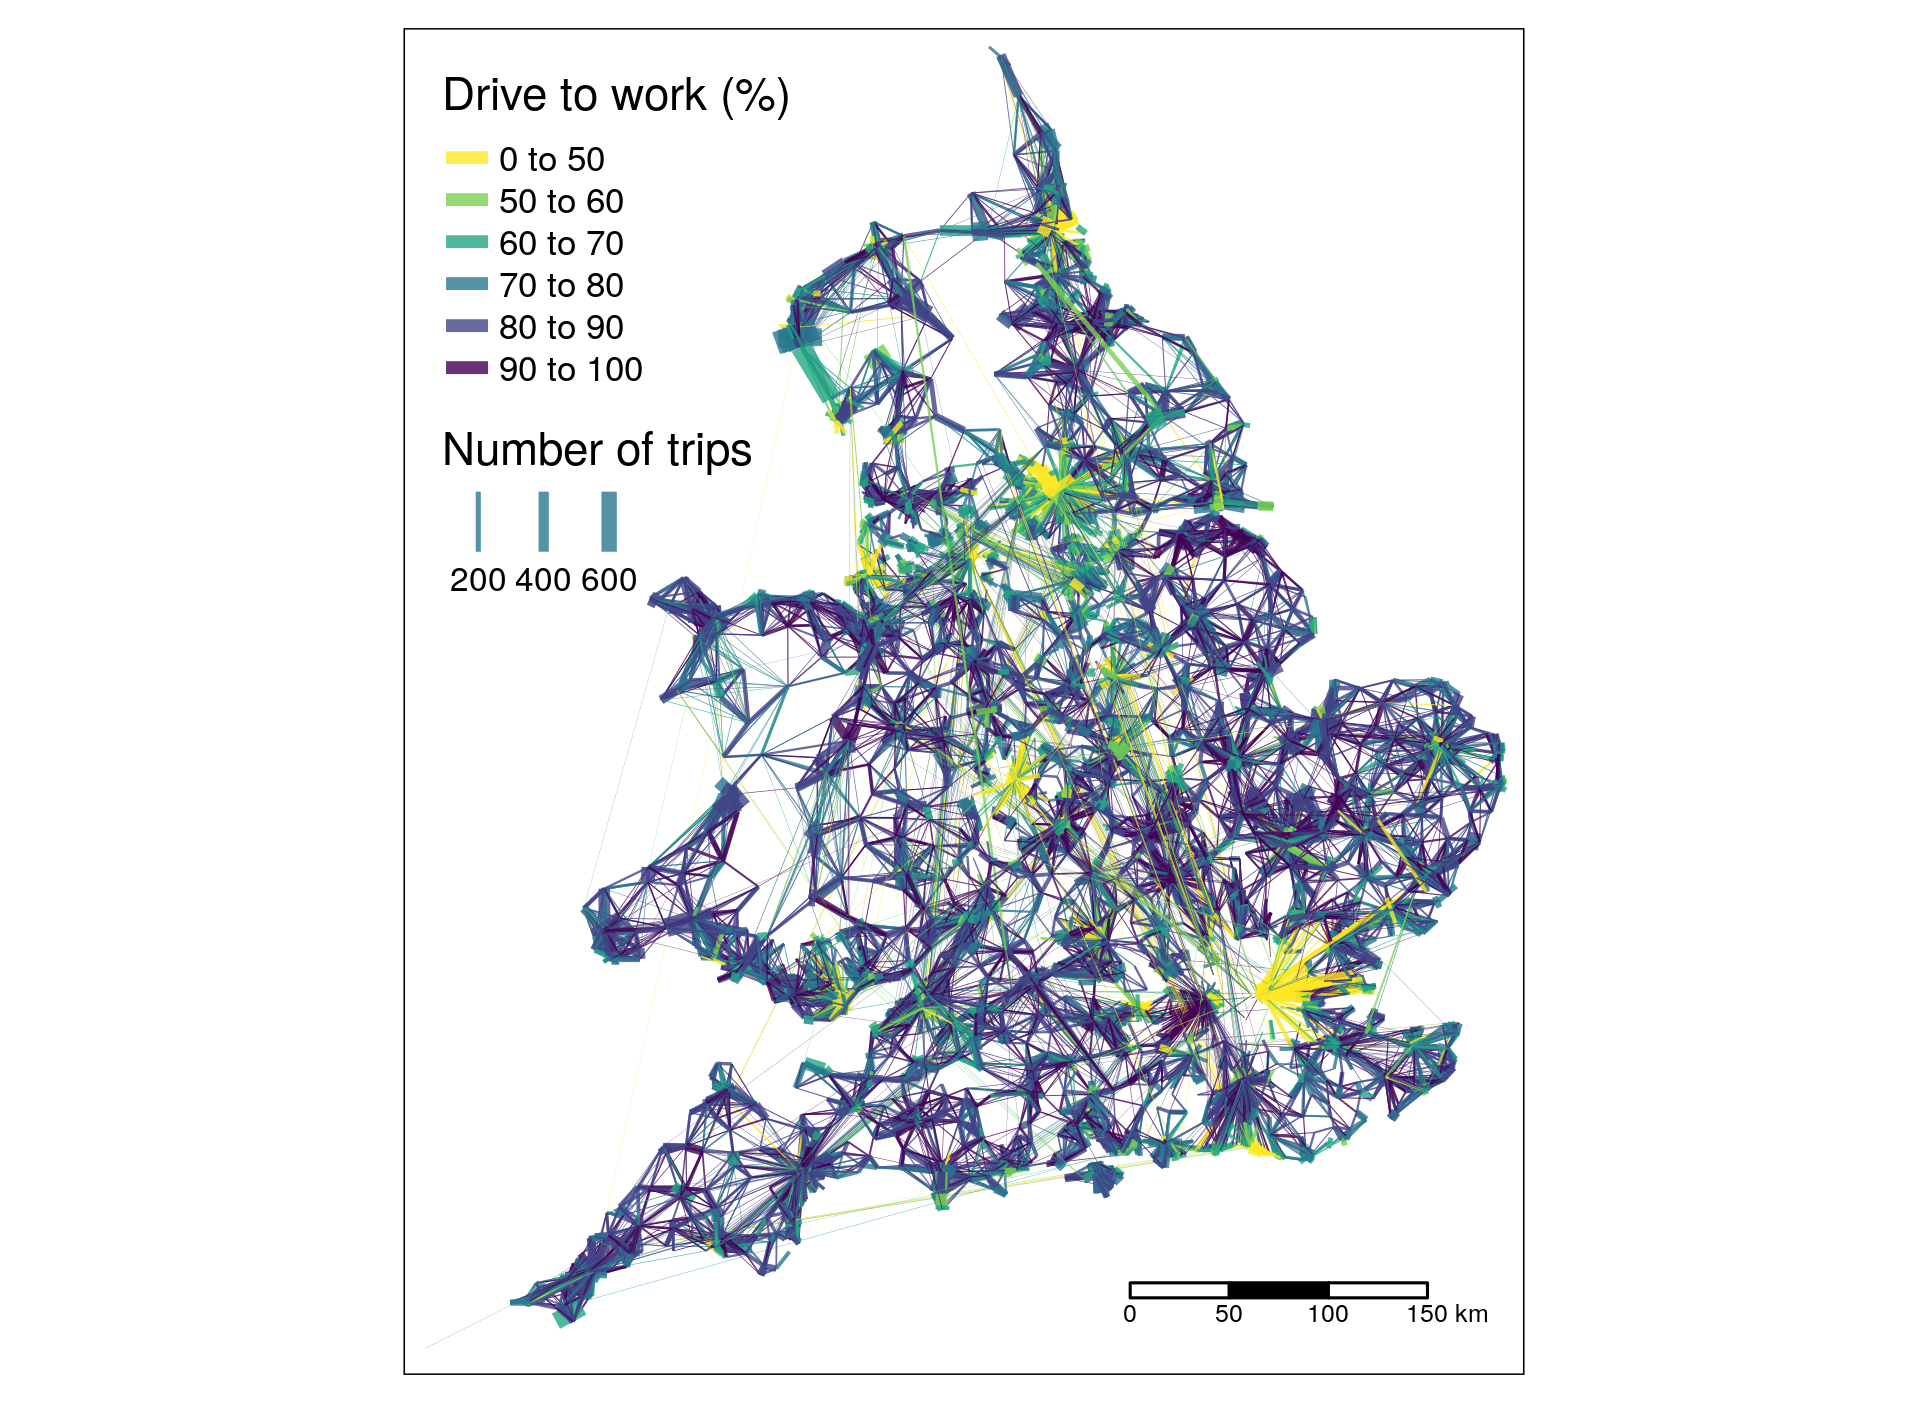
However, passenger transport is rarely accounted-for in aggregate statistics or thinking about energy use at national, let alone sub-national levels. Too often energy policies completely ignore transport. This paper aims to address these issues head-on, by demonstrating the potential for geographic visualisation methods to ‘bring to life’ the energy (and resulting emissions) impacts of transport, to inform thinking around and interventions enabling the rapid decarbonisation of the sector. The use of progressively more detailed visualisation techniques, from time series of sectoral energy use trajectories (including uncertainty of the future) to ‘route network’ energy use plots that can show energy use down to the road segment level to flag the role of carbon-intensive infrastructure is illustrated in the results, building on a national origin-destination dataset based on the UK’s 2011 Census.
Globally, land-based passenger transport accounted for around 3.6 Gt CO2 in 2018, 11% of the global total. Passenger land transport is the single largest sub-sector within the transport sector with passenger, road freight, aviation, shipping and other modes accounting for 45%, 30%, 11%, 11% and 3%, of the sector’s emissions respectively, omitting the increased impact of high altitude emissions from flying, accounting for 45% of transport emissions (Sims et al. 2014).[1] The focus of the paper is on the UK, where the gap between projections of future emissions and the necessary cuts, to reach zero carbon by 2050, is larger than for other sectors (Department for Transport 2020). The UK is not necessarily representative of the global situation, but represents a good case study country due to the provision of national open access origin-destination data at high levels of geographic resolution (Lovelace et al. 2017). The challenges that the UK’s passenger transport sector faces from an emissions perspective, including high level of car dependency and under-investment in and capacity limits on public transport (Anable 2005; Pisu, Pels, and Bottini 2015), are not unique to Northern Europe.
Visualising transport energy use
Energy use is an inherently ephemeral phenomenon. Although, as the second law of thermodynamics states, energy cannot be created or destroyed, useful energy in the fossil fuel age exists only during the relatively short span between non-renewable sources being extracted and burned. In the coming renewable energy age, useful energy will exist for even less time, between conversion of environmental energy fluxes into electricity, transmission, and comparatively costly temporary storage. The second law of thermodynamics tells us that what we call energy use is in fact energy conversion, and every conversion results in less useful energy, in continuous and ubiquitous energy converters with varying power levels and load profiles. In the context of passenger transport, the prime example of these conversions is in the privately owned car, often the most powerful energy converter people have access to. <!--
- I suggest to move this paragraph a bit further. In my opinion, the first paragraph should be a to-the-point summary of our paper. This paragraph is about the physics of energy, which is more background. I added a new first paragraph as suggestion.
- Also, it was quite difficult for me to read, and probably also for other non-native-English/non-specialist-in-energy people. Specifically:
- A few difficult words which I had to look up: ephemeral and ubiquitous. Could be due to my bad English.
- This paragraph is basically a summary of physics about energy. For non-specialists like me, it took me some time to digest, and also raises some questions, such as
- What happens with the non-useful energy?
- How does energy conversion work?
- What exactly is renewable and non-renewable energy?
- 'the privately owned car': I assume that rental cars are just as bad. -->
The act of travel involves moving across geographic space. Policies to reduce excessive transport energy use can be divided into three categories from a geographic perspective:
- trip origins, typically residential locations where journeys begin
- trip destinations, typically ‘trip generators’ such as school, hospitals and work places where trips end
- and places in between, typically transport infrastructure
Most research into transport energy use has focussed on the first of these categories. This makes sense from a citizen-focussed policy perspective, enabling residential areas with excessive transport energy use to be identified. From geographic and energy systems perspectives, it makes sense to identify opportunities to intervene across the range of places and points in transport-energy systems. Examples of interventions focussing on each of the geographic ‘locations’ outlined above include: localised parking restrictions discouraging high car ownership in specific areas (at trip origins); increased parking costs at major trip attractors such as city centre car parks and airports (at destinations); and road pricing to subsidise public transport modes (between origins and destinations).
The spatially distributed nature of transport energy use makes it not only possible, but also useful to analyse it across geographic space. We analyse geographic transport behaviour by using aggregated origin-destination data (OD data), which contains the numbers of people travelling from origin to destination via intermediate points, by mode of transport. This paper sets out a case for analysing and visualising transport analysis at this OD level.
-
Something on different levels of energy analysis.
-
Something on visualisation of spatial phenomena, e.g. building on (Rae 2009)
Data and methods
…
Levels of visualisation
Time series plots
Origin-destination data
OD datasets are ‘implicitly geographic’: their coordinates are not
contained in the data, but associated with another data object,
typically a zone or a zone centroid. An example demonstrating OD data is
shown below, which represents 2.4 million desire lines at the MSOA-MSOA
level in England and Wales. The dataset shows the overall travel to work
patterns across the UK, based on 21.6 million people in which both
origin and destination were reported in the 2011 Census. This represents
81% of all commuters in the open access origin-destination data
contained in the file wu03ew_v2.csv, which can be downloaded from
http://wicid.ukdataservice.ac.uk/ as follows:
by the number of car km used for travel to work, which can be downloaded, read-in and plotted as follows:
Based on the estimate of the average energy use per km being 2.5 MJ, and that these return trips are made on average 200 times per year, with a circuity (the ratio of straight line distance to route distance) of 1.3, we can estimate the total energy use of the ‘high energy commutes’ as follows:
That represents ~10 petajoules (PJ), only for the top 20,000 most energy intensive commutes. That may seem like a lot, but represents only a fraction of the UK’s total energy use of ~200 Mtoe (8400 PJ).
Zone of origin
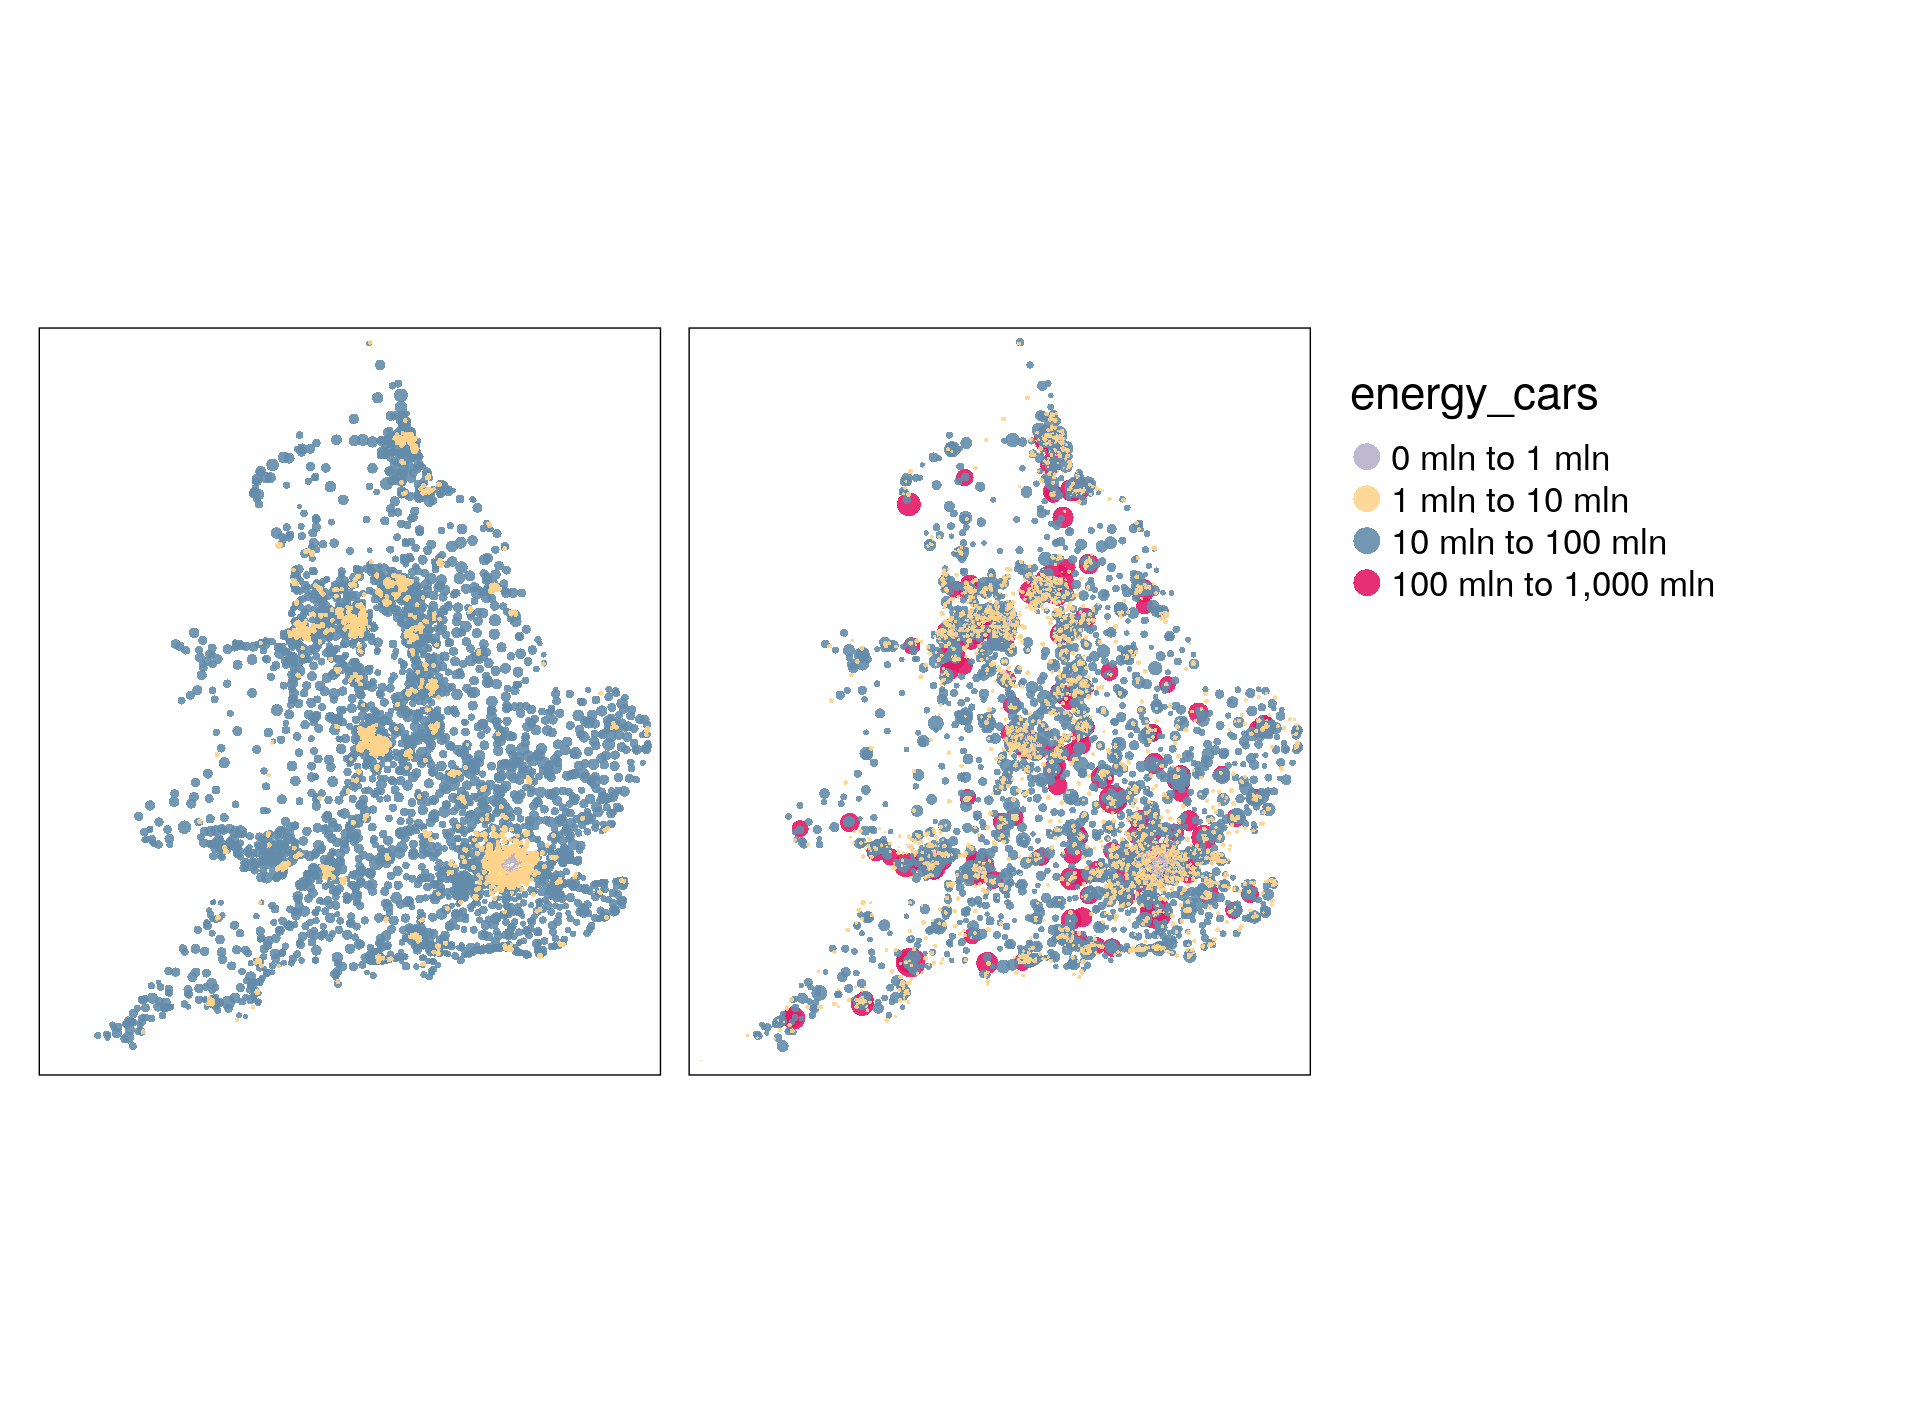
The energy use presented at the OD level in the previous section can be aggregated to the zone level.
Zone of destination
Centroids
An issue with visualising zonal data on geographic maps is that the results can over-emphasise attributes large, rural areas (???).
Visualising desires lines
Desire lines
Desire lines with direction
Routes
Route networks
Discussion and conclusion
A next step for this will be to compare ‘high energy origins’ and ‘high energy destinations’ with other energy-related variables.
We will also look at the impact of using route distances rather than straight line distances with an average circuity.
References
Anable, Jillian. 2005. “‘Complacent Car Addicts’ or ‘Aspiring Environmentalists’? Identifying Travel Behaviour Segments Using Attitude Theory.” Transport Policy 12 (1): 65–78. https://doi.org/10.1016/j.tranpol.2004.11.004.
Department for Transport. 2020. “Decarbonising Transport: Setting the Challenge.” Department for Transport.
Gota, Sudhir, Cornie Huizenga, Karl Peet, Nikola Medimorec, and Stefan Bakker. 2019. “Decarbonising Transport to Achieve Paris Agreement Targets.” Energy Efficiency 12 (2): 363–86.
Gül, Timur, Socrates Kypreos, Hal Turton, and Leonardo Barreto. 2009. “An Energy-Economic Scenario Analysis of Alternative Fuels for Personal Transport Using the Global Multi-Regional MARKAL Model (GMM).” Energy 34 (10): 1423–37. https://doi.org/10.1016/j.energy.2009.04.010.
Jarvis, Christopher I., Kevin Van Zandvoort, Amy Gimma, Kiesha Prem, Petra Klepac, G. James Rubin, W. John Edmunds, and CMMID COVID-19 working group. 2020. “Quantifying the Impact of Physical Distance Measures on the Transmission of COVID-19 in the UK.” medRxiv.
Lovelace, Robin, Anna Goodman, Rachel Aldred, Nikolai Berkoff, Ali Abbas, and James Woodcock. 2017. “The Propensity to Cycle Tool: An Open Source Online System for Sustainable Transport Planning.” Journal of Transport and Land Use 10 (1). https://doi.org/10.5198/jtlu.2016.862.
Mitjà, Oriol, Àlex Arenas, Xavier Rodó, Aurelio Tobias, Joe Brew, and José M. Benlloch. 2020. “Experts’ Request to the Spanish Government: Move Spain Towards Complete Lockdown.” The Lancet.
Moriarty, Patrick, and Damon Honnery. 2016. “Global Transport Energy Consumption.” Alternative Energy and Shale Gas Encyclopedia. NY: John Wiley and Sons, 651–56.
Pisu, Mauro, Barbara Pels, and Novella Bottini. 2015. “Improving Infrastructure in the United Kingdom.” OECD Economics Department Working Papers, no. 1244. https://doi.org/https://doi.org/https://doi.org/10.1787/5jrxqbqc7m0p-en.
Rae, Alasdair. 2009. “From Spatial Interaction Data to Spatial Interaction Information? Geovisualisation and Spatial Structures of Migration from the 2001 UK Census.” Computers, Environment and Urban Systems 33 (3): 161–78. https://doi.org/10.1016/j.compenvurbsys.2009.01.007.
Sims, Ralph, Roberto Schaeffer, F. Creutzig, X. Cruz-Núñez, M. D’agosto, D. Dimitriu, M. J. Figueroa Meza, L. Fulton, S. Kobayashi, and O. Lah. 2014. “Transport Climate Change 2014: Mitigation of Climate Change. Contribution of Working Group III to the Fifth Assessment Report of the Intergovernmental Panel on Climate Change Ed O Edenhofer et Al.” Cambridge and New York: Cambridge University Press. Available at: Http://Www. Ipcc. Ch/Pdf/Assessment-Report/Ar5/Wg3/Ipcc_wg3_ar5_chapter8. Pdf.
Wilder-Smith, A., and D. O. Freedman. 2020. “Isolation, Quarantine, Social Distancing and Community Containment: Pivotal Role for Old-Style Public Health Measures in the Novel Coronavirus (2019-nCoV) Outbreak.” Journal of Travel Medicine 27 (2): taaa020.
- See the International Energy Agency’s interactive transport energy emissions tracker at https://www.iea.org/reports/tracking-transport-2019 for details.

