|
About |
Skills |
Python/R |
NLP |
Visualization |
Data Apps |

Hi, I am a savvy technical analyst with 4-year experience in data analytics and 2-year experience in fast-paced startup environments. Proficient in SQL, Python, dbt, and various BI tools, such as Tableau and Metabase.
This portfolio is a compilation of all the data science and data analysis projects I have done for work, academic, self-learning and hobby purposes.
- Database: BigQuery, MySQL, PostgreSQL, MongoDB
- Programming: SQL/dbt, Python, R, JavaScript
- Data Engineering: dbt, Airbyte, Fivetran, Airflow, Spark
- BI Tools: Tableau, Metabase, Google Data Studio
- Product & Marketing: Segment, fullstory, Jira, Google Ads, Google Analytics
This Chatbot App built on Acho uses conversational AI to create human-like interactions with users by leveraging OpenAI’s text completion API and Python model.

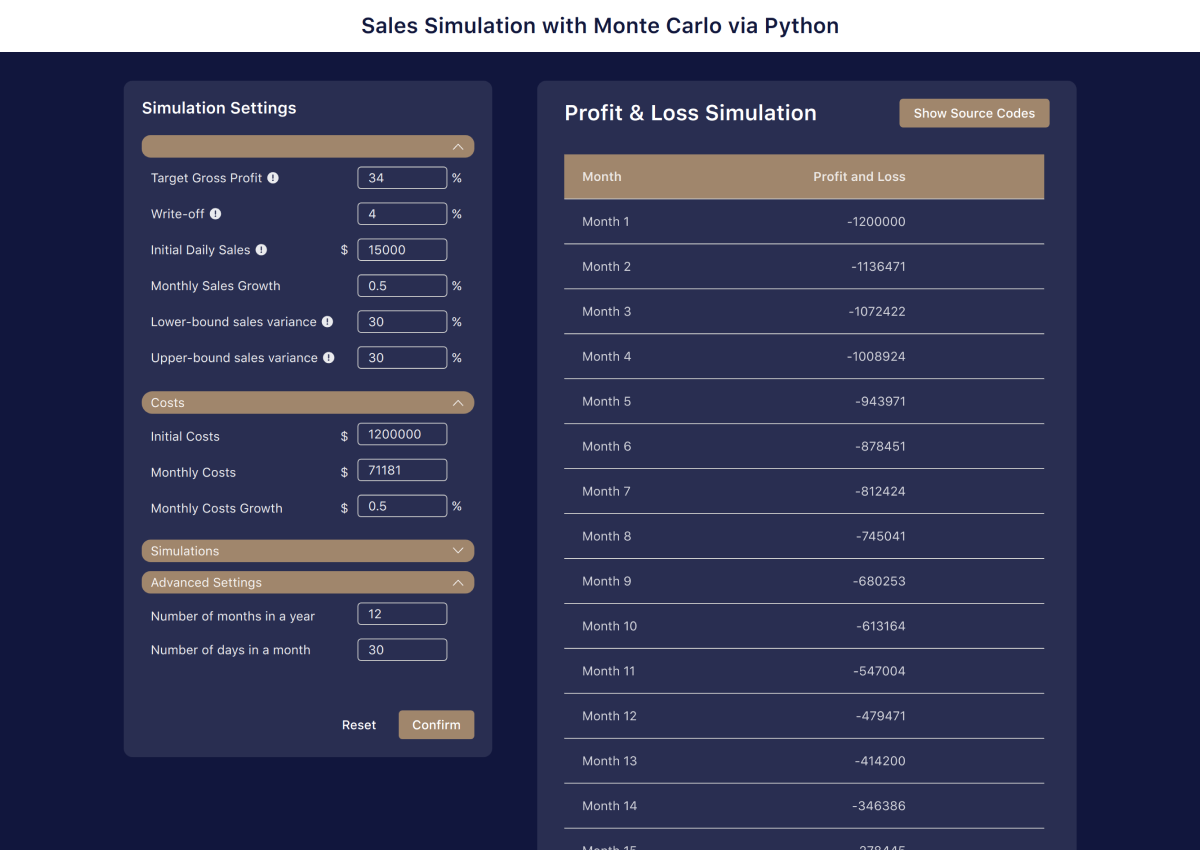
This App powered by Python utilizes the Monte Carlo model to forecast sales for a business. Monte Carlo methods are a class of computational algorithms that rely on repeated random sampling to obtain numerical results.
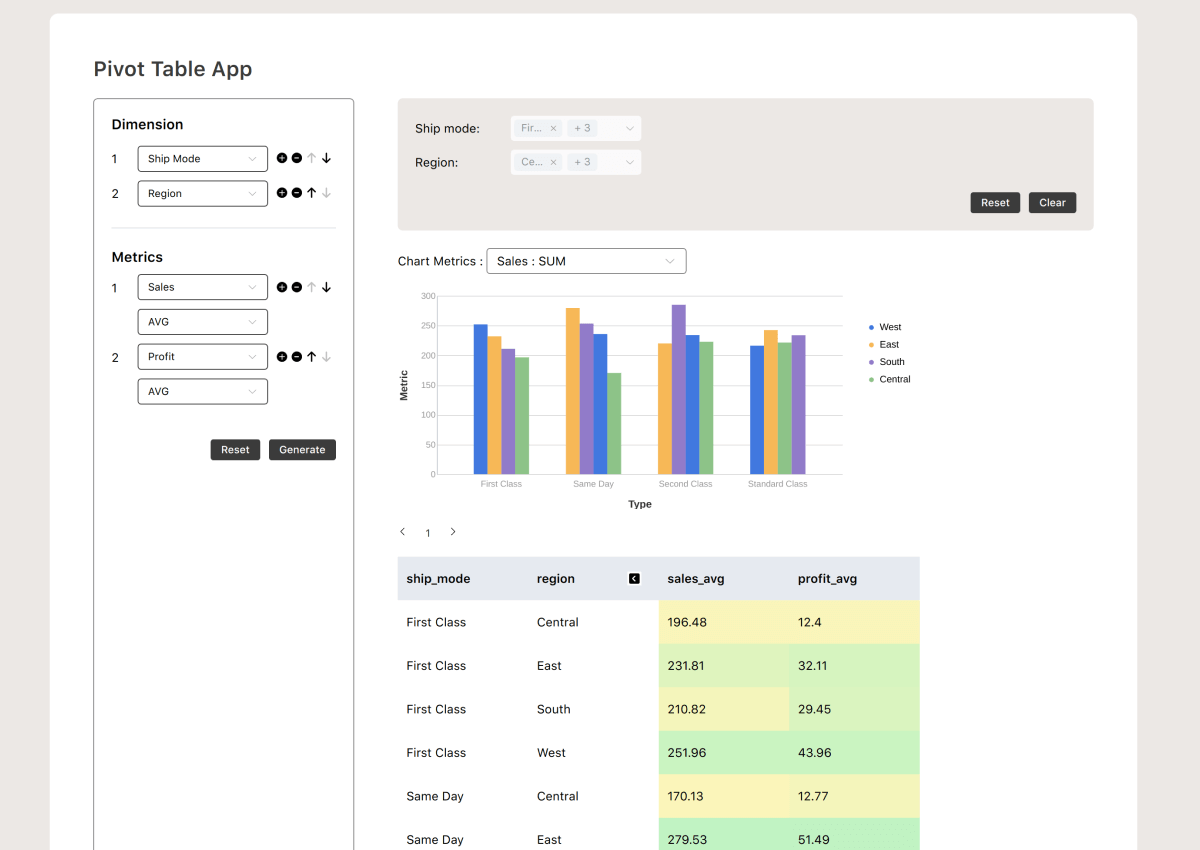
3. Digital Advertising Performance Tracking App
The digital advertising performance tracking app is a tool that helps marketers and advertisers track and measure the effectiveness of their digital advertising campaigns.
A data request system functions enable users to submit requests for data, dashboards, or ad-hoc reports. Data owners have visibility of the requests and can address them accordingly.

 6. Virtual Movie Recommendation Assistant
Purpose: A chatbot to help users find the movie of interest, and provide recommendations based on the chosen movie
Methods: Web Scraping, Finite State Machine, Recommender System, Web Application
Tools: Python, Plotly Dash
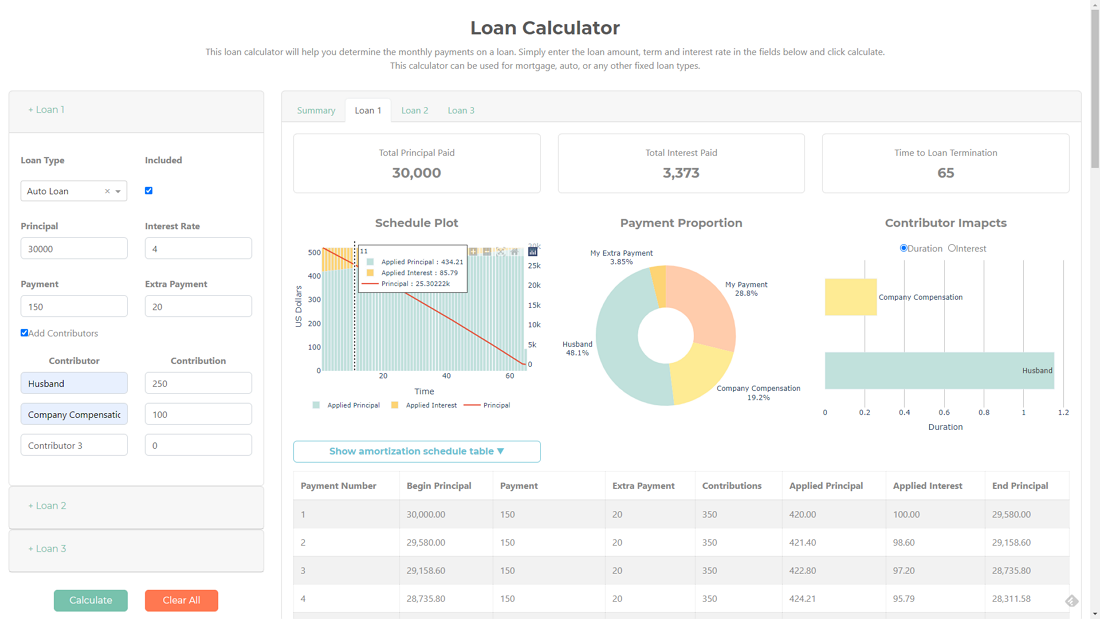
 7. Loan Analytics Calculator and Dashboard:
Purpose: A web application to calculate monthly payment for multiple loans in tables and charts
Methods: Data Visualization, Web Application
Tools: Python, Plotly Dash
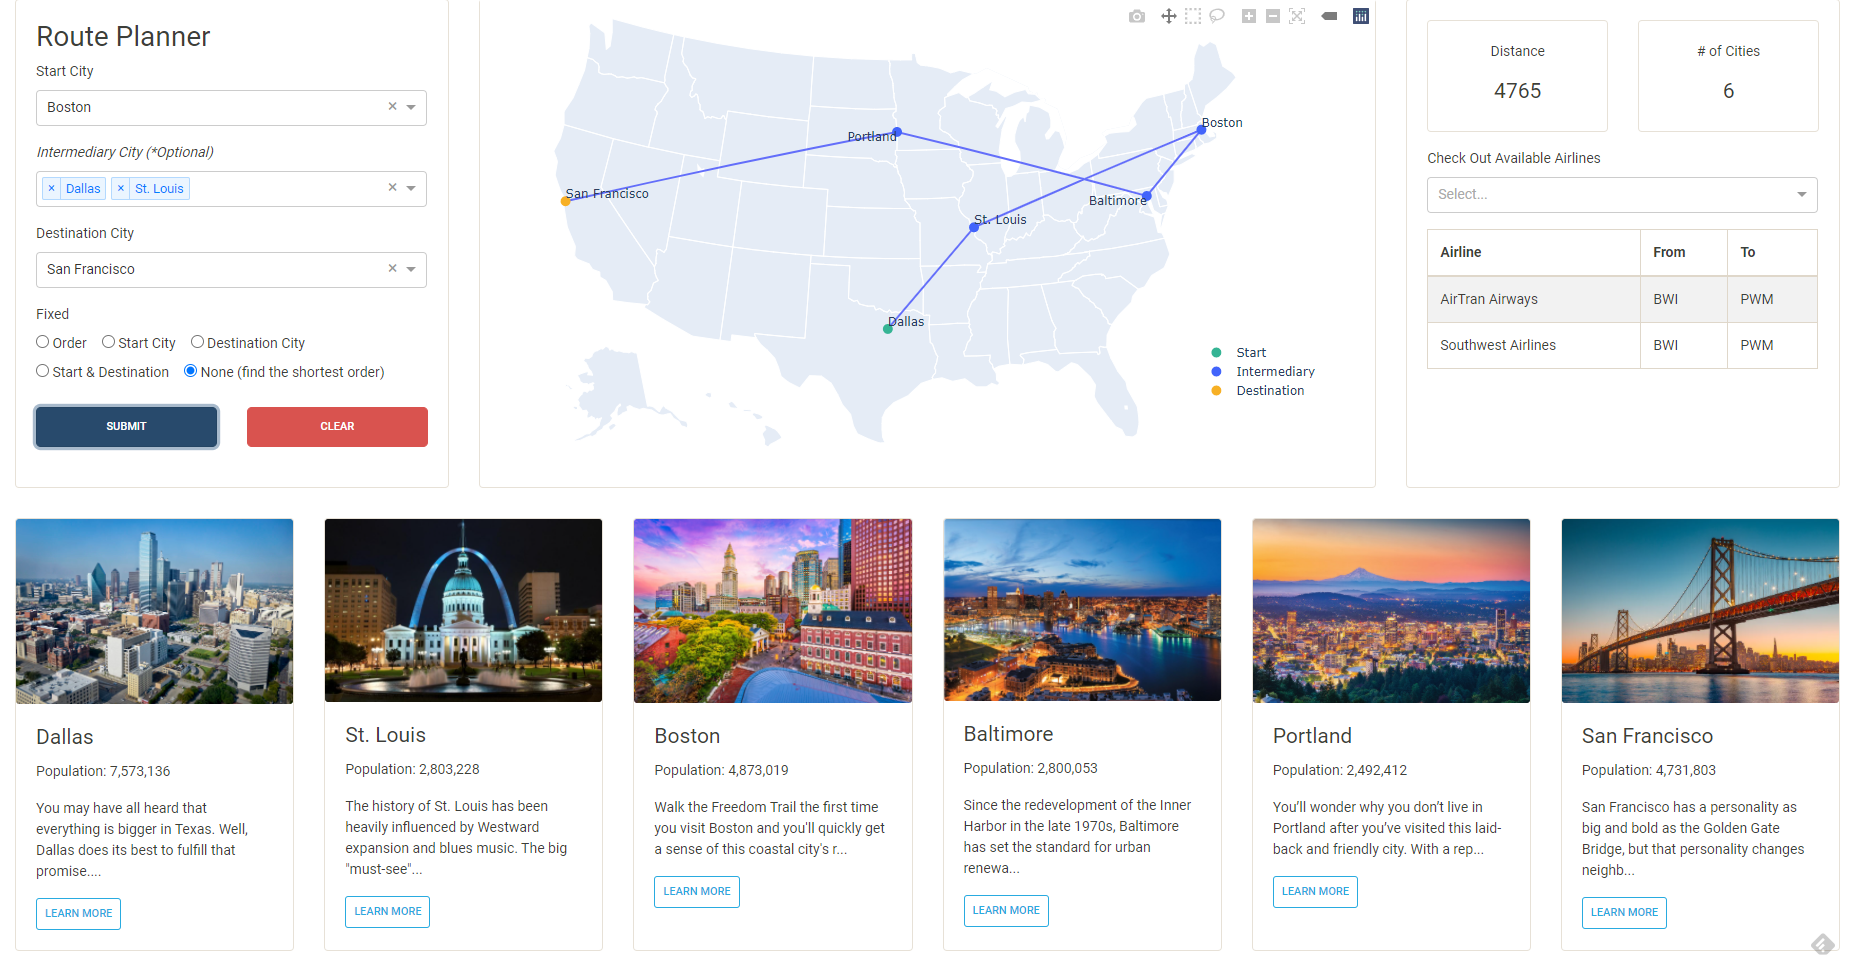
 8. Route Planner and Network Analysis
Purpose: A web application to optimize travel routes and offer information about cities along the route
Methods: Network Analysis, Data Visualization, Web Application
Results: Python, Plotly Dash

Purpose: Understand customers' attitudes toward the business
Methods: Naïve Bayes Algorithm, Machine Learning (Classification)
Results: F1 score achieved 78.1% and identified 53 keywords for classifying positive and negative reviews

Purpose: Discover insights from the status quo
Method: Descriptive Statistics, Cohort Analysis, Visualization
Result: Strategies works very well after August and increasing the retention rate is indeed helpful to raise revenue

Purpose: Identity current customer groups
Methods: RFM analysis, K-means, Machine Learning (Clustering)
Results: Segmented consumers into 5 groups and found a potential risk that sales heavily relies on a few customers

Purpose: Recognize channels which contributes the most sales
Methods: Markov Chain, Visualization
Results: In the 5 channels, Facebook and Paid Search contributes 54.4% conversions, whereas Instagram has the highest conversion rate

Purpose: Find out the best times to call the right customers to promote a term deposit
Methods: Classification, Logistic Regression, KNN, Random Forest
Results: Implemented several machine learning models and selected the best performing random forest model which had the best precision score
Purpose: Explore how industries react to the market crash due to COVID-19
Methods: Web Scraping, K-Median Clustering, Visualization
Results: The energy sector suffers from a considerable decrease in the stock price, but technology, consumer products, and healthcare are relatively robust

Purpose: Study which diseases probably co-occur within COVID-19 patients
Methods: Association Analysis, Visualization
Results: Summarized top 20 rules with the highest lift and further explore if causality exists between diseases
Developed and implemented a multinomial Naïve Bayes classifier using bag-of-words features from scratch
Created unigram and bigram language models to solve the jumbled sentence task, that is, to find which sentence is a real sentence out of 10 jumbled sentences
3. Part-of-speech Tagging with Hidden Markov Models
Built a supervised hidden Markov model, utilized the Brown corpus as data for training, and gained accuracy 72% in part-of-speech tagging
4. Distributional Semantics Takes the SAT Analogy Questions
Constructed distributional semantic word sectors through PPMI and apply them to synonym detection and solve SAT analogy questions
 |
 |
 |
 |
| Tableau Public | Tableau Public | Tableau Public | Tableau Public |


