#Building your first Leaflet.js map This is the code behind my NICAR 2017 session on making maps with Leaflet.js.
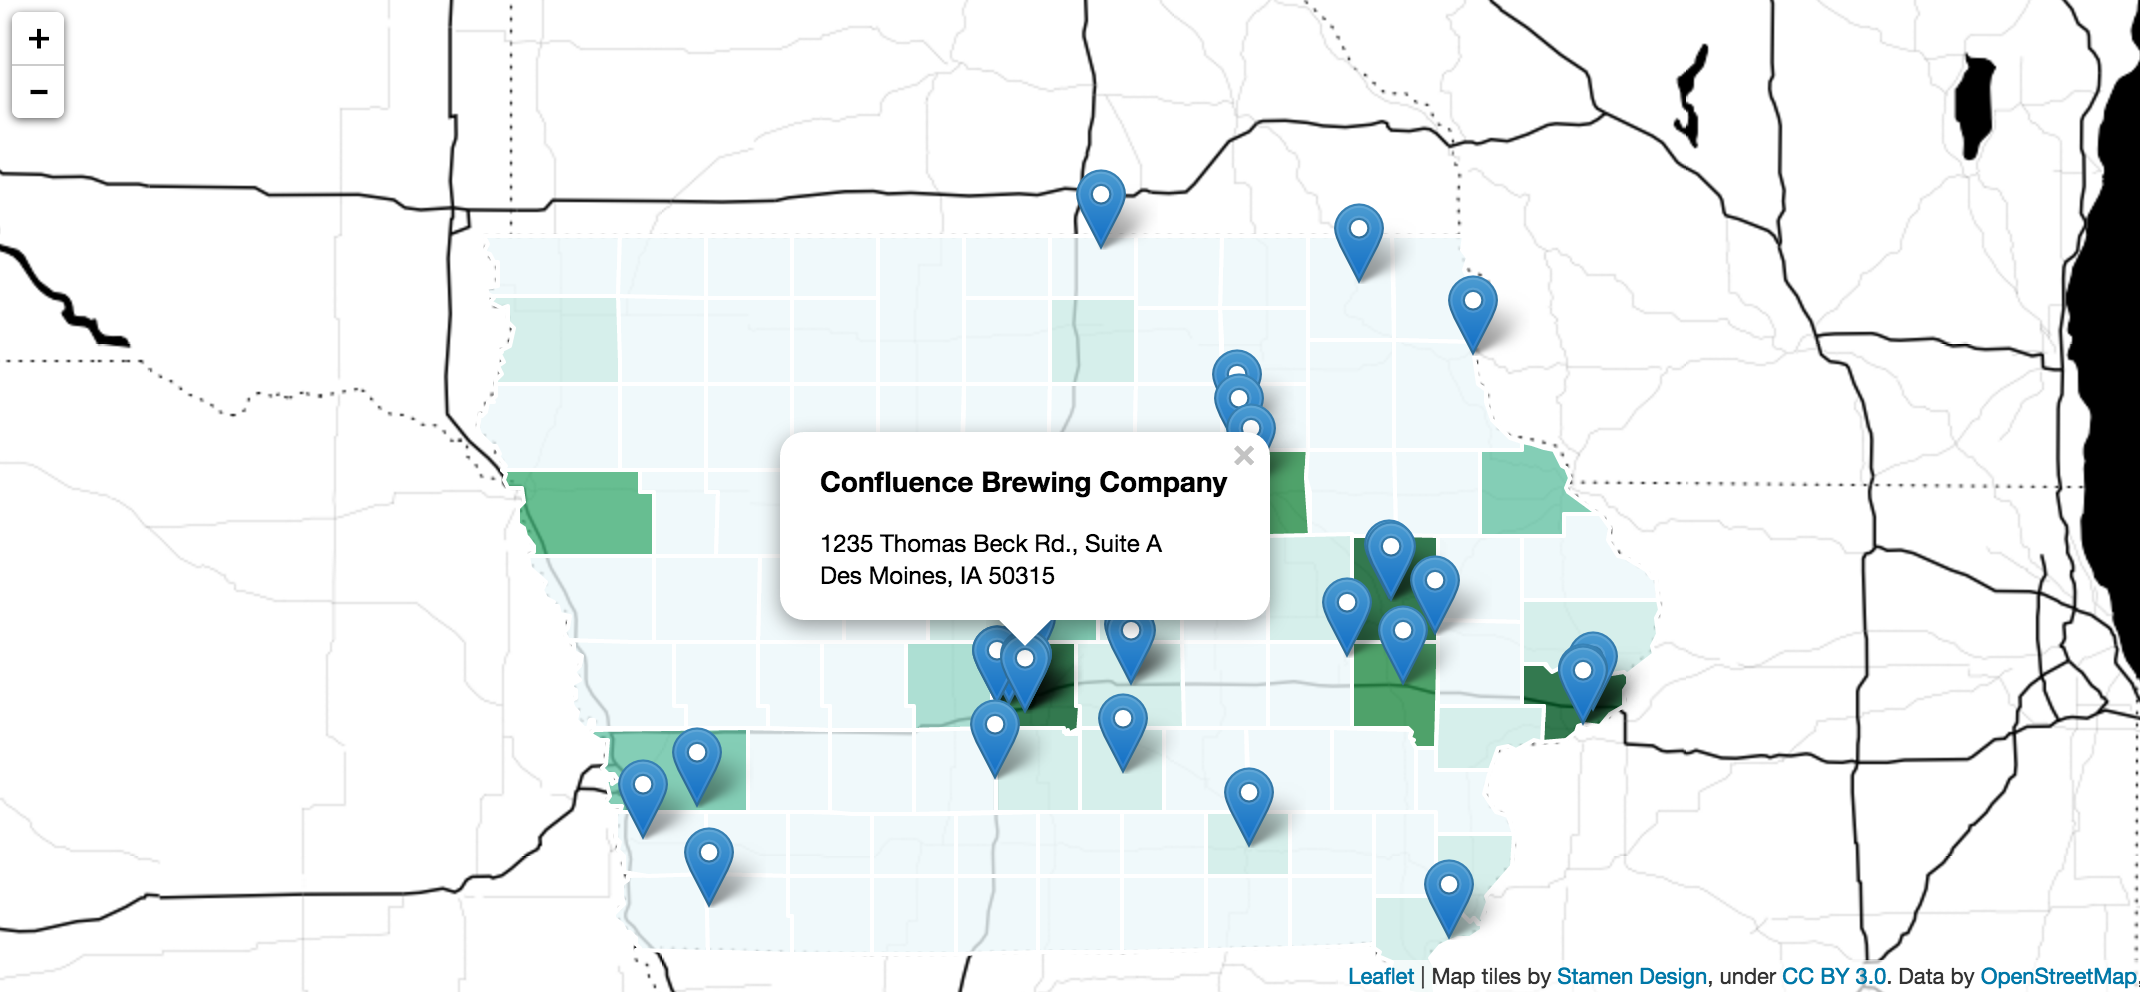
This is map we will be building.
####Pre: Why Leaflet.js?
- Free, open source and actively maintained
- Well documented with great examples
- Has a huge community behind it
- Used by a lot of people
- Minimal amount of code
- Mobile friendly
- Can handle thousands of data points without loading too slowly
- Plugins! Example of the markercluster plugin
####Pre: The set up
- This repo has two directories:
- 01-base contains the base files you will need to get started. All the files you need have been created here, but none of the mapping code has been written yet.
- 02-final is the final project we are going to build.
####1. Getting started
-
Download this repo onto your computer. Then open up the 01-base directory you created in a text editor. We'll be adding our mapping code to the files in this directory.
-
You'll notice at the bottom of the index.html file these lines:
 <!-- Our data sources -->
 <script src="json/ia-breweries.json"></script>
 <script src="json/ia-counties.json"></script>
-
These link to the data sources we're going to be using: JSON data of breweries in Iowa and GeoJSON data of the counties in Iowa.
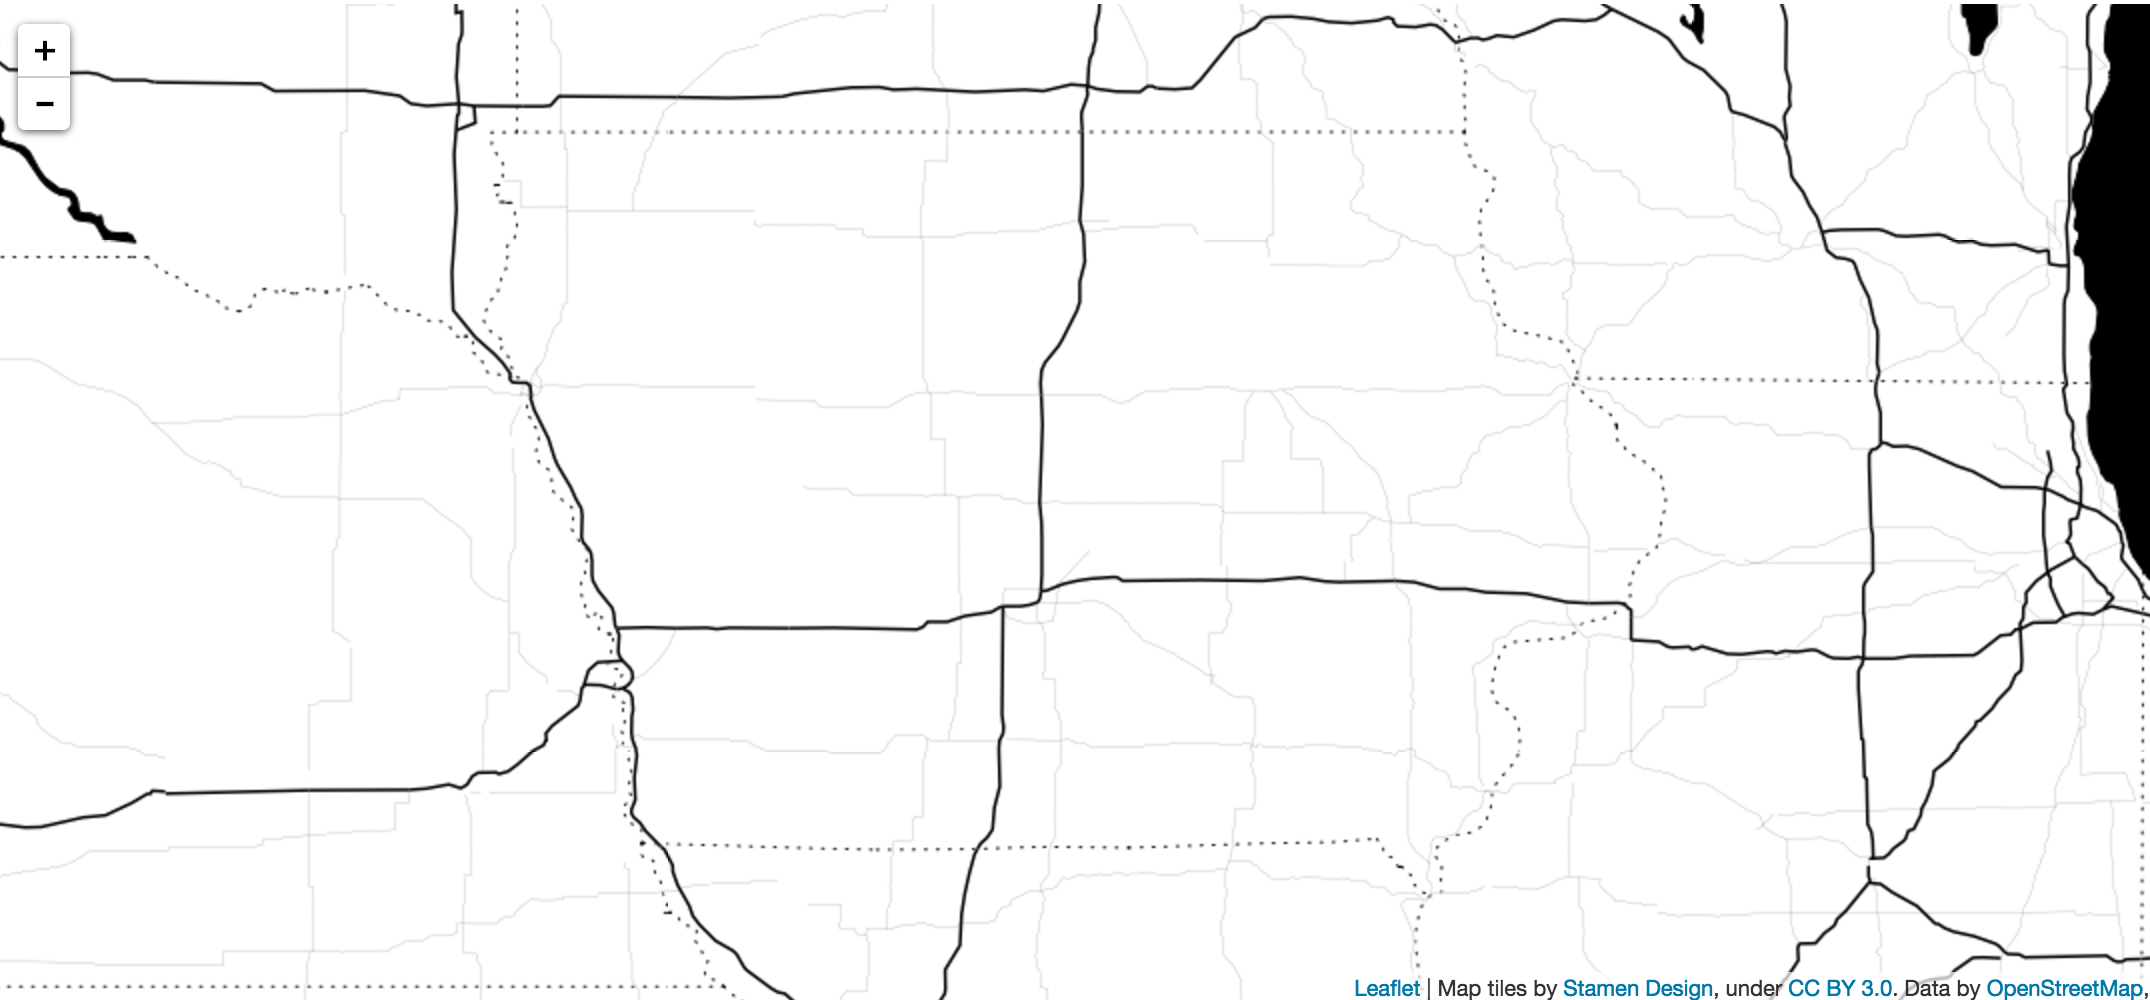
####2. Base map
- Add this to js/script.js:
 var layer = new L.StamenTileLayer('toner-background');

 var map = new L.Map('map').setView([42,-93],7);
 map.addLayer(layer);
####3. CSS
- Add this to css/style.css:
 #map {
 	width: 100%;
 	height: 500px;
 }
- This gets us a map without any data points that looks like:
####5. Add data to map
-
Our sample dataset is a list of breweries in Iowa. I've already included lat, long information for each brewery and converted the CSV into a JSON file. You must have lat, long information for each location for Leaflet to put them on the map.
-
Pro-tip: If you need a site to convert CSVs into JSON files, check out Mr. Data Converter. And if you're looking for a site that can geocode addresses in a Google spreadsheet, check out this site.
-
The breweries JSON data is one array. Each brewery is an object within that array. Objects have keys and values and each represent a data point. For instance, in the breweries data, one of the keys is address. The value is address for the specific brewery.
-
You need to make sure the array is a variable, so go into the file and add this before it:
var breweries =
-
This makes it easy for us to loop through that variable of our JSON array:
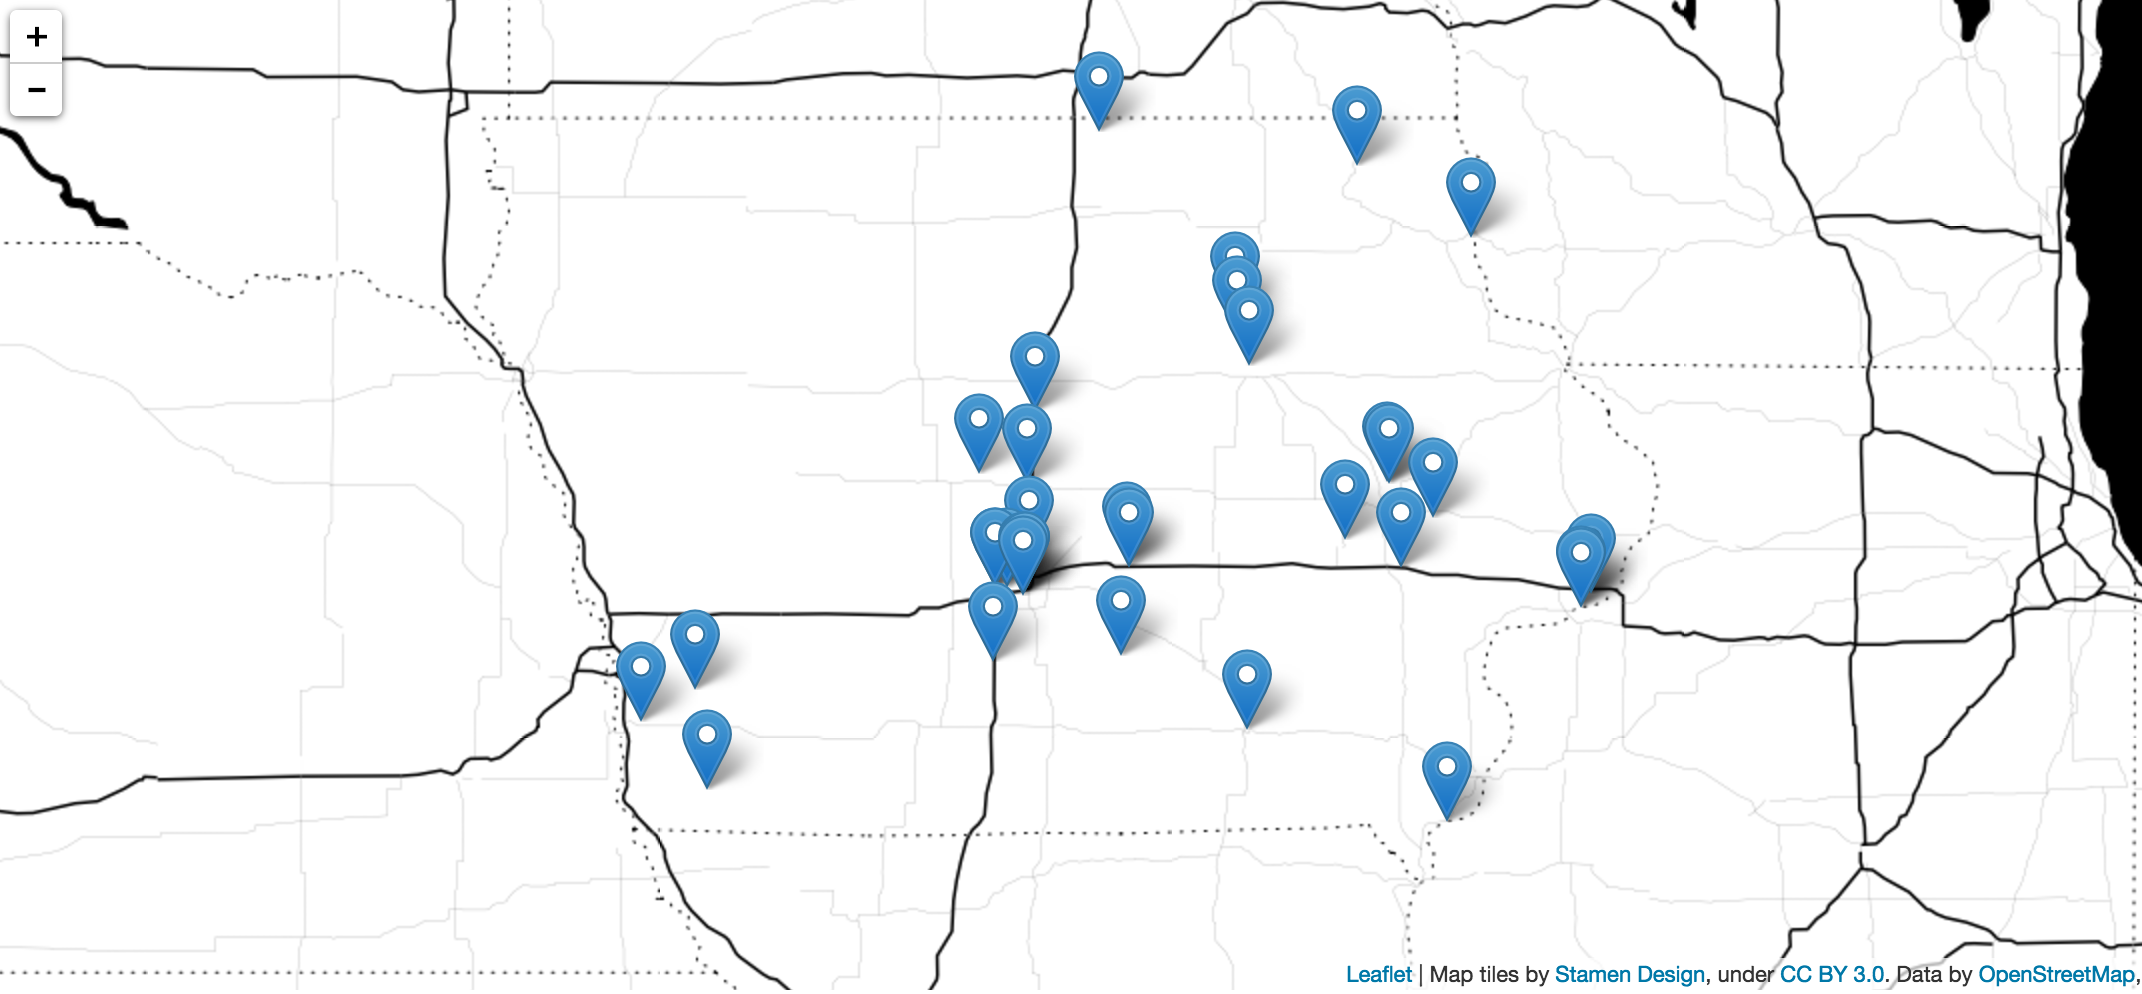
 for (var num = 0; num < breweries.length; num++) {
 	var brewery = breweries[num];
 	var brewery_lat = brewery["latitude"];
 	var brewery_long = brewery["longitude"];

 	L.marker([brewery_lat, brewery_long]).addTo(map);
 }
-
This loops through each brewery, grabs the brewery's latitude and longitude information and puts it on the map. The L.marker function is a Leaflet function that is used to create a new marker for each brewery we are looping through. It's placed on the map based on the brewery's latitude and longitude information.
-
Your map should now look like:
####4. Add GeoJSON data
-
The second dataset we will be working is a list of counties in Iowa, which is available in GeoJSON format here. I've downloaded this already and included it within the data directory.
-
NOTE: The counties also have population data in them, which we use later.
-
Like with our breweries, we need to make the GeoJSON object a variable so it can be easiliy called within script.js:
var iowa_counties =
-
Adding our counties to the map only takes one line of code:
L.geoJson(iowa_counties).addTo(map);
-
You'll what to place this ABOVE the for loop that places the marker on the map. The makes sure the counties appear under the markers.
-
Refresh your map and you'll see the counties now on the map:
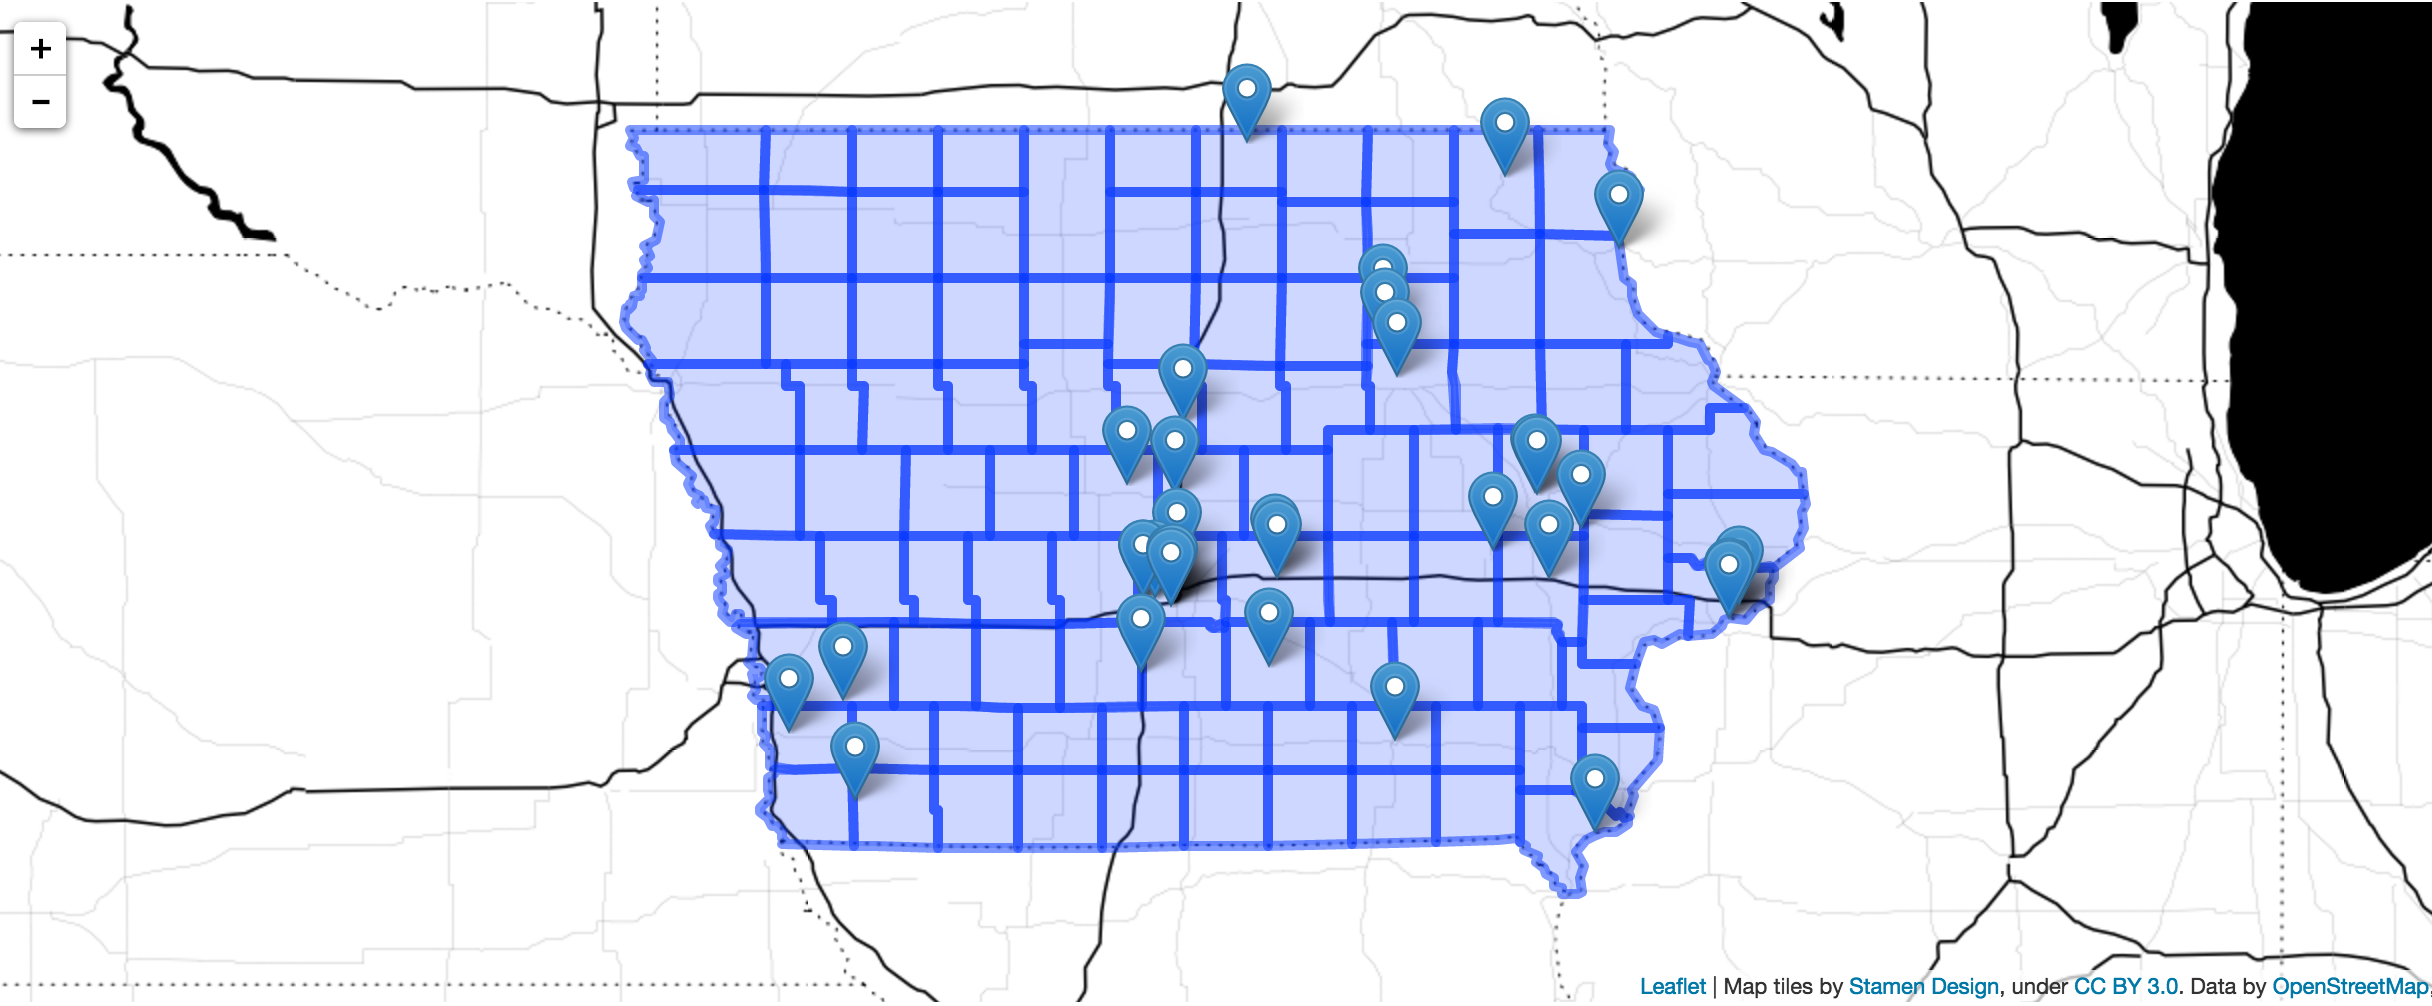
####5. Styling the counties
-
The counties kind of look ugly right now. We can fix that by extending the geojson object we added:
 function setStyle(feature) {
 	return {
 		opacity: 1,
 		weight: 2,
 		color: "#FFF",
 		fillColor: "#005824",
 		fillOpacity: 0.8
 	}
 }

 L.geoJson(iowa_counties, {
 	style: setStyle
 }).addTo(map);
-
Every time a county is looped through, the Leaflet GeJSON function calls the style method, which, in turn, calls the setSyle function. The function then returns styles for the particular county. Right now, we are returning the same fillColor for each county, so all the counties will be colored the same.
-
For more information on the different styling options available for GeoJSON layers, visit this page.
-
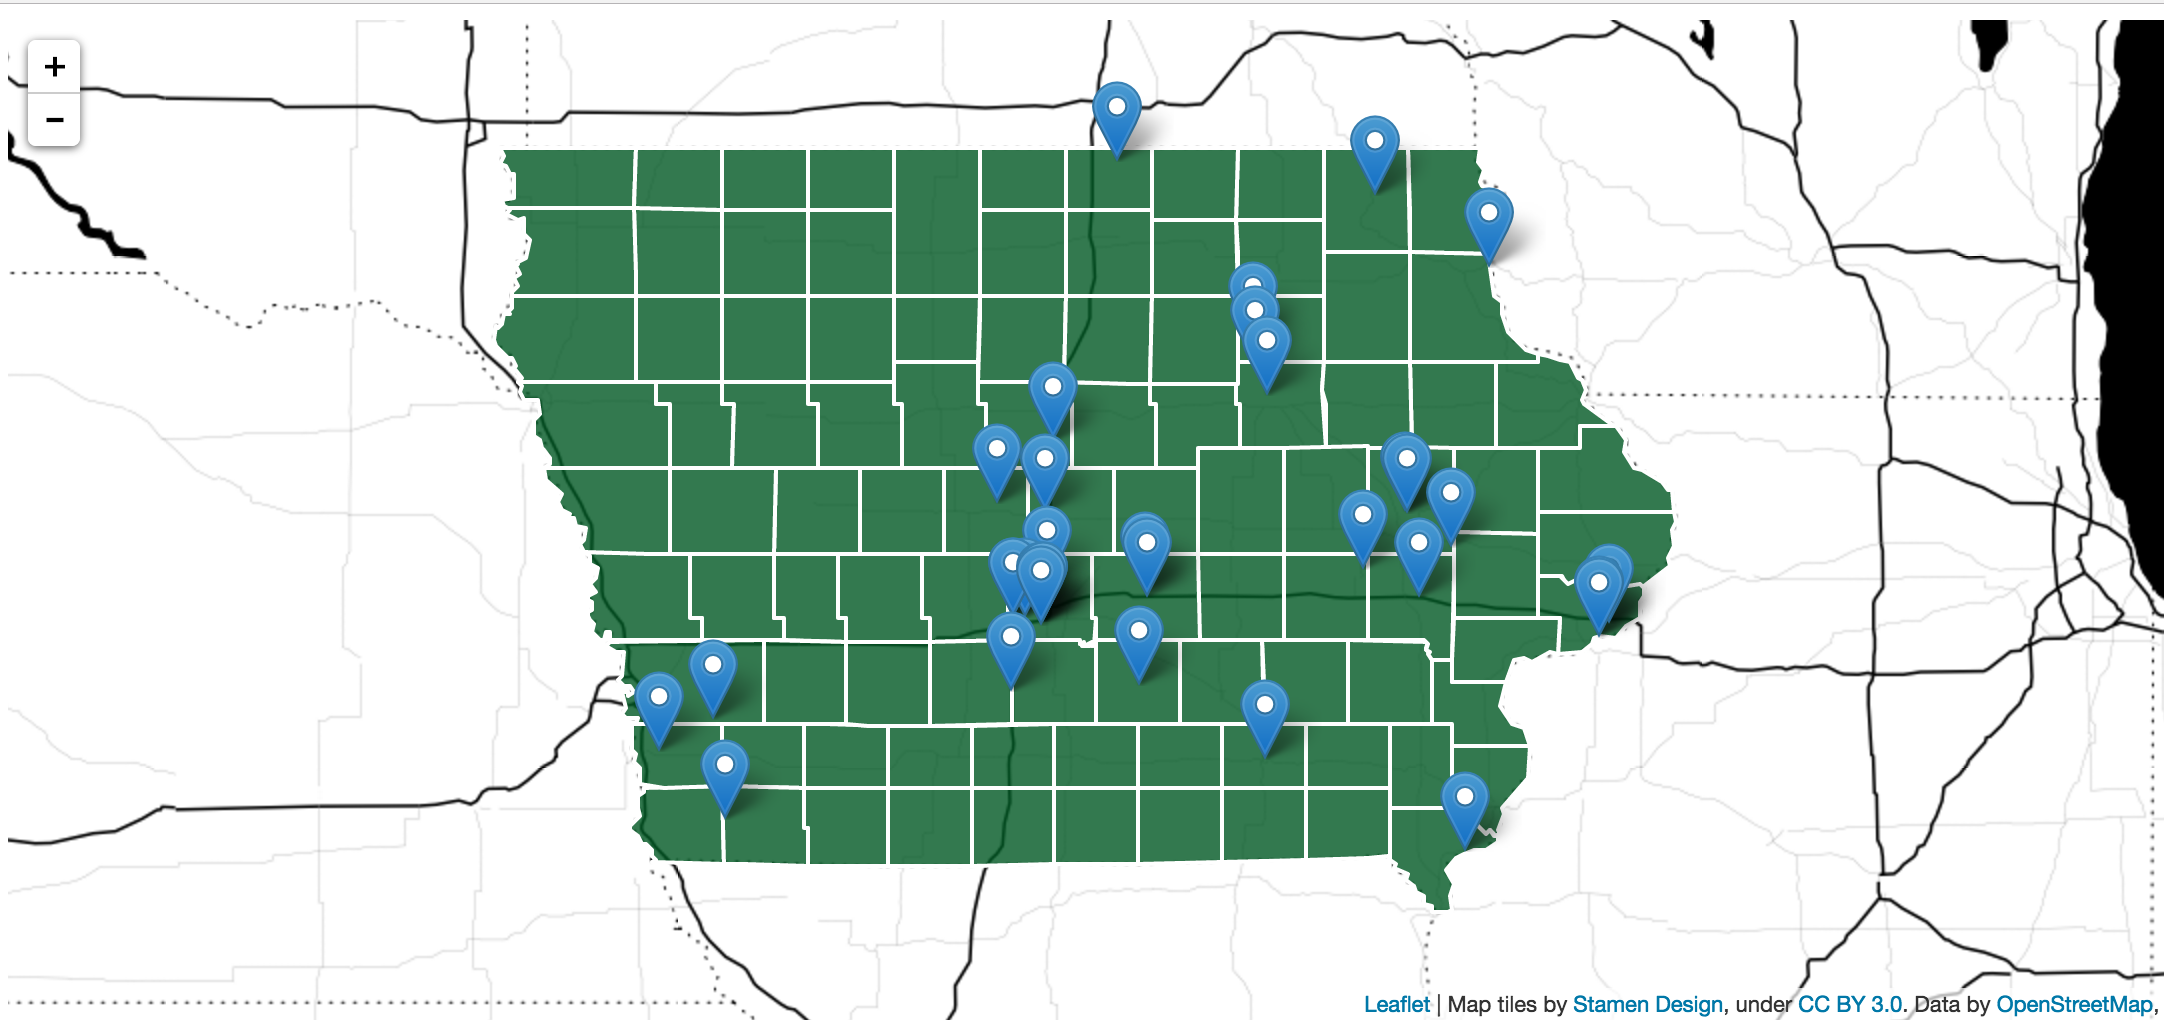
Your map should now look like:
####6. Color counties based on population data
-
Our map is cool and all but the counties don't tell us much. Wouldn't it be neat if we could shade the counties based on how many people lived within them? Fortunately we can do that relatively easily in Leaflet.
-
The final piece of data we will be working with is population data from the U.S. Census. We will create a basic choropleth map where the counties will be shaded based on their population. The more people, the darker the county.
-
I've already downloaded the data from the Census Reporter site and merged it into the county GeoJSON file that's on the map. I used QGIS to do this. If you're not familiar with QGIS, I recommend checking it out. It's a like watered-down version of ArcGIS. But unlike ArcGIS, it's free.
-
Instead setting the same color for each county, we're going to grab the population for each county we're looping through and set the color based on its value:
 function setColor(population) {
 	var population_num = parseInt(population)

 	if (population_num > 150000) {
 		return '#005824';
 	} else if (population_num > 125000) {
 		return '#238b45';
 	} else if (population_num > 100000) {
 		return '#41ae76';
 	} else if (population_num > 75000) {
 		return '#66c2a4';
 	} else if (population_num > 50000) {
 		return '#99d8c9';
 	} else if (population_num > 25000) {
 		return '#ccece6';
 	} else {
 		return '#edf8fb';
 	}
 }

 function setStyle(feature) {
 	return {
 		opacity: 1,
 		weight: 2,
 		color: "#FFF",
 		fillColor: setColor(feature.properties.population),
 		fillOpacity: 0.8
 	}
 }

 L.geoJson(iowa_counties, {
 	style: setStyle
 }).addTo(map);
-
Each county setStyle loops through is an object, with a couple of data points, including the shape of the county and the population (which I added with QGIS). We're after the county's population, and we can grab it by calling feature.properties.population.
-
This value is sent to the setColor function, which sets the color of the county based on its value. The population is stored as a string in the object, so we need to convert it to an integer using the handy parseInt function.
-
The setColor function looks at the population and it assigns it a color. The higher the population, the darker the green. The colors were grabbed from ColorBrewer.
-
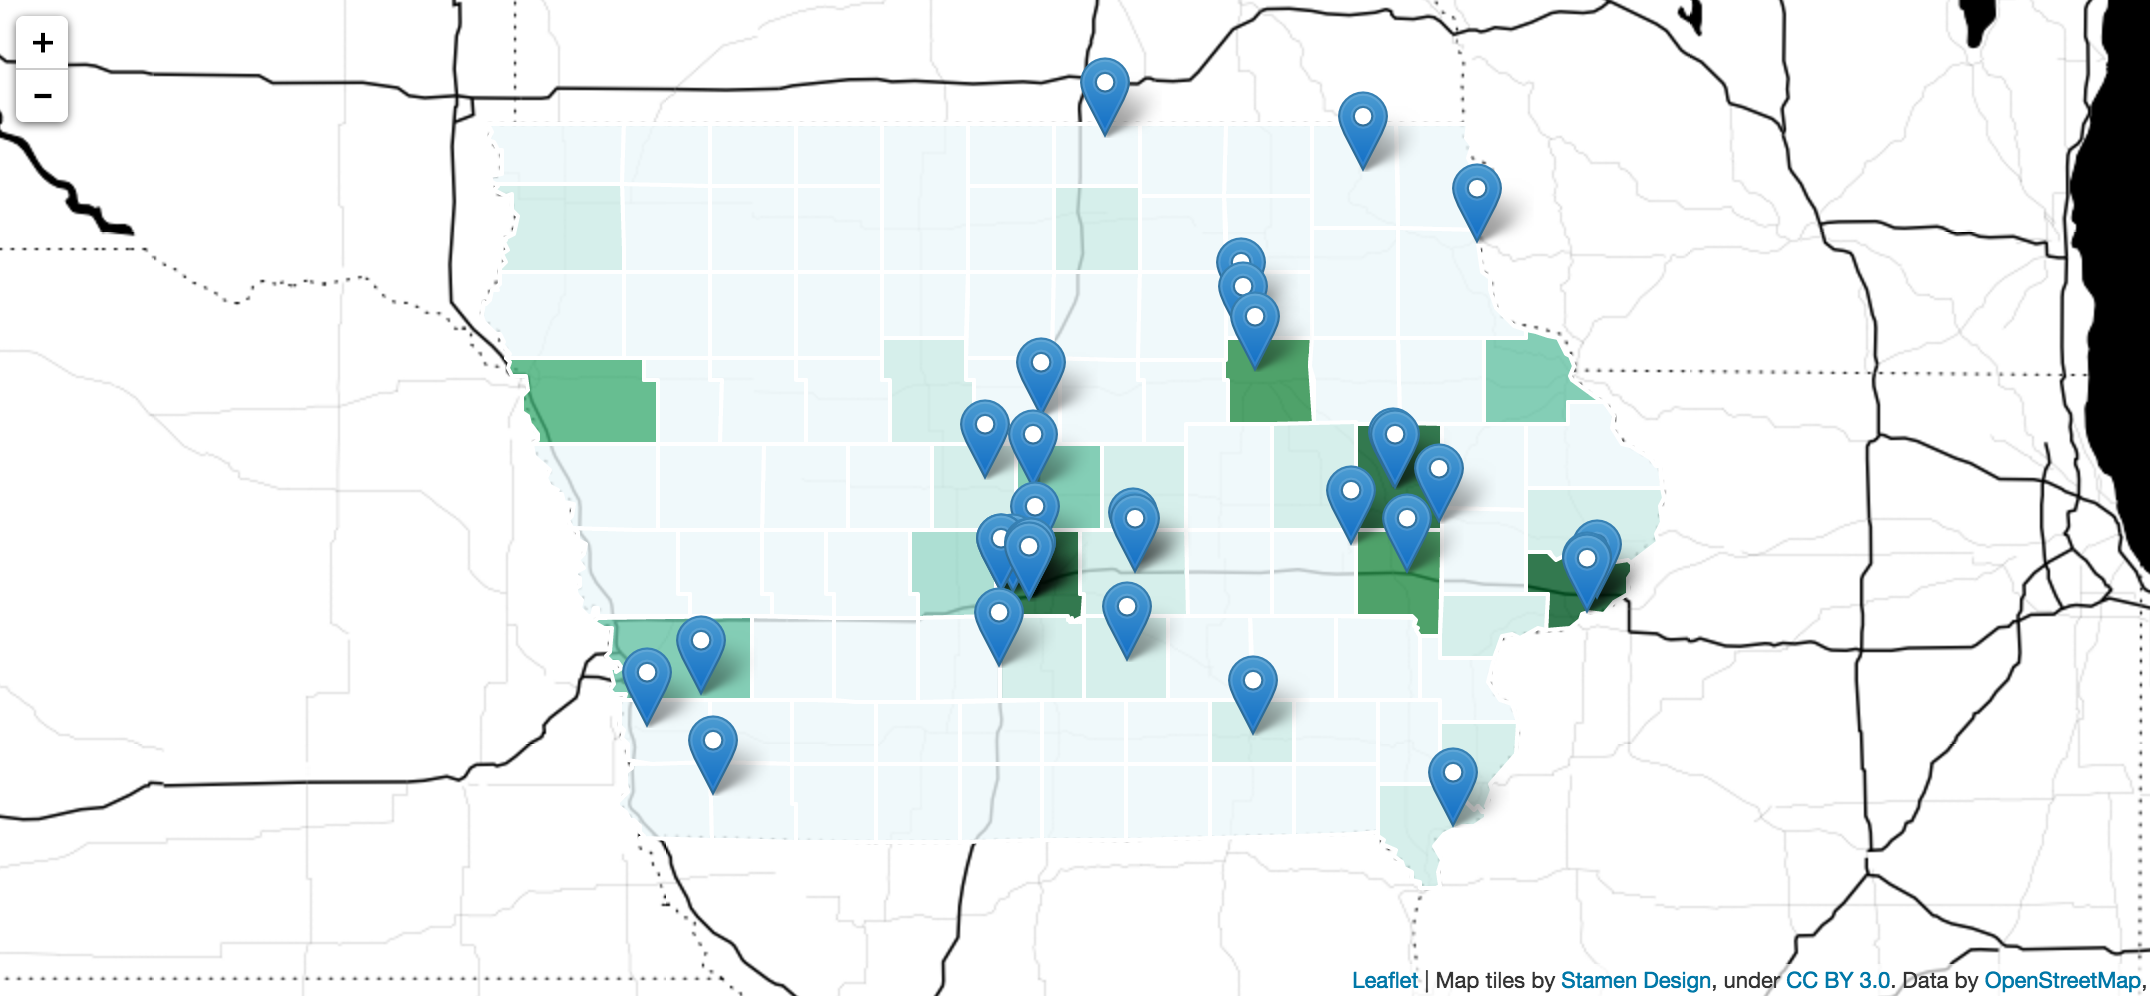
Now refresh the map one more time. You have created a beautiful choropleth map with markers on top of it. Congrats!
####Bonus: Adding popups to the markers
-
If we want to add popups to the markers on the map, we need to change our for loop to look like:
 for (var num = 0; num < breweries.length; num++) {
 	var brewery = breweries[num];
 	var brewery_lat = brewery["latitude"];
 	var brewery_long = brewery["longitude"];
 	var brewery_name = brewery["brewery"];
 	var brewery_address = brewery["address"];
 	var brewery_city = brewery["city"];

 	var marker = L.marker([brewery_lat, brewery_long]).addTo(map);

 	var popup_html = '<h3>' + brewery_name + '</h3>';
 	popup_html += '<div>' + brewery_address + '</div>';
 	popup_html += '<div>' + brewery_city + '</div>'

 	marker.bindPopup(popup_html);
 }
-
The first thing this does is find more information about each brewery we are looping through. In addition to its latitude and longitude information, the loop is now grabbing the brewery's name, address and city, which we will use in the popup.
-
It then creates the HTML for the popup using the properties we've grabbed.
-
Finally, it binds the HTML to the marker variable using Leaflet's handy bindPopup method. This makes it so the popup will show up when you click on the marker.