- [What's Cooking](#whats-cookinghttpswwwkagglecomcwhats-cooking)
| # of cuisines | 20 |
|---|---|
| 'italian' | 7838 |
| 'mexican' | 6438 |
| 'southern_us' | 4320 |
| 'indian' | 3003 |
| 'chinese' | 2673 |
| 'french' | 2646 |
| 'cajun_creole' | 1546 |
| 'thai' | 1539 |
| 'japanese' | 1423 |
| 'greek' | 1175 |
| 'spanish' | 989 |
| 'korean' | 830 |
| 'vietnamese' | 825 |
| 'moroccan' | 821 |
| 'british' | 804 |
| 'filipino' | 755 |
| 'irish' | 667 |
| 'jamaican' | 526 |
| 'russian' | 489 |
| 'brazilian' | 467 |
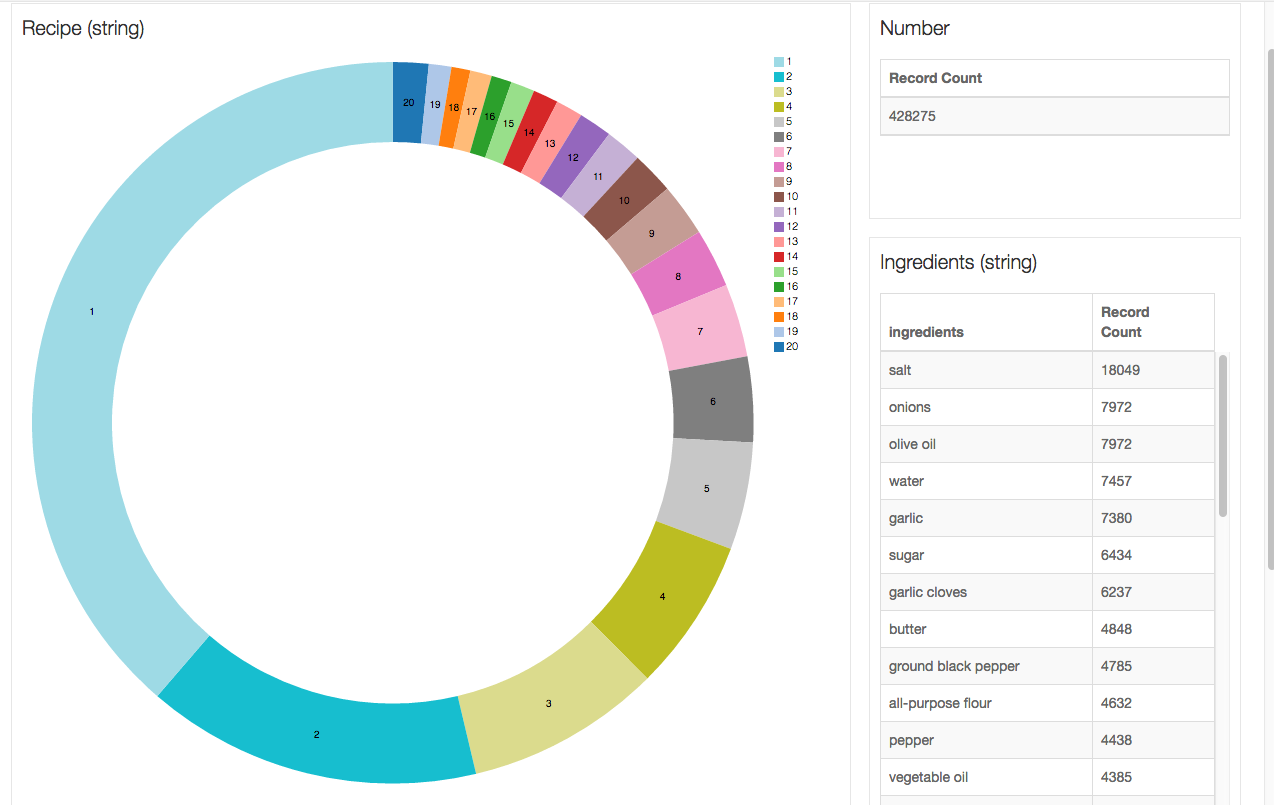
| # of ingredients | 6714 |
|---|---|
| 'salt' | 18049 |
| 'olive oil' | 7972 |
| 'onions' | 7972 |
| 'water' | 7457 |
| 'garlic' | 7380 |
| 'sugar' | 6434 |
| 'garlic cloves' | 6237 |
| 'butter' | 4848 |
| 'ground black pepper' | 4785 |
| 'all-purpose flour' | 4632 |
| 'pepper' | 4438 |
| 'vegetable oil' | 4385 |
| 'eggs' | 3388 |
| 'soy sauce' | 3296 |
| 'kosher salt' | 3113 |
| 'green onions' | 3078 |
| 'tomatoes' | 3058 |
| 'large eggs' | 2948 |
| 'carrots' | 2814 |
| 'unsalted butter' | 2782 |
| 'extra-virgin olive oil' | 2747 |
| 'ground cumin' | 2747 |
| 'black pepper' | 2627 |
| 'milk' | 2263 |
| 'chili powder' | 2036 |
| 'oil' | 1970 |
| 'red bell pepper' | 1939 |
| 'purple onion' | 1896 |
| 'scallions' | 1891 |
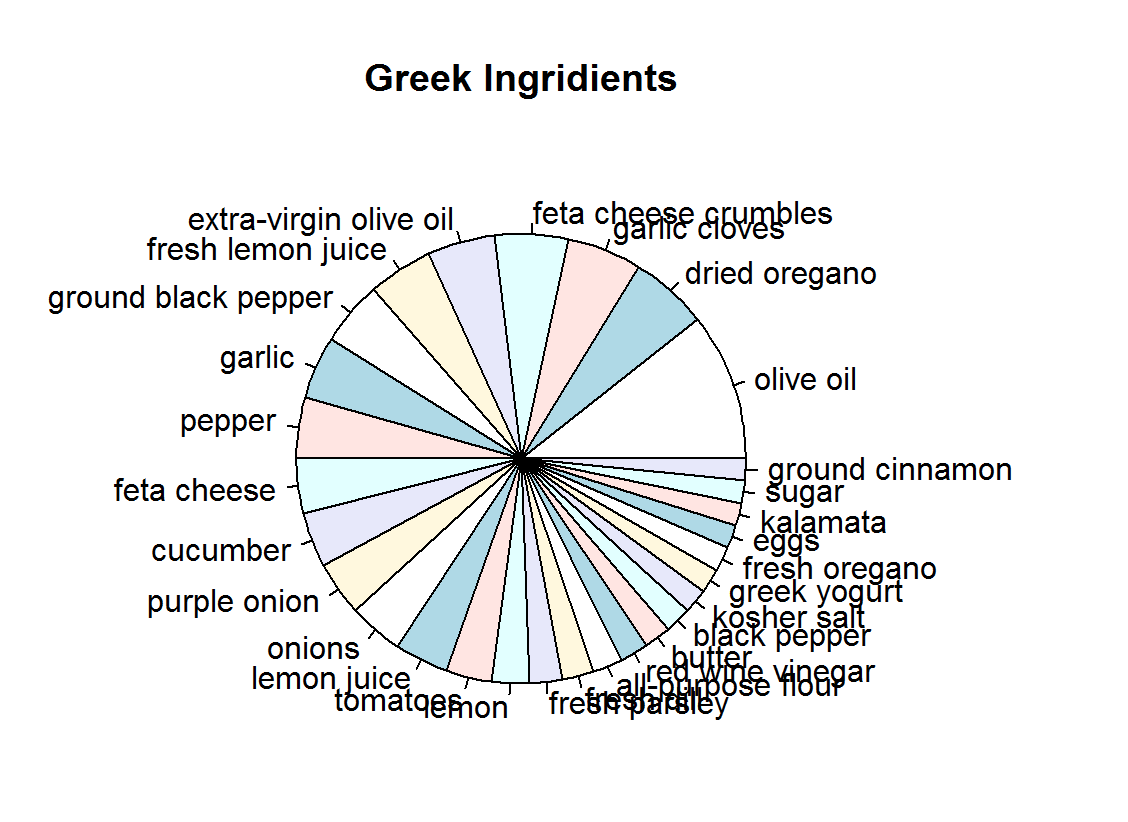
We graphed each cuisine and the number of ingredients used in each of their recipes in hopes that would be a differentiator. However
- the cuisines were very similar.
- Consistently around 63-65% accuracy (Full set results for trial/error)
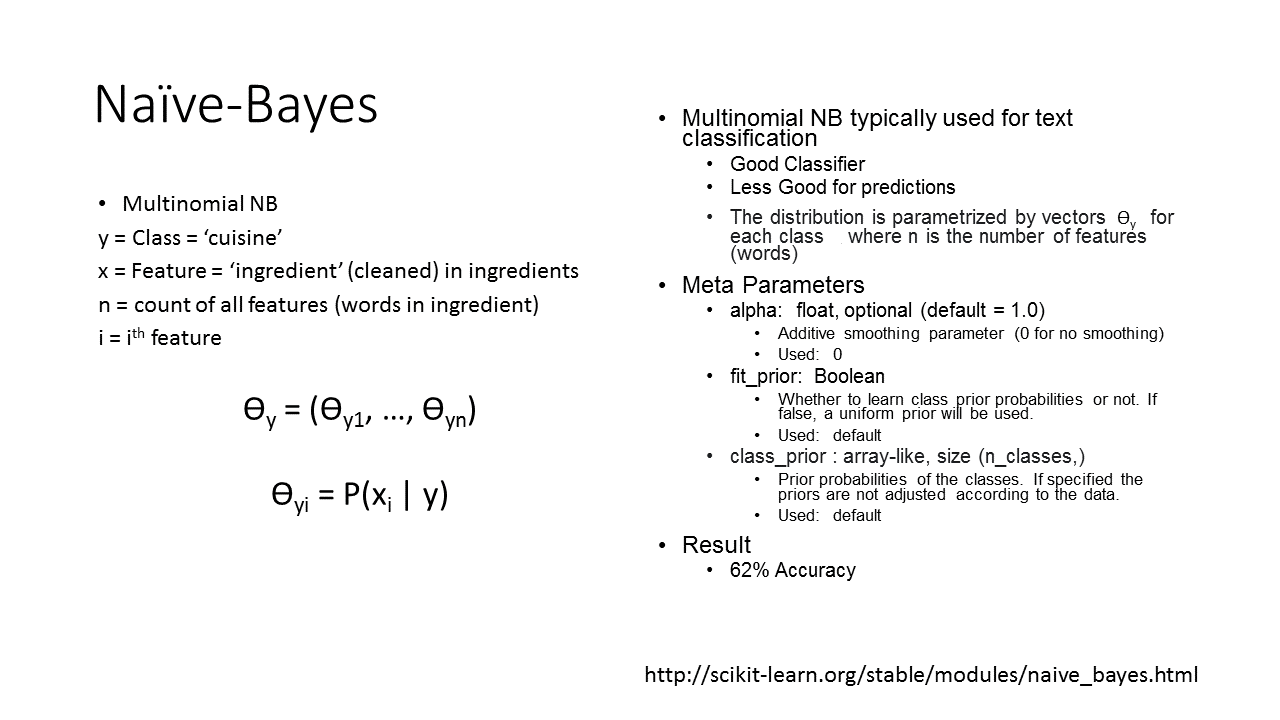
- Steps:
- Create bag of words (or ingredient phrases in this case) for train dataset
- Calculate tfidf for each ingredient and cuisine
- Use MultinomialNB model, with tfidf and accompanying cuisines, to match up recipes
- Predict based on cuisine with highest probability, calculated by summing cuisine probability for ingredient with probabilities higher than 0.4
- Higher accuracy when:
- Each recipe was a single "document"
- full ingredients were used rather than ingredient words
- cleaned for accents and lowercased
- common/meaningless modifiers removed
- hypens/parentheticals removed
- low alpha in NB model
- using MultinomialNB versus BernoulliNB
- Use probability of 0.4 as cut-off point for when an ingredient is used for classifying
- Used sum of quadratic probabilities (weight higher probabilities higher)
- TODO:
- Figure out probabilities where classification should be done with another model
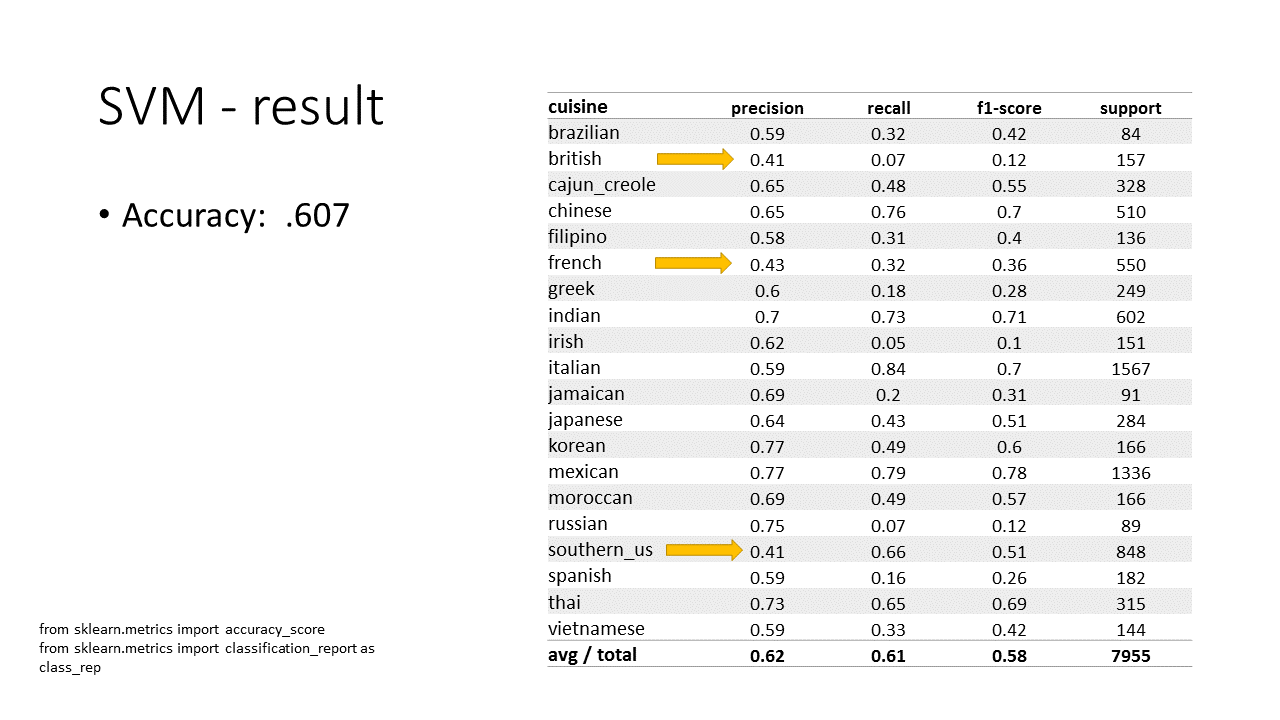
- Figure out which cuisines are frequently confused
- Perhaps combine with ingredient-type and words
- TODO:
- Further clean data
- Add ingredient count feature
- Increase word list
- Add cross validation
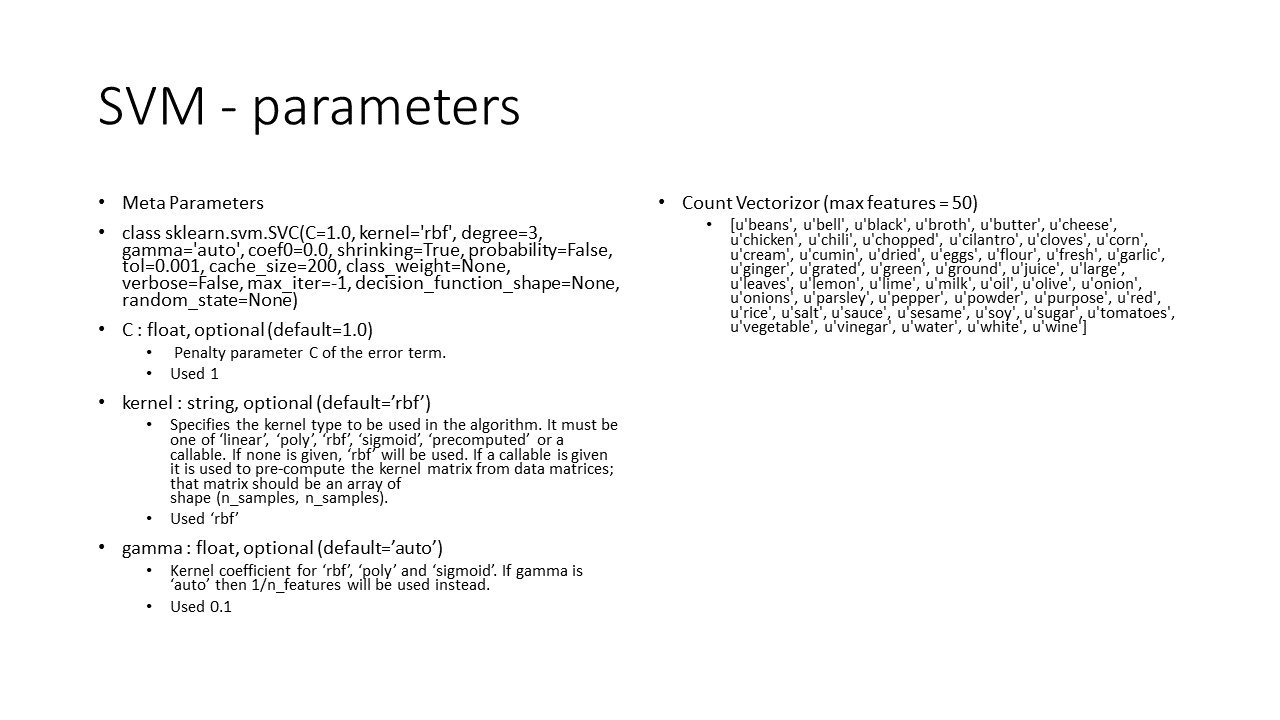
- Experiment with params (only optimized for γ)
- knn(train = traindf, test = testdf,cl = prc_train_labels, k=3)
| Cuisine | Predictions |
|---|---|
| brazilian | 0 0.044 0.000 0.000 0.000 |
| british | 0 0.026 0.000 0.000 0.000 |
| cajun_creole | |
| chinese | 0 0.188 0.000 0.000 0.000 |
| filipino | |
| french | 0 0.300 0.000 0.000 0.000 |
| greek | 0 0.600 0.000 0.000 0.000 |
| indian | 0 0.094 0.000 0.000 0.000 |
| irish | |
| italian | 1 6.371 0.006 0.025 0.001 |
| jamaican | |
| japanese | 3 0.893 0.150 0.043 0.004 |
| korean | 0 0.138 0.000 0.000 0.000 |
| mexican | 109 0.006 0.784 0.172 0.136 |
| moroccan | 0 0.020 0.000 0.000 0.000 |
| russian | 0 0.016 0.000 0.000 0.000 |
| southern_us | 0 1.365 0.000 0.000 0.000 |
| spanish | |
| thai | 0 0.065 0.000 0.000 0.000 |
| vietnamese | 0 0.012 0.000 0.000 0.000 |
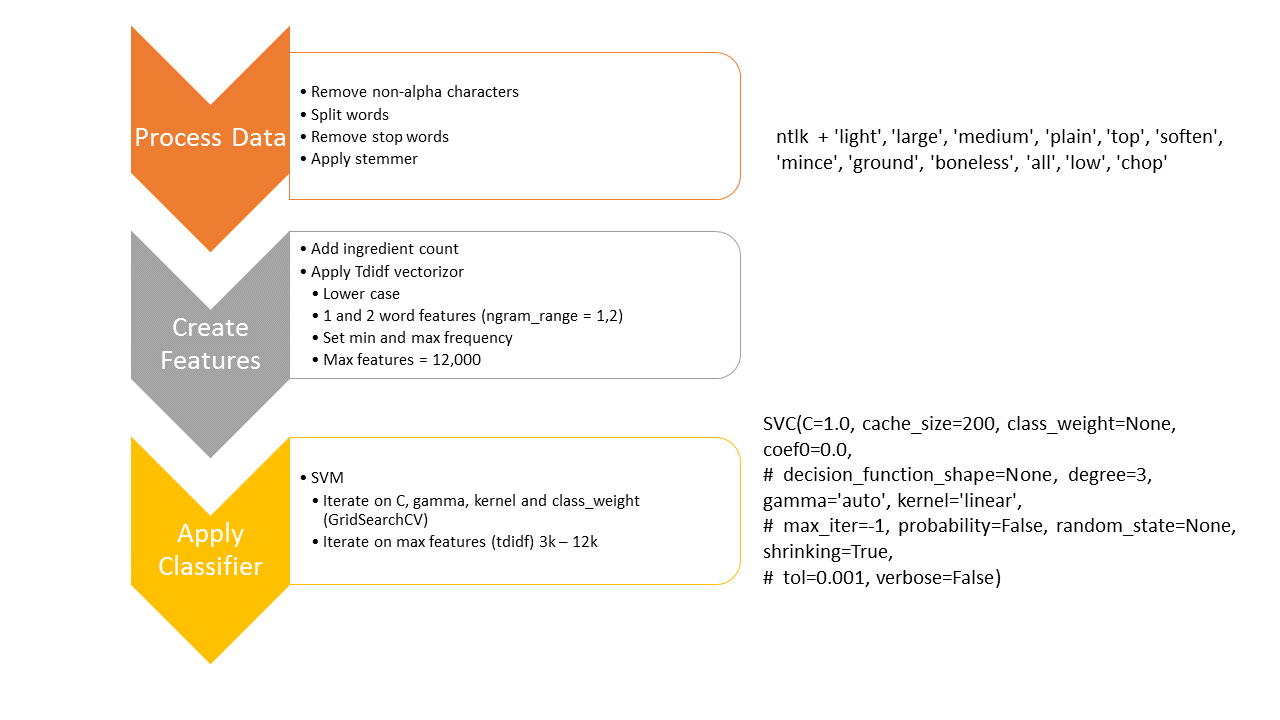
###Pipeline
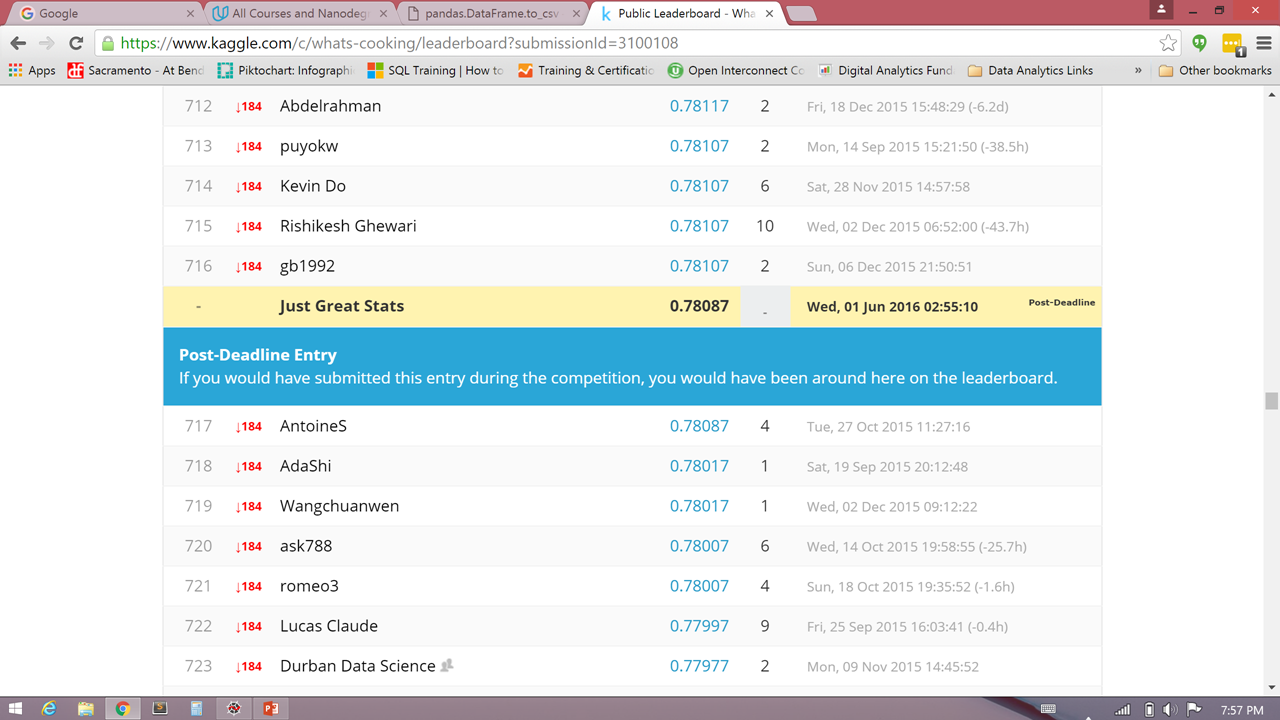
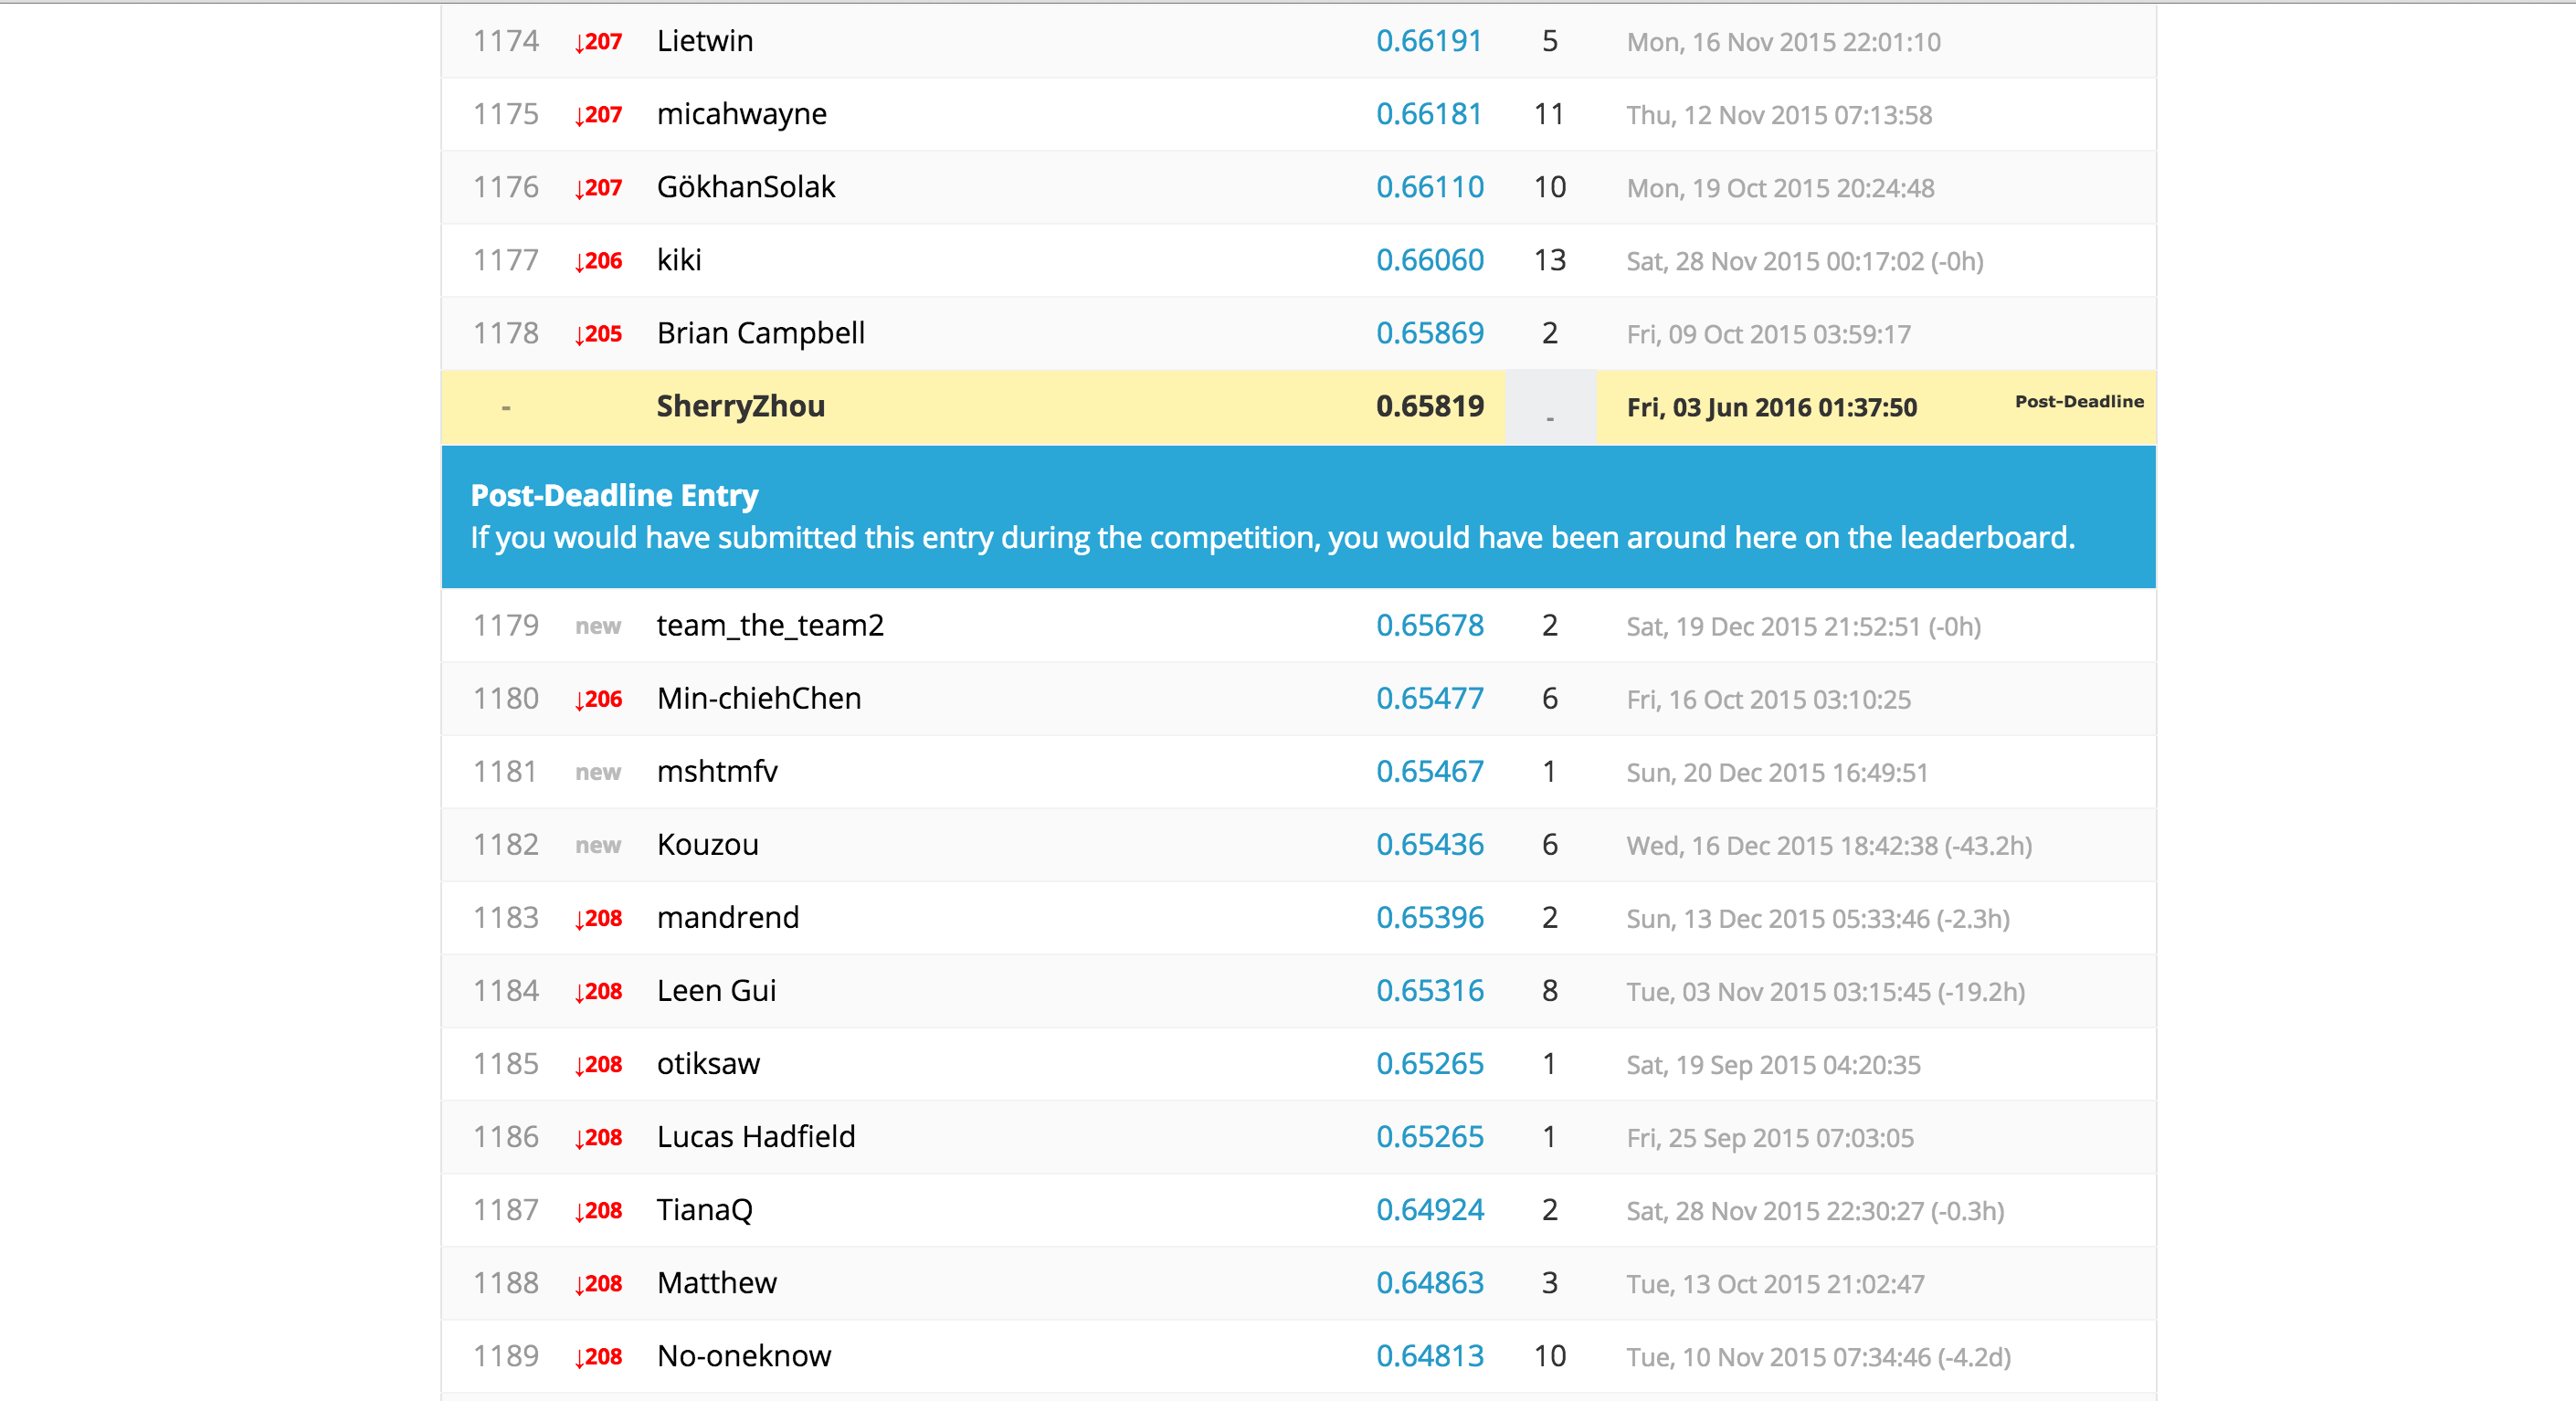
 ###Kaggle result
 ###Confusion Matrix
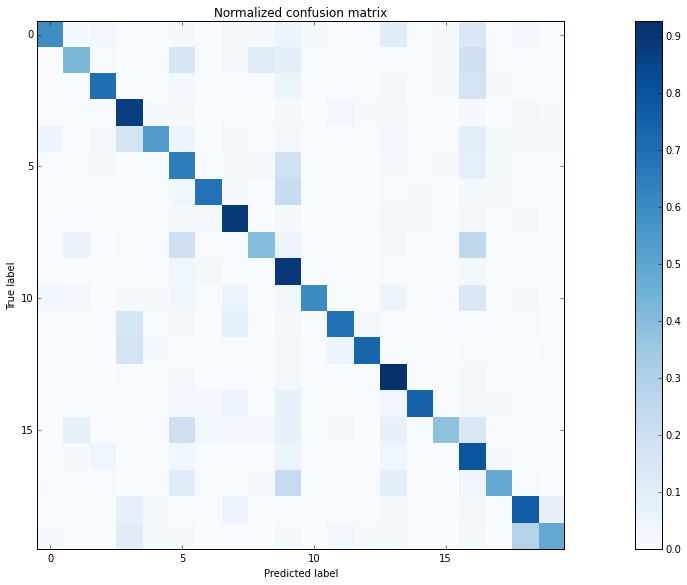 optimization
