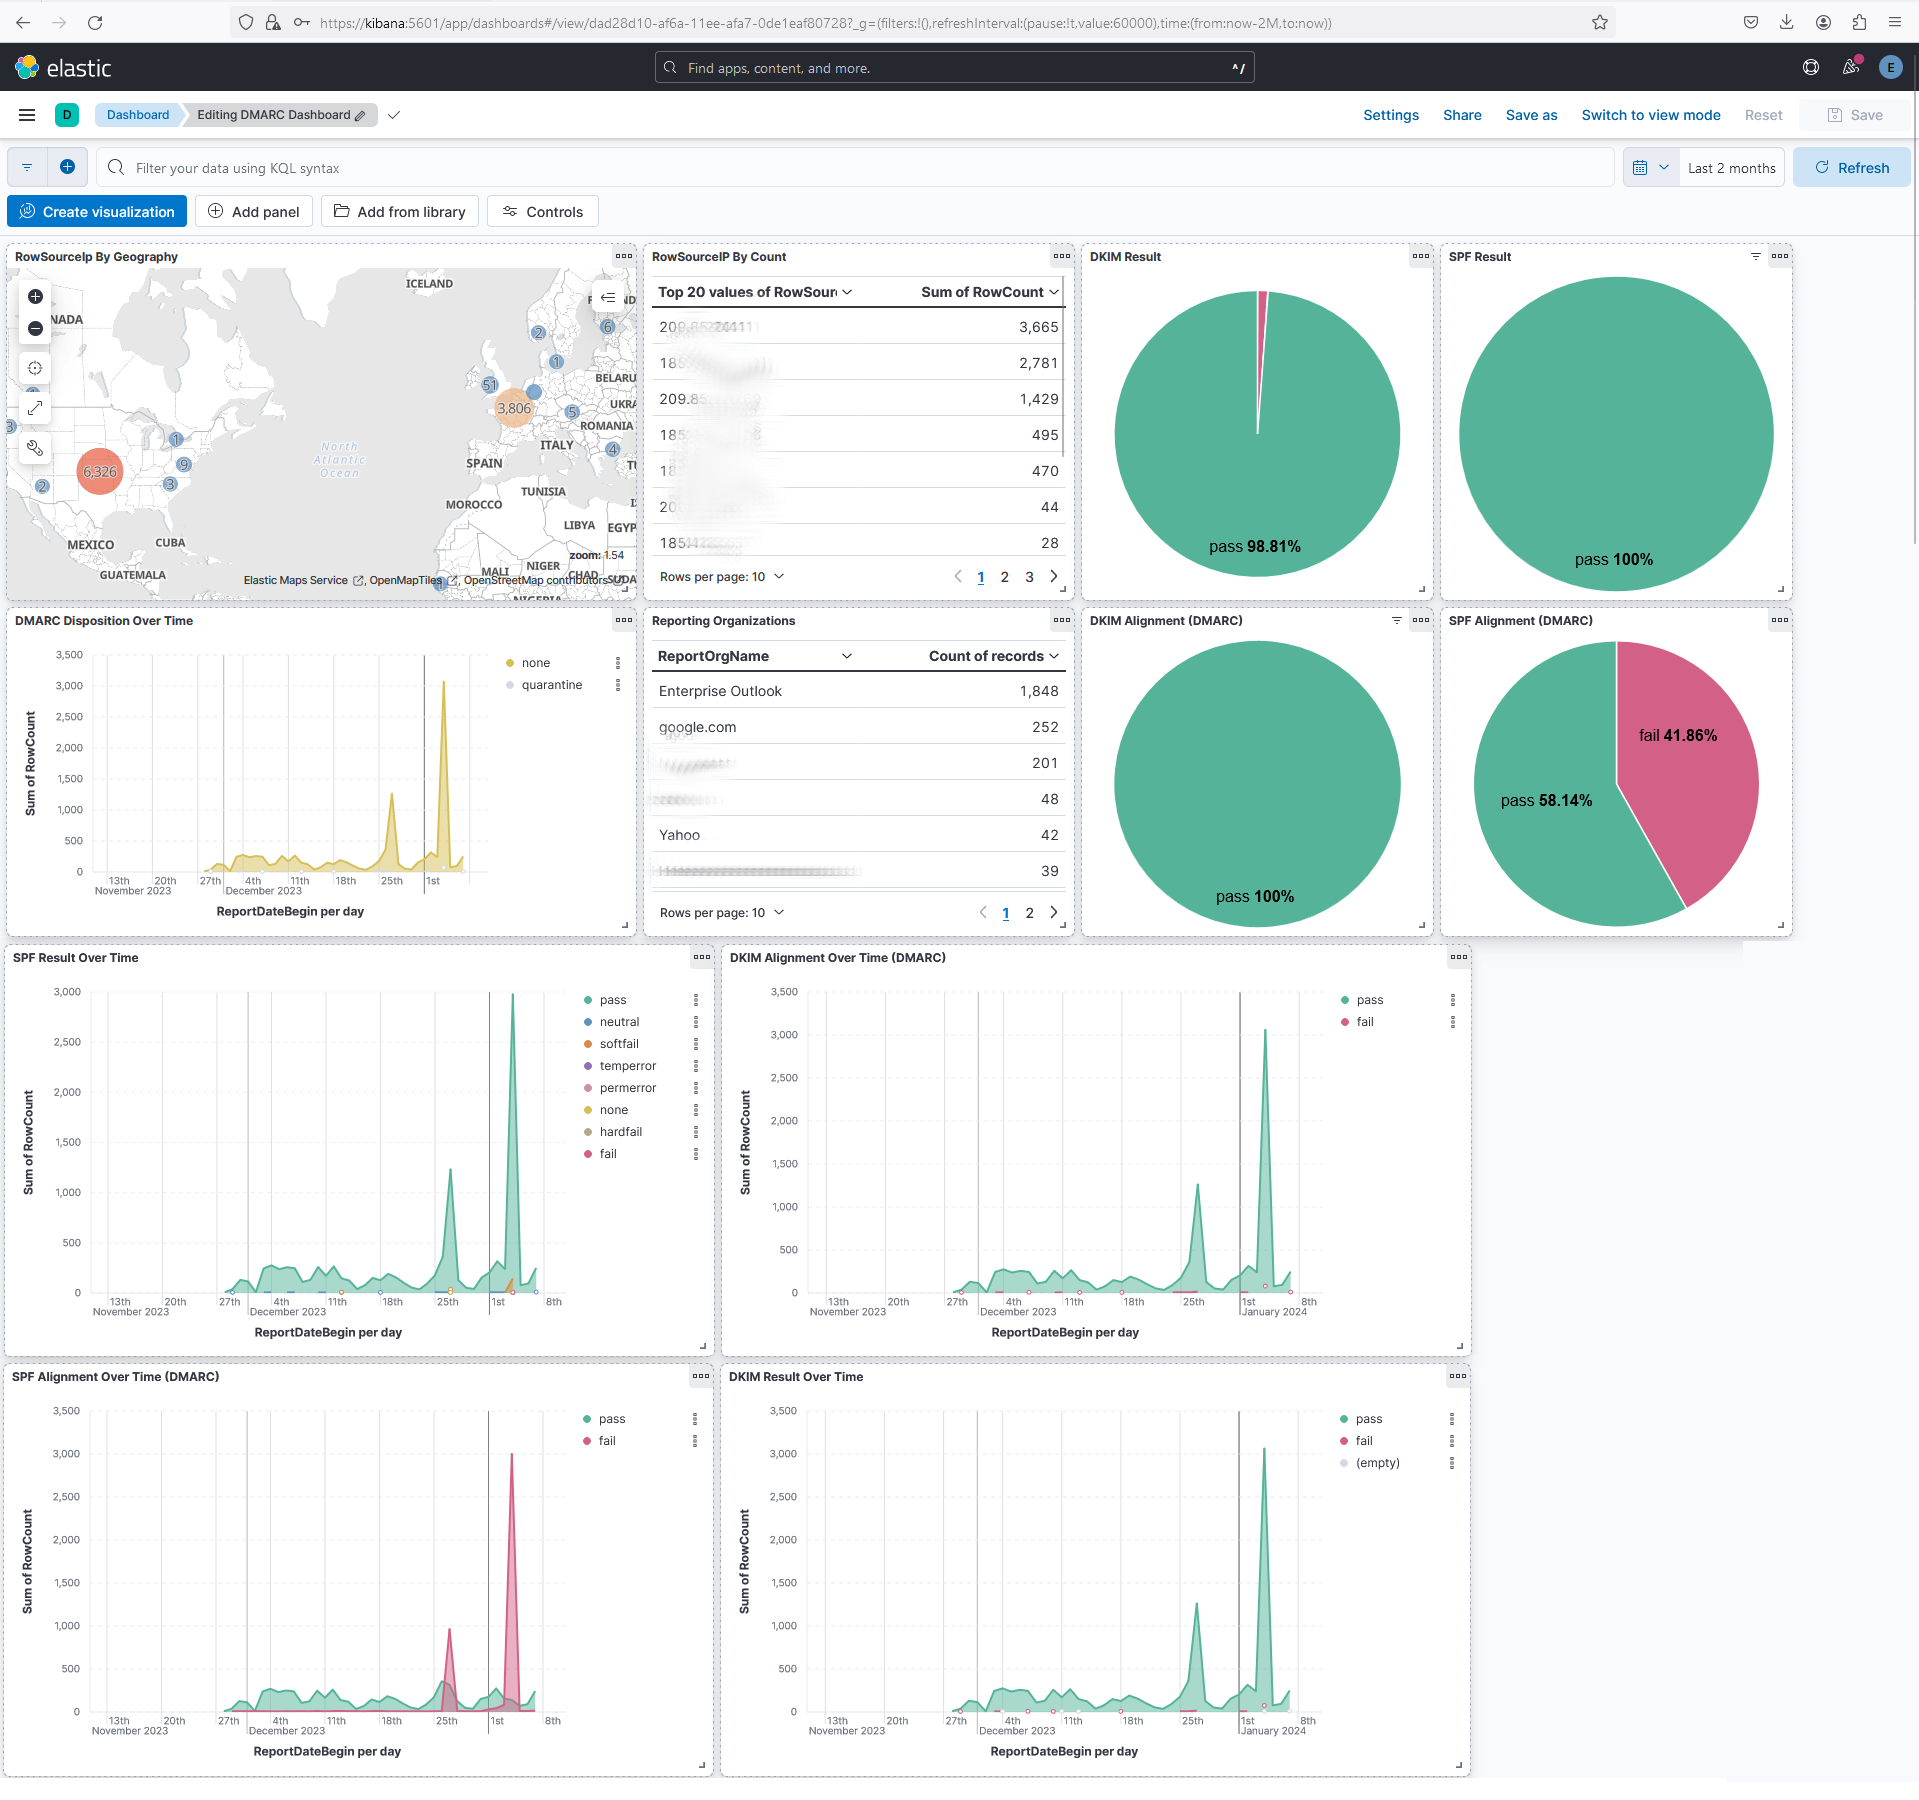
This project is explained by these videos:
- Demonstration: https://www.youtube.com/watch?v=XLTaKeJhI7c
- Explanation: https://www.youtube.com/watch?v=Fg3yAPe5y90
- SPF/DKIM/DMARC Tutorial: TBD
From my experience, you will need a minimum of 8GB memory. Underneath the hood, this system uses Elasticsearch which is a very powerful type of search engine database that requires the 8GB memory. I typically run this tool in an Ubuntu or RHEL 9.x virtual machine with 8GB of memory.
Assume the ~/ reflects your project directory, meaning the same directory as the file docker-compose.yml. So if your docker-compose.yml is in /home/stephanie/dmarc/docker-compose.yml, then all mentions of ~/ in the instructions below will mean /home/stephanie/dmarc/.
- Make a copy of
~/env.sampleto~/.env. Optional - customize settings for better security. - Type
cd ~/to return to project directory. - Type
docker-compose up --build -dto start up the ELK project. - Login with
elasticand the password found in the~/.envfile to ensure the entire ELK stack is up and running. - Open your web browser and go to
https://<ip address or hostname of kibana>:5601. - Accept any security warnings about untrusted SSL certificates.
- Make a copy of
~/parser/env.sampleto~/parser/.env. Optional - customize settings for better security. - Put all your zipped DMARC aggregation reports into the
~/parser/logs/zipped/. Sample DMARC aggregration reports can be copied from~/parser/logs/zipped-sample/. The zipped DMARC reports should end with any of the following filename extensions:*.gzor*.zip. - Type
docker exec -it dmarc-parser-1 ./start.shto extract, transform and load DMARC aggregation data into your ELK stack. Note: depending on the version of your operating system or docker or other configurations, the container might bedmarc_parser_1ordmarc-parser-1or something slightly different. Review the output ofdocker ps -aordocker ps -a --format "table {{.Names}}\t{{.RunningFor}}"to determine your container names. - Go to your web browser in Kibana and go to Dashboards to see your DMARC Dashboard.
