Learning environment for prometheus
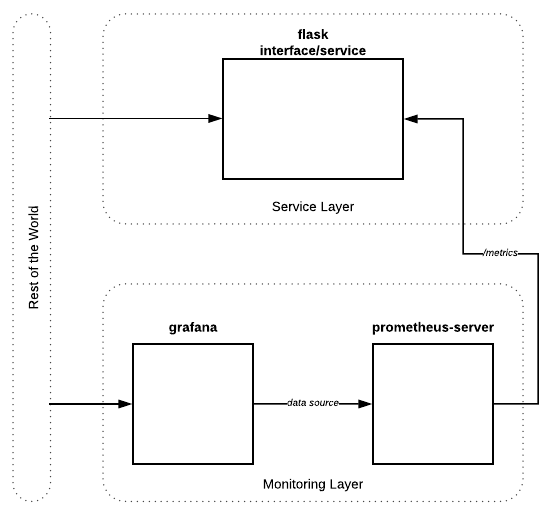
- Set up Flask with a "flaky" endpoint.
- Set up "prometheus_flask_exporter" client to report metrics.
- Set up Prometheus server to collect and monitor metrics from the Flask service.
- Set up Grafana to accept a prometheus compatible data source and visualize different metrics.
- Integrate a simple multi-threaded load-tester to simulate load conditions on the flaky endpoint.
- Define concrete metrics
- Evaluate performance with multi-threaded loads across different endpoints.
$ docker-compose up --build
- 5000 -> Flask service
- 9090 -> Prometheus
- 3000 -> Grafana