Motivation | Usage | Docker Compose | Metrics transformation | License
A Docker image on which Prometheus can scrape Kubernetes metrics provided by metrics-server. The image can run anywhere where Prometheus can use it as a target, even in Kubernetes itself.
metrics-server seems to be the successor of heapster for Kubernetes monitoring. However, metrics-server currently only provides its metrics in JSON format via the Kubernetes API server.
Prometheus on the other hand expects a special text-based format. So in order for Prometheus to scrape those metrics, they must be transparently transformed from JSON to its own format on every request.
Other than metrics-server itself, this Docker container provides additional metrics metadata that are
retrieved via kubectl API calls and included in the Prometheus output.
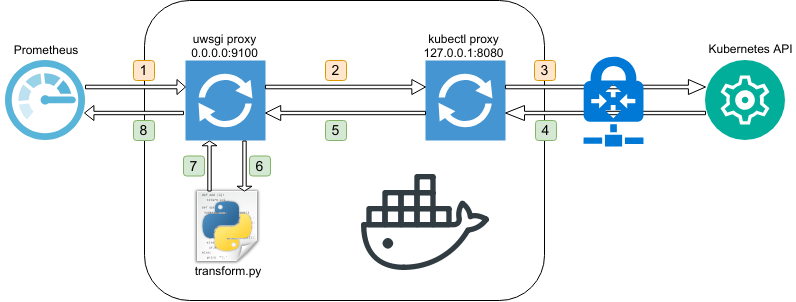
The following diagram illustrates how the format transformation is achieved:
- Prometheus scrapes the Docker container on
:9100/metrics - Inside the Docker container uwsgi is proxying the request to kube proxy
- kube-proxy reads the provided config file and tunnels the request into Kubernetes to metrics-server
- metrics-server replies with JSON formatted metrics
- kube proxy forwards the request back to uwsgi
- uwsgi calls transform.py
- transform.py rewrites the JSON into Prometheus readable output and hands the result back to uwsgi
- uwsgi sends the final response back to Prometheus
Simply run the Docker image with a kube config mounted into /etc/kube/config.
$ docker run -d \
    -p 9100:9100 \
    -v ${HOME}/.kube/config:/etc/kube/config:ro \
    cytopia/metrics-server-prom
If your kube config contains multiple contexts, you can tell metrics-server-prom what context
to use, to connect to the cluster.
$ docker run -d \
    -p 9100:9100 \
    -v ${HOME}/.kube/config:/etc/kube/config:ro \
    -e KUBE_CONTEXT=my-context \
cytopia/metrics-server-promprometheus.yml:
scrape_configs:
  - job_name: 'kubernetes'
    scrape_interval: '15s'
    metrics_path: '/metrics'
    static_configs:
      - targets:
- <DOCKER_IP_ADDRESS>:9100To test this out locally, this repository ships an example Docker Compose setup with metrics-server-prom and Prometheus.
- Navigate to example/
- Copy
env-exampleto.env - Adjust
KUBE_CONTEXTin.env - Run it
docker-compose up
metrics-server provices metrics in the following format:
{
  "kind": "PodMetricsList",
  "apiVersion": "metrics.k8s.io/v1beta1",
  "metadata": {
    "selfLink": "/apis/metrics.k8s.io/v1beta1/pods"
  },
  "items": [
    {
      "metadata": {
        "name": "etcd-server-events-abc",
        "namespace": "kube-system",
        "selfLink": "/apis/metrics.k8s.io/v1beta1/namespaces/kube-system/pods/etcd-server-events-ip-10-30-78-99.eu-central-1.compute.internal",
        "creationTimestamp": "2018-08-20T03:19:05Z"
      },
      "timestamp": "2018-08-20T03:19:00Z",
      "window": "1m0s",
      "containers": [
        {
          "name": "etcd-container",
          "usage": {
            "cpu": "7m",
            "memory": "125448Ki"
          }
        }
      ]
    },

  ]
}
metrics-server-prom transforms it to the following format:
Note: Additional metadata (node and ip) have been added.
# HELP kube_metrics_server_pod_cpu The CPU time of a pod in seconds.
# TYPE kube_metrics_server_pod_cpu gauge
kube_metrics_server_pod_cpu{node="ip-10-30-78-99.eu-central-1.compute.internal",pod="etcd-server-events-abc",ip="10.30.62.138",container="etcd-container",namespace="kube-system"} 420
# HELP kube_metrics_server_pod_mem The memory of a pod in KiloBytes.
# TYPE kube_metrics_server_pod_mem gauge
kube_metrics_server_pod_mem{node="ip-10-30-78-99.eu-central-1.compute.internal",pod="etcd-server-events-abc",ip="10.30.62.138",container="etcd-container",namespace="kube-system"} 128475136
Copyright (c) 2018 cytopia


