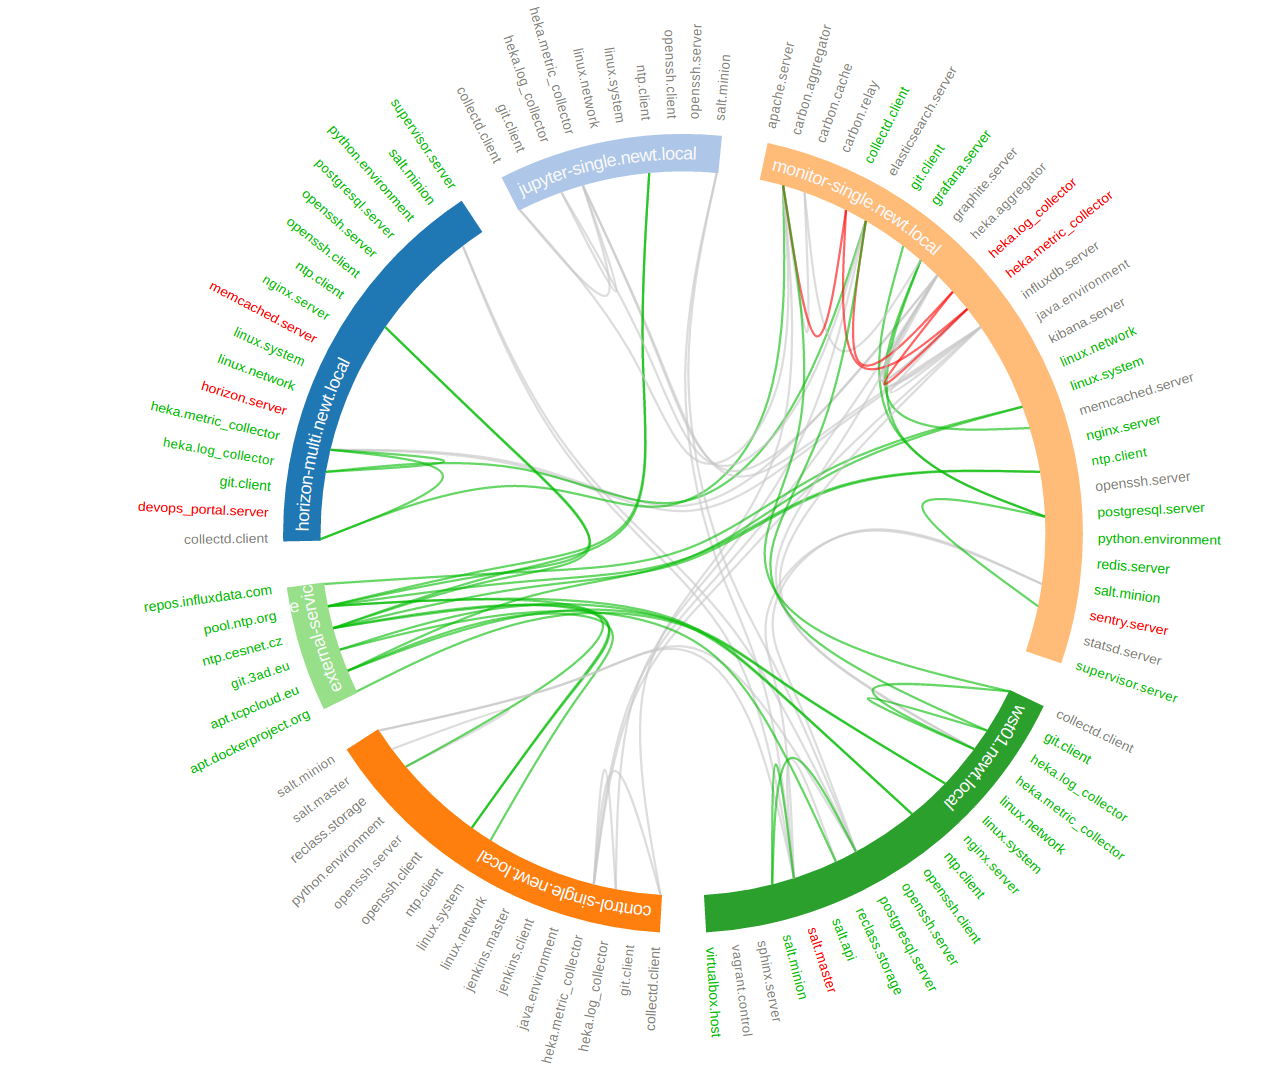
The aim of this project is to acquire live infrastructure topology data from any resource provider for further relational analysis and visualisations.
The pull approach for scraping endpoint APIs is supported for the moment, but the processing push from target services will be supported.
Currently supported resource metadata providers are:
- Kubernetes clusters
- OpenStack clouds
- Amazon web services
- SaltStack infrastructures
- Terraform templates
- Jenkins pipelines
The following resource providers are to be intergrated in near future.
- GCE and Azure clouds
- Cloudify TOSCA blueprints
- MAAS servers
- JUJU templates
From these resource providers we are able to capture all available resources for given
The output of scraping is directed graph that can be subject for further analysis. We can perform several transformation functions on the graphs.
You can alter the scraped strusctured in several ways. Either you want to get the subset of the resources (vertices and edges) or you want to combine multiple graphs and link the same nodes in each.
To slice and dice is to break a body of information down into smaller parts or to examine it from different viewpoints that we can understand it better.
In cooking, you can slice a vegetable or other food or you can dice it (which means to break it down into small cubes). One approach to dicing is to first slice and then cut the slices up into dices.
In data analysis, the term generally implies a systematic reduction of a body of data into smaller parts or views that will yield more information. The term is also used to mean the presentation of information in a variety of different and useful ways. In our case we find useful subgraphs of the infrastructures.
For example in OpenStack infrastructure we can show the aggregate zone -
hypervisor - instance relations and show the quantitative properties
of hypervisors and instances. The properties can be used RAM or CPU, runtime -
the age of resources or any other property of value.
Another example would be filtering of resources by tenant or stack attributions. This reduces the number of nodes to the reasonable amount.
On other hand you want to combine several graphs to create one overlaying
graph. This is very useful to combine in other ways undelated resources. For
example we can say that OpenStack Server or AWS Instance and Salt
Minion are really the same resources.
With the relational information we are now able to corellate resources and joined topologies from varius information sources. This gives you the real power, while having the underlying relational structure, you can gather unstructured metrics, events, alarms and put them into proper context in you managed resources.
The metrics collected from you infrastrucute can be assigned to various vertices and edges in your network. This can give you more insight to the utilisation of depicted infrastructures.
You can have the following query to the prometheus server that gives you the rate of error response codes goint through a HAproxy for example.
sum(irate(haproxy_http_response_5xx{
    proxy=~"glance.*",
    sv="FRONTEND"
}[5m]))
Or you can have the query with the same result to the InfluxDB server:
SELECT sum("count")
    FROM "openstack_glance_http_response_times"
    WHERE "hostname" =~ /$server/
        AND "http_status" = '5xx'
        AND $timeFilter
    GROUP BY time($interval)
fill(0)
Having these metrics you can assign numerical properties of your relational nodes with these values and use them in correct context.
As you can query the time-series databases, you are able to query also the ElasticSearch for events.
"searchSourceJSON": {
    "index": "log-*",
    "query": {
        "query_string": {
            "query": "*",
            "analyze_wildcard": true
        }
    },
    "filter": []
}
The events are transformed to numerical representation and create again numerical properies of both nodes and vertices.
You can corellate the output of the alarm evaluators to dynamically set the status of resources. You can use the functional status of checks from Prometheus Alarmmanager, Nagios or Sensu.
Different data require different diagram visualization. Diagrams are symbolic representation of information according to some visualization technique. Every time you need to emphasise different qualities of displayed resources you can choose from several layouts to display the data.
For most of the cases we will be dealing with network data that do not have any single root or beginning.
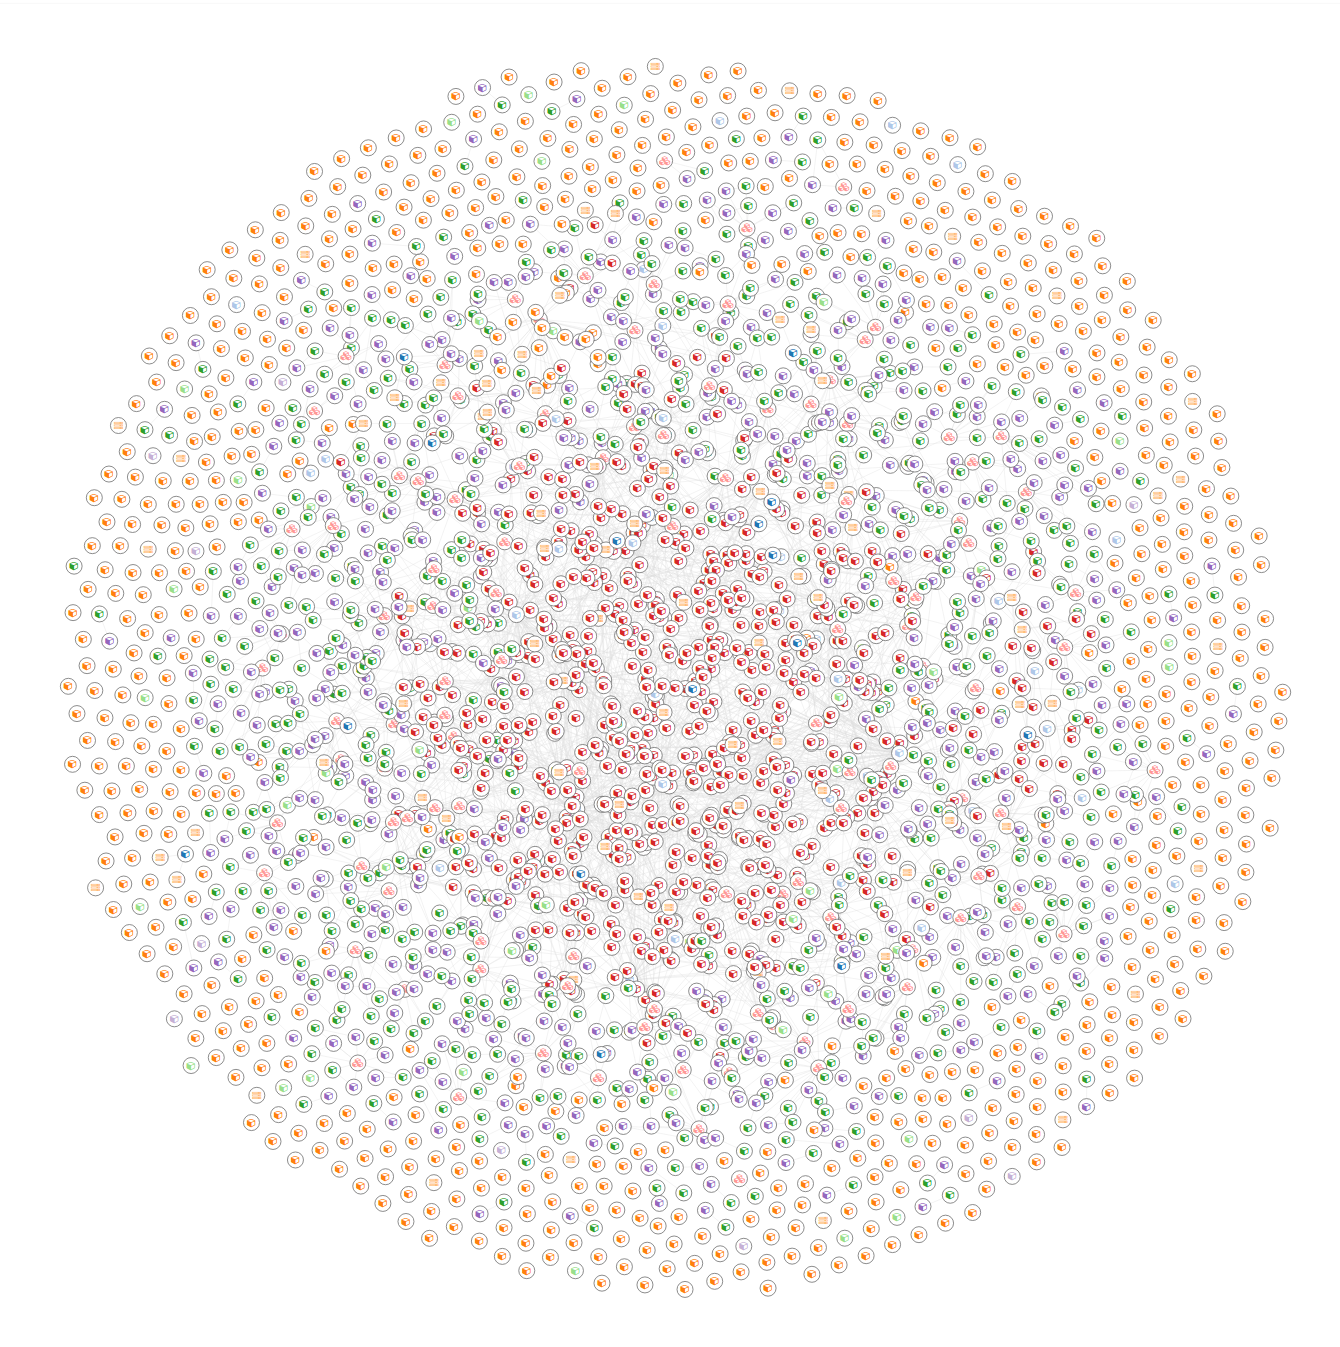
Force-directed graph drawing algorithms are used for drawing graphs in an aesthetically pleasing way. Their purpose is to position the nodes of a graph in two-dimensional or three-dimensional space so that all the edges are of more or less equal length and there are as few crossing edges as possible, by assigning forces among the set of edges and the set of nodes, based on their relative positions, and then using these forces either to simulate the motion of the edges and nodes or to minimize their energy.
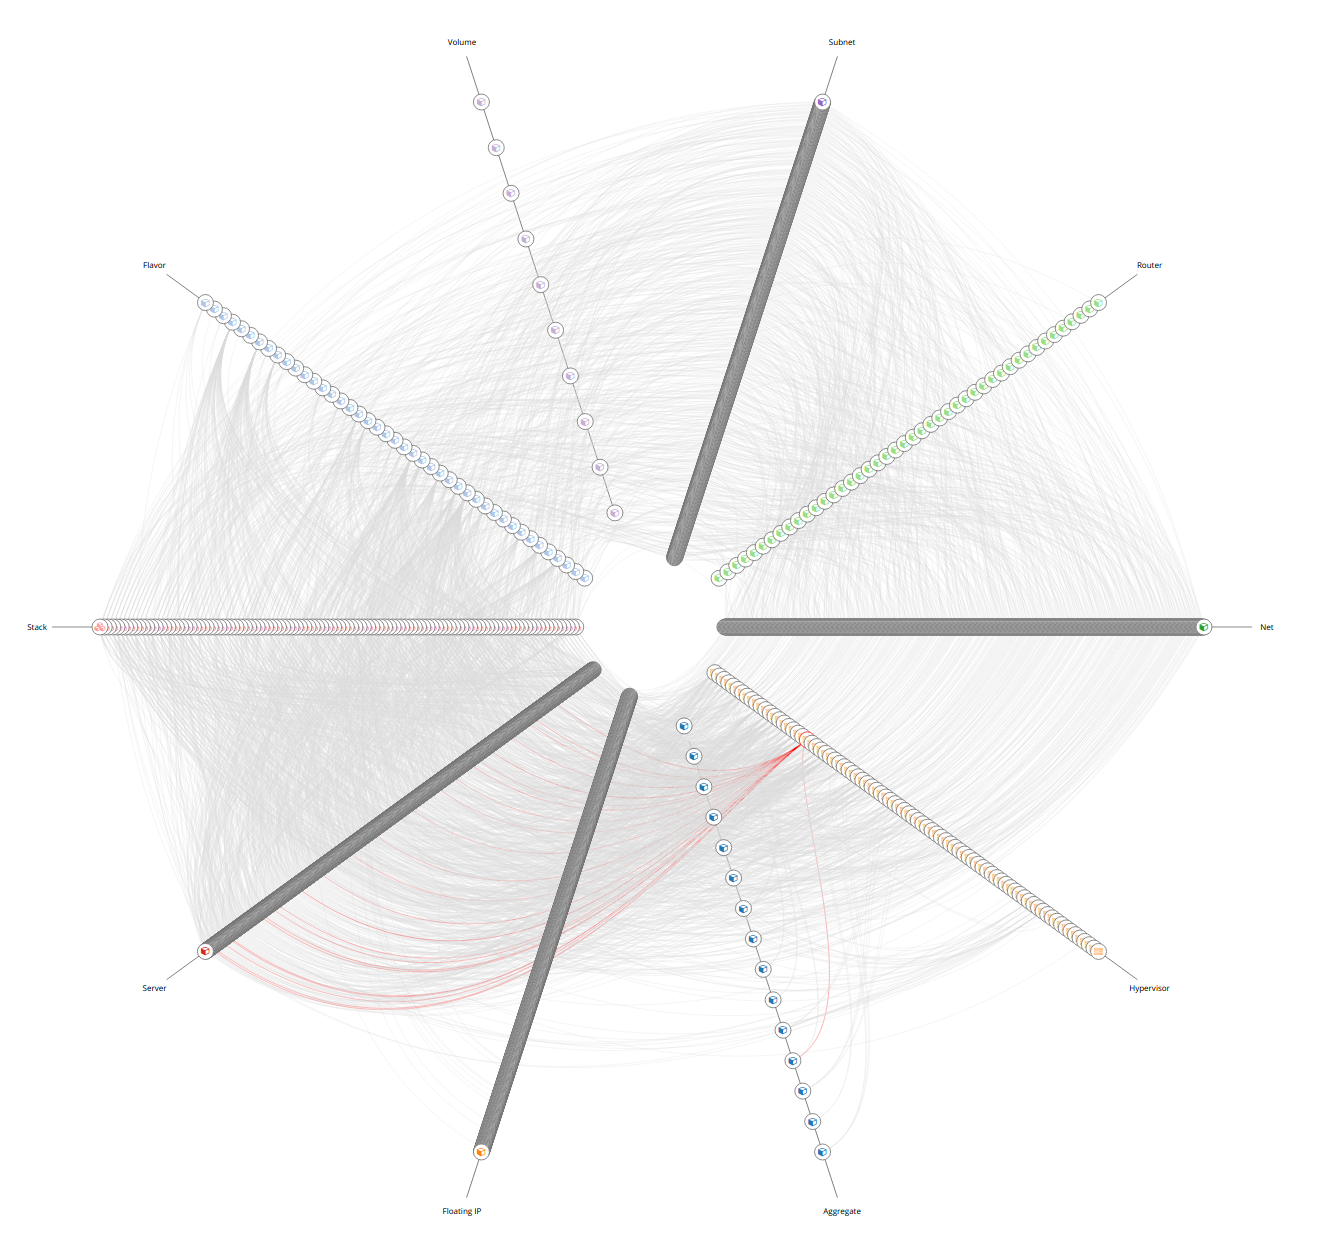
The hive plot is a visualization method for drawing networks. Nodes are mapped to and positioned on radially distributed linear axes — this mapping is based on network structural properties. Edges are drawn as curved links. Simple and interpretable.
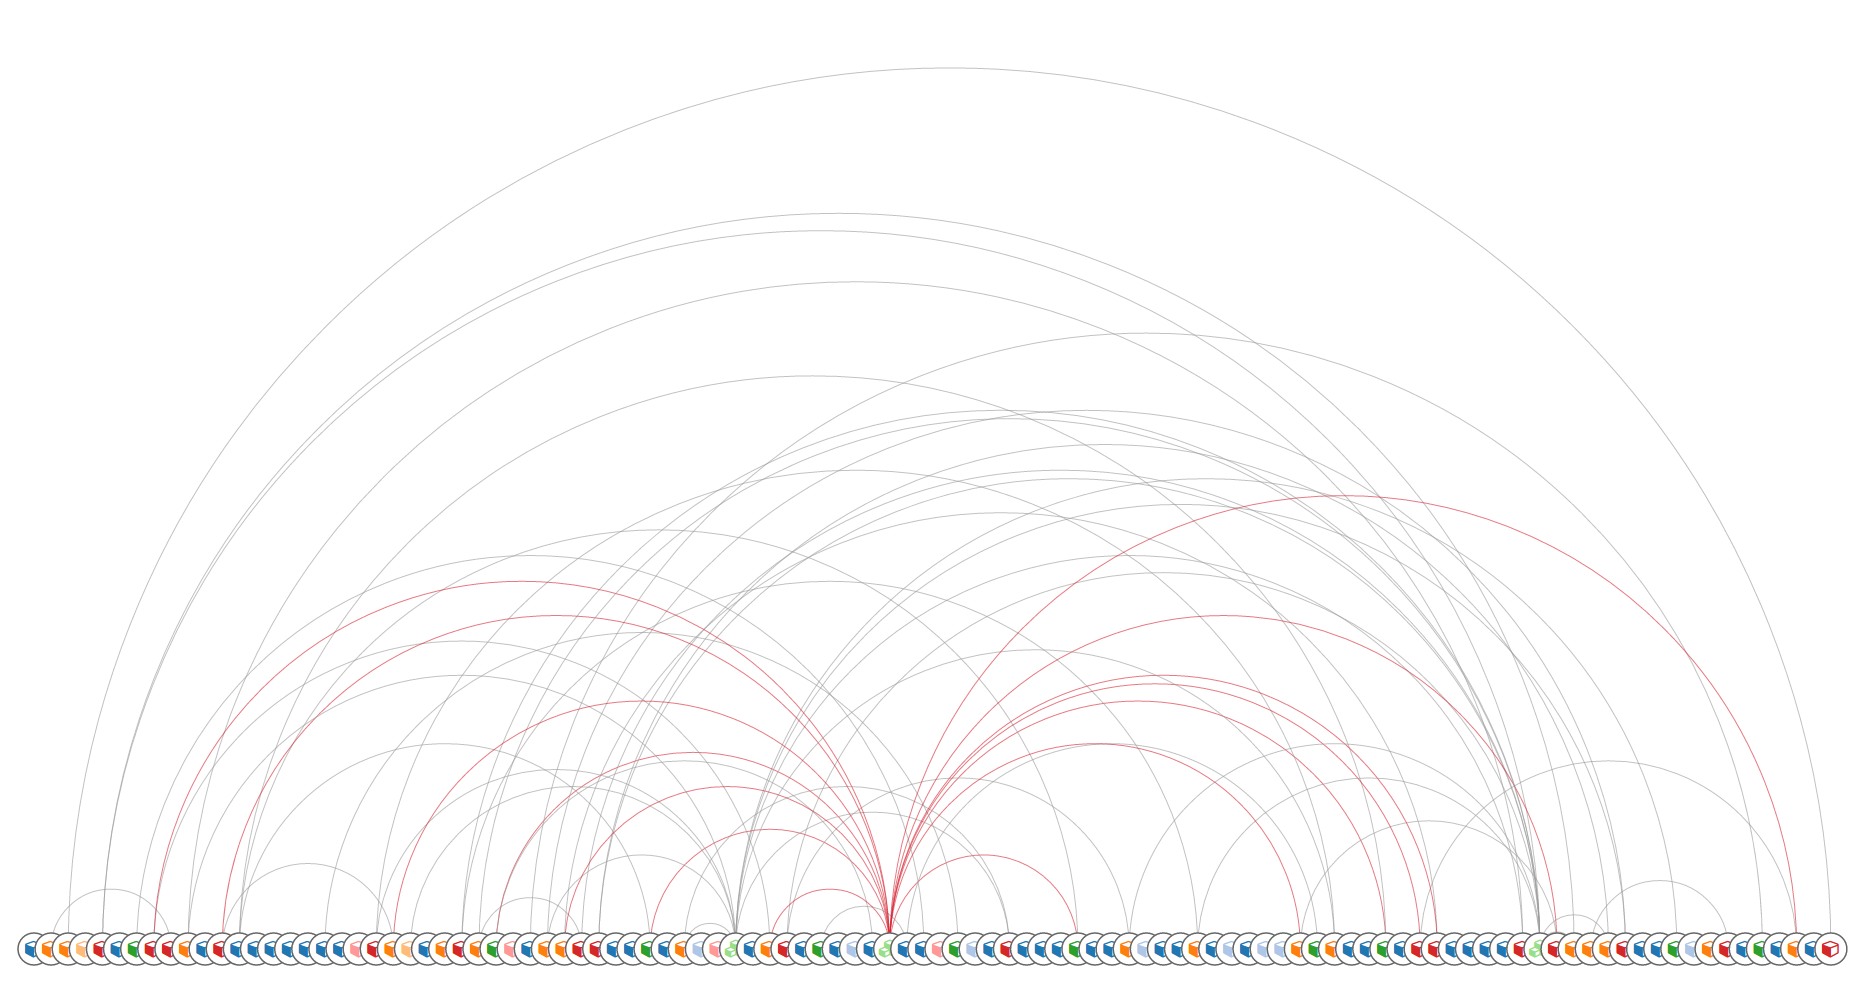
An arc diagram is a style of graph drawing, in which the vertices of a graph are placed along a line in the Euclidean plane, with edges being drawn as semicircles in one of the two halfplanes bounded by the line, or as smooth curves formed by sequences of semicircles. In some cases, line segments of the line itself are also allowed as edges, as long as they connect only vertices that are consecutive along the line.
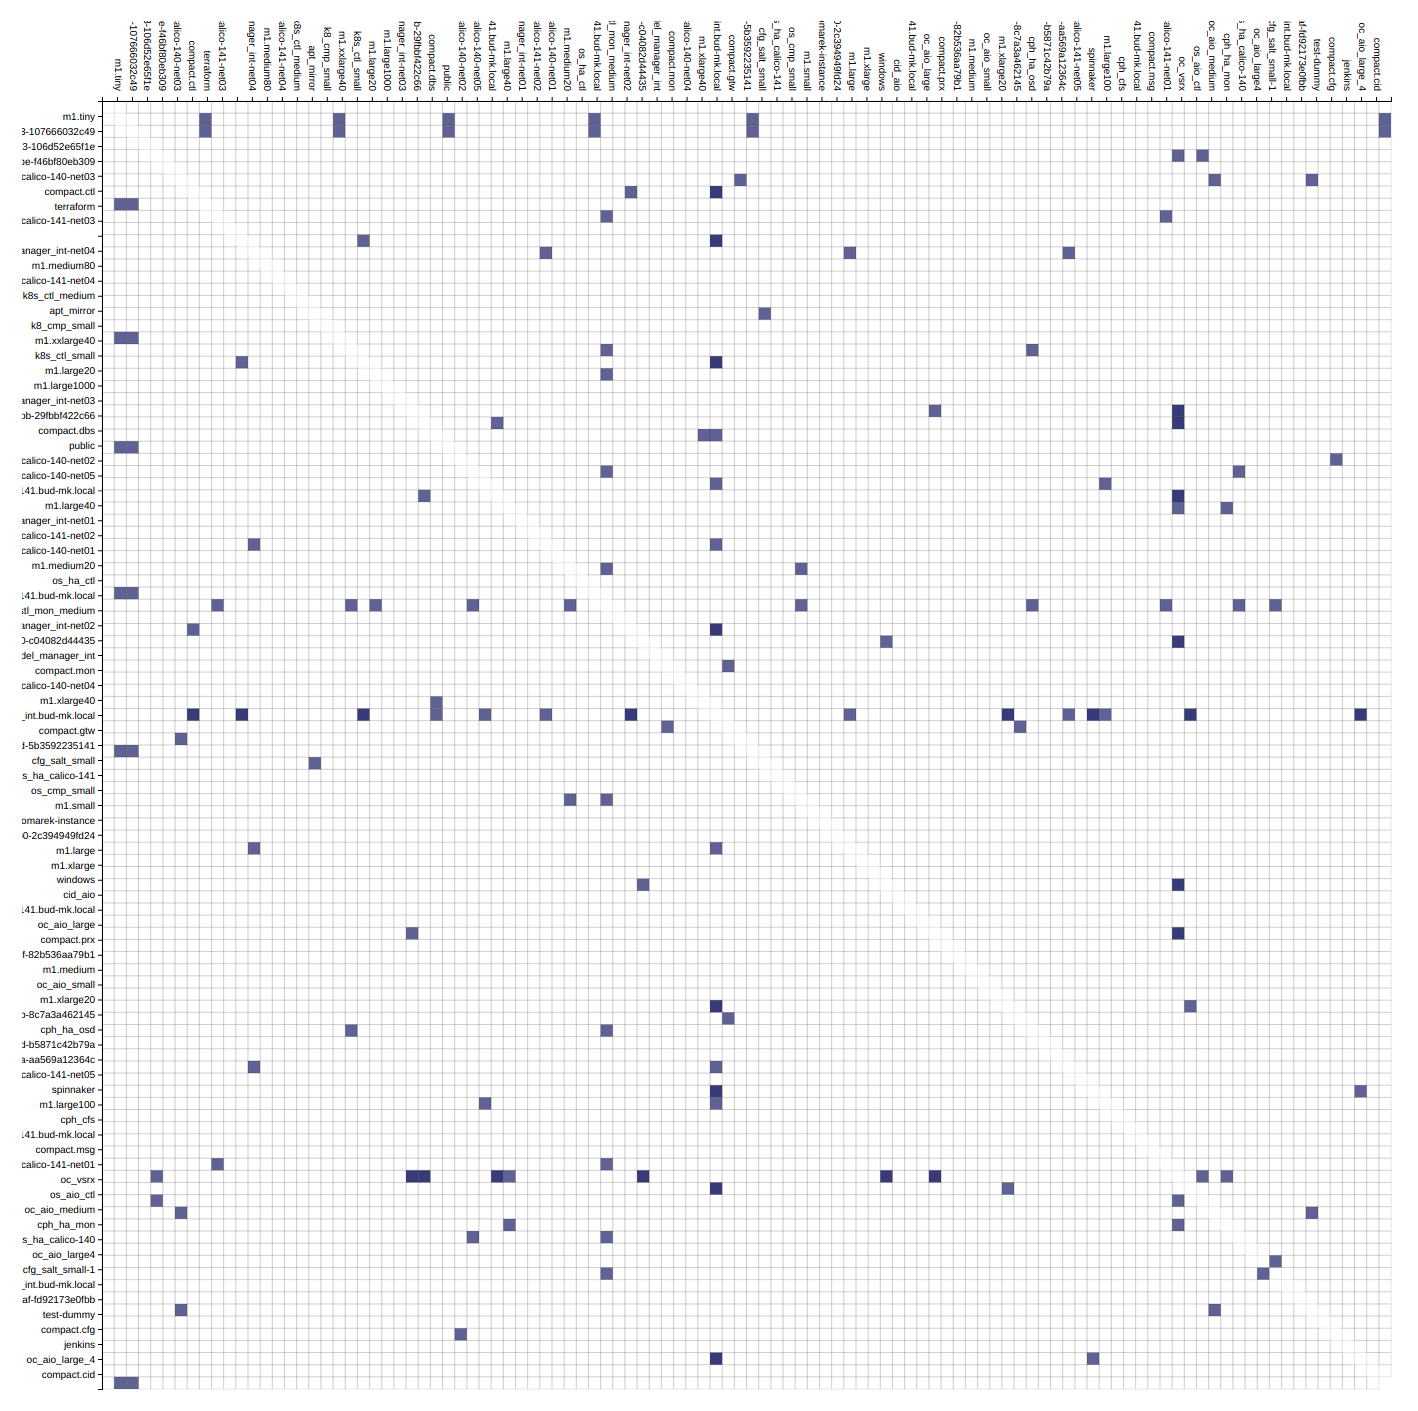
An adjacency matrix is a square matrix used to represent a finite graph. The elements of the matrix indicate whether pairs of vertices are adjacent or not in the graph.
Danny Holten presents an awesome and aesthetically pleasing way of simplifying graphs and making tree graphs more accessible. What makes his project so useful, however, is how he outlines the particular thought process that goes into making a visualization.
Directed graph traversal can give os acyclic structures suitable for showing parent-child relations in your subraphs.
Release version of infra-scraper is currently available on Pypi, to install it, simply execute:
pip install infra-scraperTo bootstrap latest development version into virtualenv, run following commands:
git clone git@github.com:cznewt/infra-scraper.git
cd infra-scraper
virtualenv venv
source venv/bin/activate
python setup.py installYou provide one configuration file for all providers. The default location is
/etc/infra-scraper/config.yaml but it can be overriden by
INFRA_SCRAPER_CONFIG_PATH environmental variable, for example:
export INFRA_SCRAPER_CONFIG_PATH=~/scraper.ymlYou can use ETCD as a storage backend for the configuration and scrape results. Following environmental parameters need to be set:
export INFRA_SCRAPER_CONFIG_BACKEND=etcd
export INFRA_SCRAPER_CONFIG_PATH=/service/scraper/configThe preffered scraping storage backend is neo4j service accessed by bolt interface.
storage:
  backend: neo4j
  database_url: 'bolt://neo4j:password@neo4j.host:7687'
endpoints: {}
You can set you local filesystem path where scraped data will be saved.
storage:
  backend: localfs
  storage_dir: /tmp/scraper
endpoints: {}
You can also set the scraping storage backend to use the ETCD service.
storage:
  backend: etcd
  storage_path: /scraper/data
endpoints: {}Each endpoint kind expects a little different set of configuration. Following samples show the required parameters to setup individual endpoints.
AWS scraping uses boto3 high level AWS python SDK for accessing and
manipulating AWS resources.
endpoints:
  aws-admin:
    kind: aws
    config:
      region: us-west-2
      aws_access_key_id: <access_key_id>
      aws_secret_access_key: <secret_access_key>
Kubernetes requires some information from kubeconfig file. You provide the parameters of the cluster and the user to the scraper. These can be found under corresponding keys.
endpoints:
  k8s-admin:
    kind: kubernetes
    layouts:
    - force
    - hive
    config:
      cluster:
        server: https://kubernetes-api:443
        certificate-authority-data: |
          <ca-for-server-and-clients>
      user:
        client-certificate-data: |
          <client-cert-public>
        client-key-data: |
          <client-cert-private>
Note
Options config.cluster and config.user can be found in your
kubeconfig file. Just copy the config fragment with cluster parameters
and fragment with user parameter.
Configurations for keystone v2 and keystone v3 clouds. Config for single tenant scraping.
endpoints:
  os-v2-tenant:
    kind: openstack
    description: OpenStack (keystone v2) tenant
    scope: local
    layouts:
    - arc
    - force
    - hive
    - matrix
    config:
      region_name: RegionOne
      compute_api_version: '2.1'
      auth:
        username: user
        password: password
        project_name: project-name
        domain_name: 'default'
        auth_url: 'https://keystone-api:5000/v3'
Config for scraping resources from entire cloud.
endpoints:
  os-v2-admin:
    kind: openstack
    description: OpenStack (keystone v2) cloud
    scope: global
    layouts:
    - force
    - hive
    config:
      region_name: RegionOne
      auth:
        username: admin
        password: password
        project_name: admin
auth_url: https://keystone-api:5000/v2.0Configuration for connecting to Salt API.
endpoints:
  salt-global:
    kind: salt
    layouts:
    - force
    - hive
    config:
      auth_url: 'http://127.0.0.1:8000'
      username: salt-user
password: passwordConfiguration for parsing terraform templates.
endpoints:
  tf-aws-app:
    kind: terraform
    layouts:
    - hive
    config:
dir: ~/terraform/two-tier-awsThe application comes with several entry commands:
scraper_get <endpoint-name>
Scrape single endpoint once.
scraper_get_forever <endpoint-name>
Scrape single endpoint continuously.
scraper_get_all
Scrape all defined endpoints once.
scraper_get_all_forever
Scrape all defined endpoints continuously.
scraper_status
Display the service status, endpoints, scrapes, etc.
scraper_web
Start the UI with visualization samples and API that provides the scraped data.
Following outputs show available resources and relations from given domain.
kind: kubernetes
name: test-kubernetes
relations:
  k8s:deployment-k8s:namespace: 22
  k8s:deployment-k8s:replica_set: 62
  k8s:endpoint-k8s:namespace: 28
  k8s:event-k8s:namespace: 52
  k8s:persistent_volume_claim-k8s:namespace: 1
  k8s:pod-k8s:namespace: 52
  k8s:pod-k8s:node: 52
  k8s:pod-k8s:service: 52
  k8s:replica_set-k8s:namespace: 62
  k8s:replica_set-k8s:pod: 51
  k8s:replication_controller-k8s:namespace: 1
  k8s:secret-k8s:namespace: 1
  k8s:service-k8s:namespace: 30
  k8s:service_account-k8s:namespace: 1
resources:
  k8s:deployment: 22
  k8s:endpoint: 28
  k8s:event: 52
  k8s:namespace: 4
  k8s:node: 5
  k8s:persistent_volume: 1
  k8s:persistent_volume_claim: 1
  k8s:pod: 52
  k8s:replica_set: 62
  k8s:replication_controller: 1
  k8s:secret: 1
  k8s:service: 30
  k8s:service_account: 1
timestamp: 1508692477kind: openstack
name: test-openstack
relations:
os:floating_ip-os:project: 617
os:hypervisor-os:aggregate: 46
os:network-os:project: 575
os:port-os:hypervisor: 3183
os:port-os:network: 3183
os:port-os:project: 3183
os:port-os:server: 3183
os:router-os:project: 42
os:server-os:flavor: 676
os:server-os:hypervisor: 676
os:server-os:project: 676
os:stack-os:network: 7
os:stack-os:port: 17
os:stack-os:project: 2
os:stack-os:server: 7
os:stack-os:subnet: 7
os:subnet-os:network: 567
os:subnet-os:project: 567
resources:
os:aggregate: 13
os:flavor: 43
os:floating_ip: 617
os:hypervisor: 72
os:network: 575
os:port: 3183
os:resource_type: 169
os:router: 42
os:server: 676
os:stack: 2
os:subnet: 567
os:volume: 10
timestamp: 1508694475kind: salt
name: test-salt
relations:
salt_job-salt_high_state: 552
salt_job-salt_minion: 9
salt_minion-salt_high_state: 689
salt_service-salt_high_state: 689
salt_service-salt_minion: 24
salt_user-salt_job: 7
resources:
salt_high_state: 689
salt_job: 7
salt_minion: 3
salt_service: 24
salt_user: 2
timestamp: 1508932328