一、概述
IDC机房测速工具,由3个组件组成:
smokeping:主要负责采集数据
prometheus:主要负责存储数据
grafana:主要负责展现数据
smokeping采集数据之后存储到rrd文件,然后通过脚本把数据提取出来,格式化之后发送到prometheus,然后通过grafana展示出来
使用环境: Centos7 python2.7
二、使用
cd /tmp
git clone https://github.com/Spider-Zhong/idcping-smokeping.git
(1)smokeping 安装单机版:
cd /tmp && wget -N --no-check-certificate https://raw.githubusercontent.com/ILLKX/smokeping-onekey/master/smokeping.sh && bash smokeping.sh
smokeping的家目录:
smokeping_home_dir=/opt/smokeping
创建config文件,并且配置全国各区域ip监测点
cd $smokeping_home_dir/etc
cp -rf /tmp/idcping-smokeping/smokeping/* ./
监测点主要由国内的三大运营商的IP站点组成,也可以自定义需要检测的站点
启动:
bash /tmp/smokeping.sh
(2)安装prometheus pushgateway
curl -s https://packagecloud.io/install/repositories/prometheus-rpm/release/script.rpm.sh | sudo bash
yum -y install prometheus2 pushgateway python python-pip python-rrdtool
systemctl status prometheus
systemctl start prometheus
systemctl start pushgateway
firewall-cmd --zone=public --add-port=9090/tcp
firewall-cmd --zone=public --add-port=9091/tcp
配置prometheus.yml
vim /etc/prometheus/prometheus.yml

global:
  scrape_interval:     60s
  evaluation_interval: 60s

scrape_configs:
  - job_name: prometheus
    static_configs:
      - targets: ['localhost:9090']
        labels:
          instance: prometheus

  - job_name: pushgateway
    static_configs:
      - targets: ['localhost:9091']
        labels:
          instance: pushgateway
把smokeping采集的数据通过rrdtool读取之后,按照一定的格式推送到prometheus的gateway,时间间隔是1分钟 Ps: 请务必检查运行环境 模块是否安装 requests rrdtool
pip install requests
cp /tmp/idcping-smokeping/prometheus/collection_to_prometheus.py $smokeping_home_dir
touch /tmp/smoking_pushgateway.log
在/usr/local/smokeping/collection_to_prometheus.py中,按照实际情况配置3个参数:
'LOG_FILE' : '/tmp/smoking_pushgateway.log'             # 日志文件
'prometheus_gateway' : 'http://localhost:9091'     # Prometheus gateway地址
'data_dir' : '/opt/smokeping/htdocs/data'                # smokeping rrd文件的存放地址
配置crontab计划任务
crontab -e

* * * * * python /opt/smokeping/collection_to_prometheus.py
(3)grafana
安装
wget https://dl.grafana.com/oss/release/grafana-6.1.6-1.x86_64.rpm
sudo yum localinstall grafana-6.1.6-1.x86_64.rpm
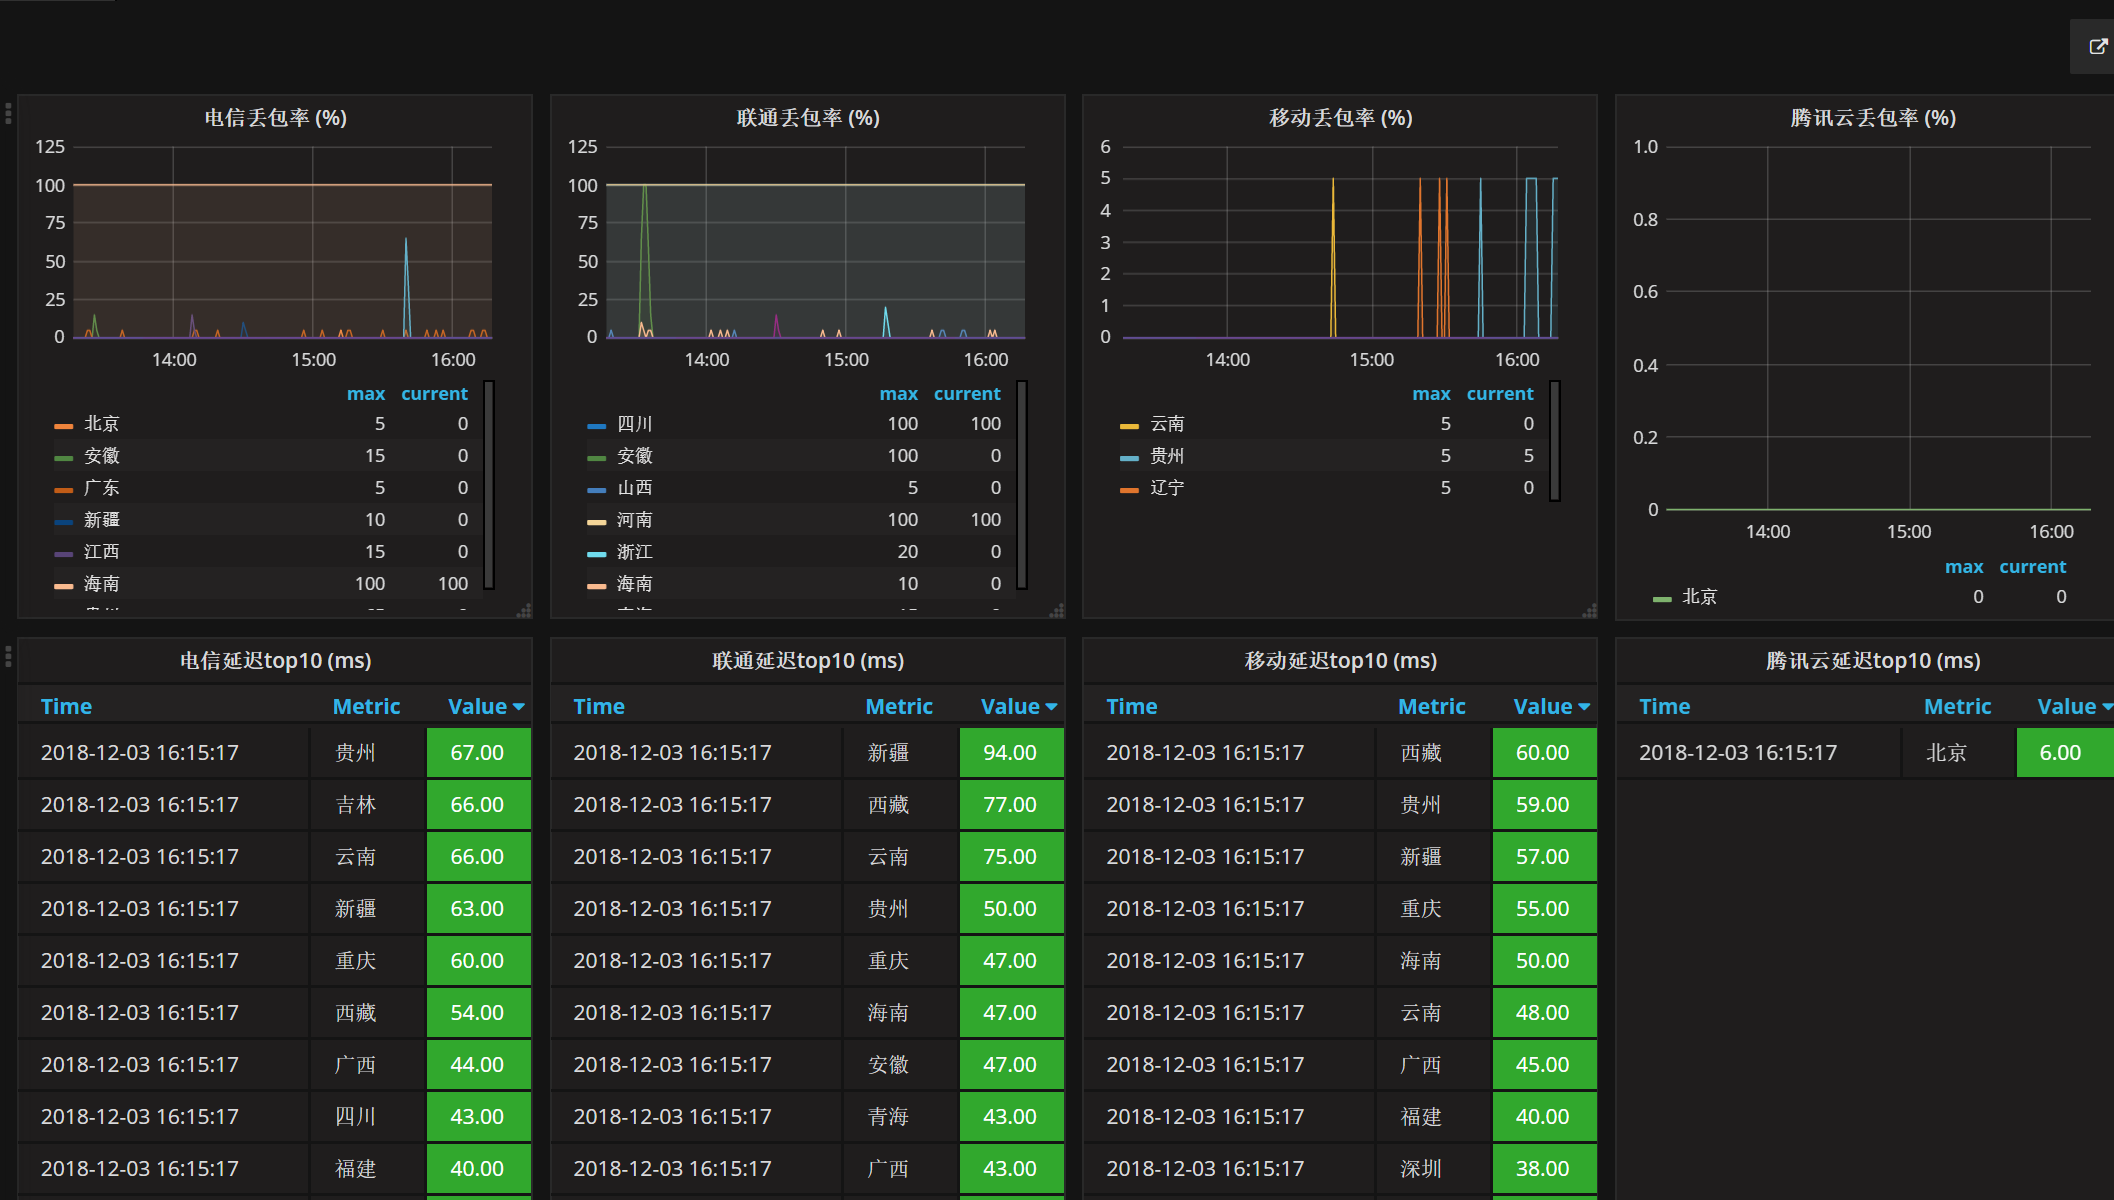
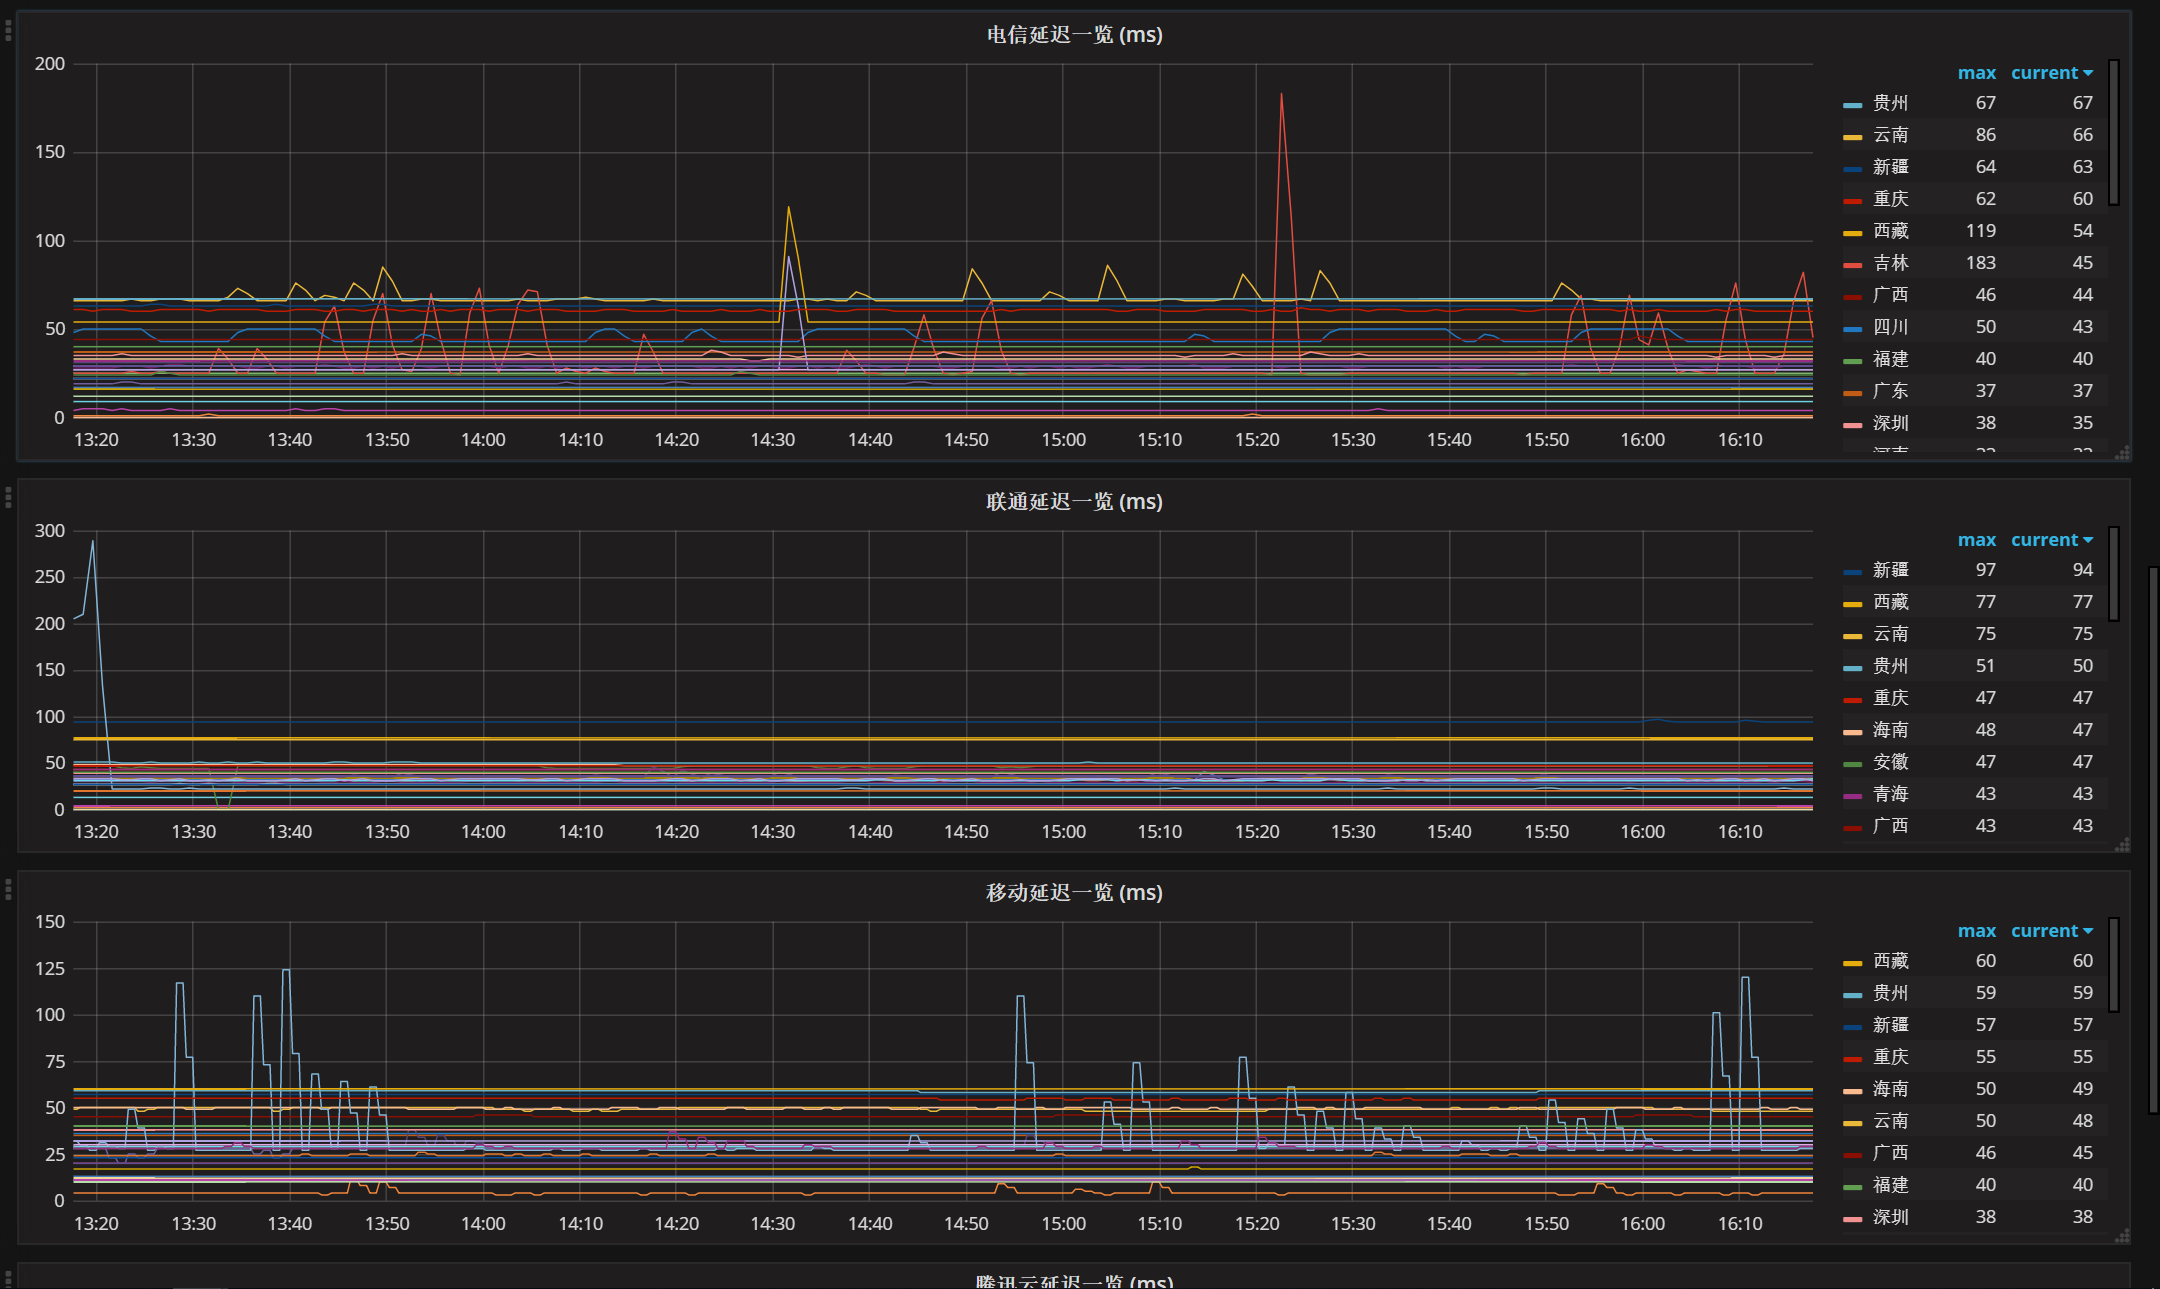
将模板grafana/ping_monitor.json 导入grafana即可,效果大概是这样

