This is the home of the DevKit and the Angular CLI code. You can find the Angular CLI specific README here.
| Gitter | Contributing | Angular CLI |
|---|
The Angular CLI creates, manages, builds and test your Angular projects. It's built on top of the Angular DevKit.
DevKit's goal is to provide a large set of libraries that can be used to manage, develop, deploy and analyze your code.
To get started locally, follow these instructions:
- If you haven't done it already, make a fork of this repo.
- Clone to your local computer using
git. - Make sure that you have Node 10.13 or later installed. See instructions here.
- Make sure that you have
yarninstalled; see instructions here. - Run
yarn(no arguments) from the root of your clone of this project to install dependencies.
To make a local build:
yarn build --localThis generates a number of tarballs in the dist/ directory. To actually use
the locally built tools, switch to another repository reproducing the specific
issue you want to fix (or just generate a local repo with ng new). Then
install the locally built packages:
cd "${EXAMPLE_ANGULAR_PROJECT_REPO}"
npm install -D ${CLI_REPO}/dist/*.tgz
Builds of this example project will use tooling created from the previous local build and include any local changes. When using the CLI, it will automatically check for a local install and use that if present. This means you can just run:
npm install -g @angular/clito get a global install of the latest CLI release. Then running any ng command
in the example project will automatically find and use the local build of the
CLI.
Note: If you are testing ng update, be aware that installing all the tarballs
will also update the framework (@angular/core) to the latest version. In this
case, simply install the CLI alone with
npm install -D ${CLI_REPO}/dist/_angular_cli.tgz, that way the rest of the
project remains to be upgraded with ng update.
To debug an invocation of the CLI, build and install the CLI for an example
project, then run the desired ng command
as:
node --inspect-brk node_modules/.bin/ng ...This will trigger a breakpoint as the CLI starts up. You can connect to this
using the supported mechanisms for your IDE, but the simplest option is to open
Chrome to chrome://inspect and then click on the inspect
link for the node_modules/.bin/ng Node target.
Unfortunately, the CLI dynamically require()'s other files mid-execution, so
the debugger is not aware of all the source code files before hand. As a result,
it is tough to put breakpoints on files before the CLI loads them. The easiest
workaround is to use the debugger; statement to stop execution in the file you
are interested in, and then you should be able to step around and set breakpoints
as expected.
There are two different test suites which can be run locally:
- Run all tests:
yarn bazel test //packages/... - Run a subset of the tests, use the full Bazel target example:
yarn bazel test //packages/schematics/angular:angular_test - For a complete list of test targets use the following Bazel query:
yarn bazel query "tests(//packages/...)"
You can find more info about debugging [tests with Bazel in the docs.] (https://github.com/angular/angular-cli/blob/master/docs/process/bazel.md#debugging-jasmine_node_test)
- Run:
node tests/legacy-cli/run_e2e.js - Run a subset of the tests:
node tests/legacy-cli/run_e2e.js tests/legacy-cli/e2e/tests/i18n/ivy-localize-*
When running the debug commands, Node will stop and wait for a debugger to attach. You can attach your IDE to the debugger to stop on breakpoints and step through the code. Also, see IDE Specific Usage for a simpler debug story.
When debugging a specific test, change describe() or it() to fdescribe()
and fit() to focus execution to just that one test. This will keep the output clean and speed up execution by not running irrelevant tests.
Some additional tips for developing in specific IDEs.
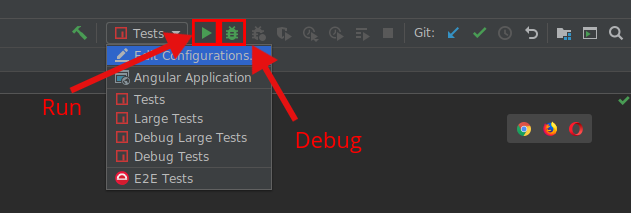
To load the project in Intellij products, simply Open the repository folder.
Do not Import Project, because that will overwrite the existing
configuration.
Once opened, the editor should automatically detect run configurations in the
workspace. Use the drop down to choose which one to run and then click the Run
button to start it. When executing a debug target, make sure to click the
Debug icon to automatically attach the debugger (if you click Run, Node will
wait forever for a debugger to attach).
Adding a package to this repository means running two separate commands:
schematics devkit:package PACKAGE_NAME. This will update the.monorepofile, and create the base files for the new package (package.json, src/index, etc).devkit-admin templates. This will update the README and all other template files that might have changed when adding a new package.
For private packages, you will need to add a "private": true key to your package.json manually.
This will require re-running the template admin script.
This is a monorepo which contains many tools and packages:
| Project | Package | Version | Links |
|---|---|---|---|
| Angular CLI | @angular/cli |
 |
  |
| Architect CLI | @angular-devkit/architect-cli |
 |
 |
| Schematics CLI | @angular-devkit/schematics-cli |
 |
 |
| Project | Package | Version | Links |
|---|---|---|---|
| Architect | @angular-devkit/architect |
 |
  |
| Build Angular | @angular-devkit/build-angular |
 |
  |
| Build NgPackagr | @angular-devkit/build-ng-packagr |
 |
  |
| Build Optimizer | @angular-devkit/build-optimizer |
 |
  |
| Build Webpack | @angular-devkit/build-webpack |
 |
  |
| Core | @angular-devkit/core |
 |
  |
| Schematics | @angular-devkit/schematics |
 |
  |
| Project | Package | Version | Links |
|---|---|---|---|
| Angular PWA Schematics | @angular/pwa |
 |
 |
| Angular Schematics | @schematics/angular |
 |
 |
| Schematics Schematics | @schematics/schematics |
 |
 |
| Package Update Schematics | @schematics/update |
 |
 |
| Project | Package | Version | Links |
|---|---|---|---|
| Webpack Angular Plugin | @ngtools/webpack |
 |
 |


