This example builds a daily ETL pipeline that interacts with Google Cloud Platform (GCP). At a high level, this project shows how to ingest data from external sources to BigQuery, explore and transform the data, and materialize outputs that help visualize the data.
New to Dagster? Learn what Dagster is in Concepts or in the hands-on Tutorials.
This guide covers:
- Dagster + GCP starter kit
This starter kit includes:
- Basics of creating, connecting, and testing assets in Dagster.
- Convenient ways to organize and monitor assets, e.g. grouping assets, recording asset metadata, etc.
- A custom I/O Manager that stores Pandas DataFrames to BigQuery Tables and reads the tables into DataFrames, which uses environment variables to handle the Google service account credentials.
- A schedule defined to run a job that generates assets daily.
- Scaffolded project layout that helps you to quickly get started with everything set up.
In this project, we're building an analytical pipeline that explores popular topics on HackerNews.

This project:
- Fetches data from HackerNews APIs and materializes tables in BigQuery.
- Transforms the collected data using Pandas.
- Creates a word cloud based on trending HackerNews stories to visualize popular topics on HackerNews.
To complete the steps in this guide, you'll need:
- A Google Service Account account.
- Set up secrets to connect to GCP.
To connect to GCP, you'll need to set up your credentials in Dagster.
Dagster allows using environment variables to handle sensitive information. You can define various configuration options and access environment variables through them. This also allows you to parameterize your pipeline without modifying code.
In this example, we write a custom bigquery_pandas_io_manager to write outputs to BigQuery and read inputs from it.
The configurations of the Bigquery connection are defined in quickstart_gcp/repository.py, which requires the following environment variables:
BIGQUERY_SERVICE_ACCOUNT_CREDENTIALS- *Note: In this example, we use
from_service_account_infoto set up the GCP connection. It accepts a dictionary corresponding to the JSON file contents, so the value of this environment variable needs to be a JSON string. If you'd like to refer to the JSON file path instead, change the I/O manager to usefrom_service_account_file.
- *Note: In this example, we use
BIGQUERY_PROJECT_ID
You can declare environment variables in various ways:
- Local development: Using
.envfiles to load env vars into local environments - Dagster Cloud: Using the Dagster Cloud UI to manage environment variables
- Dagster Open Source: How environment variables are set for Dagster projects deployed on your infrastructure depends on where Dagster is deployed. Read about how to declare environment variables here.
Check out Using environment variables and secrets guide for more info and examples.
The easiest way to spin up your Dagster project is to use Dagster Cloud Serverless. It provides out-of-the-box CI/CD and native branching that make development and deployment easy.
Check out Dagster Cloud to get started.
First, install your Dagster repository as a Python package. By using the --editable flag, pip will install your repository in "editable mode" so that as you develop, local code changes will automatically apply. Check out Dagster Installation for more information.
pip install -e ".[dev]"Then, start the Dagit web server:
dagitOpen http://localhost:3000 with your browser to see the project.
With the starter project loaded in your browser, click the icon in the top-left corner of the page to expand the navigation. You'll see both jobs and assets listed in the left nav.
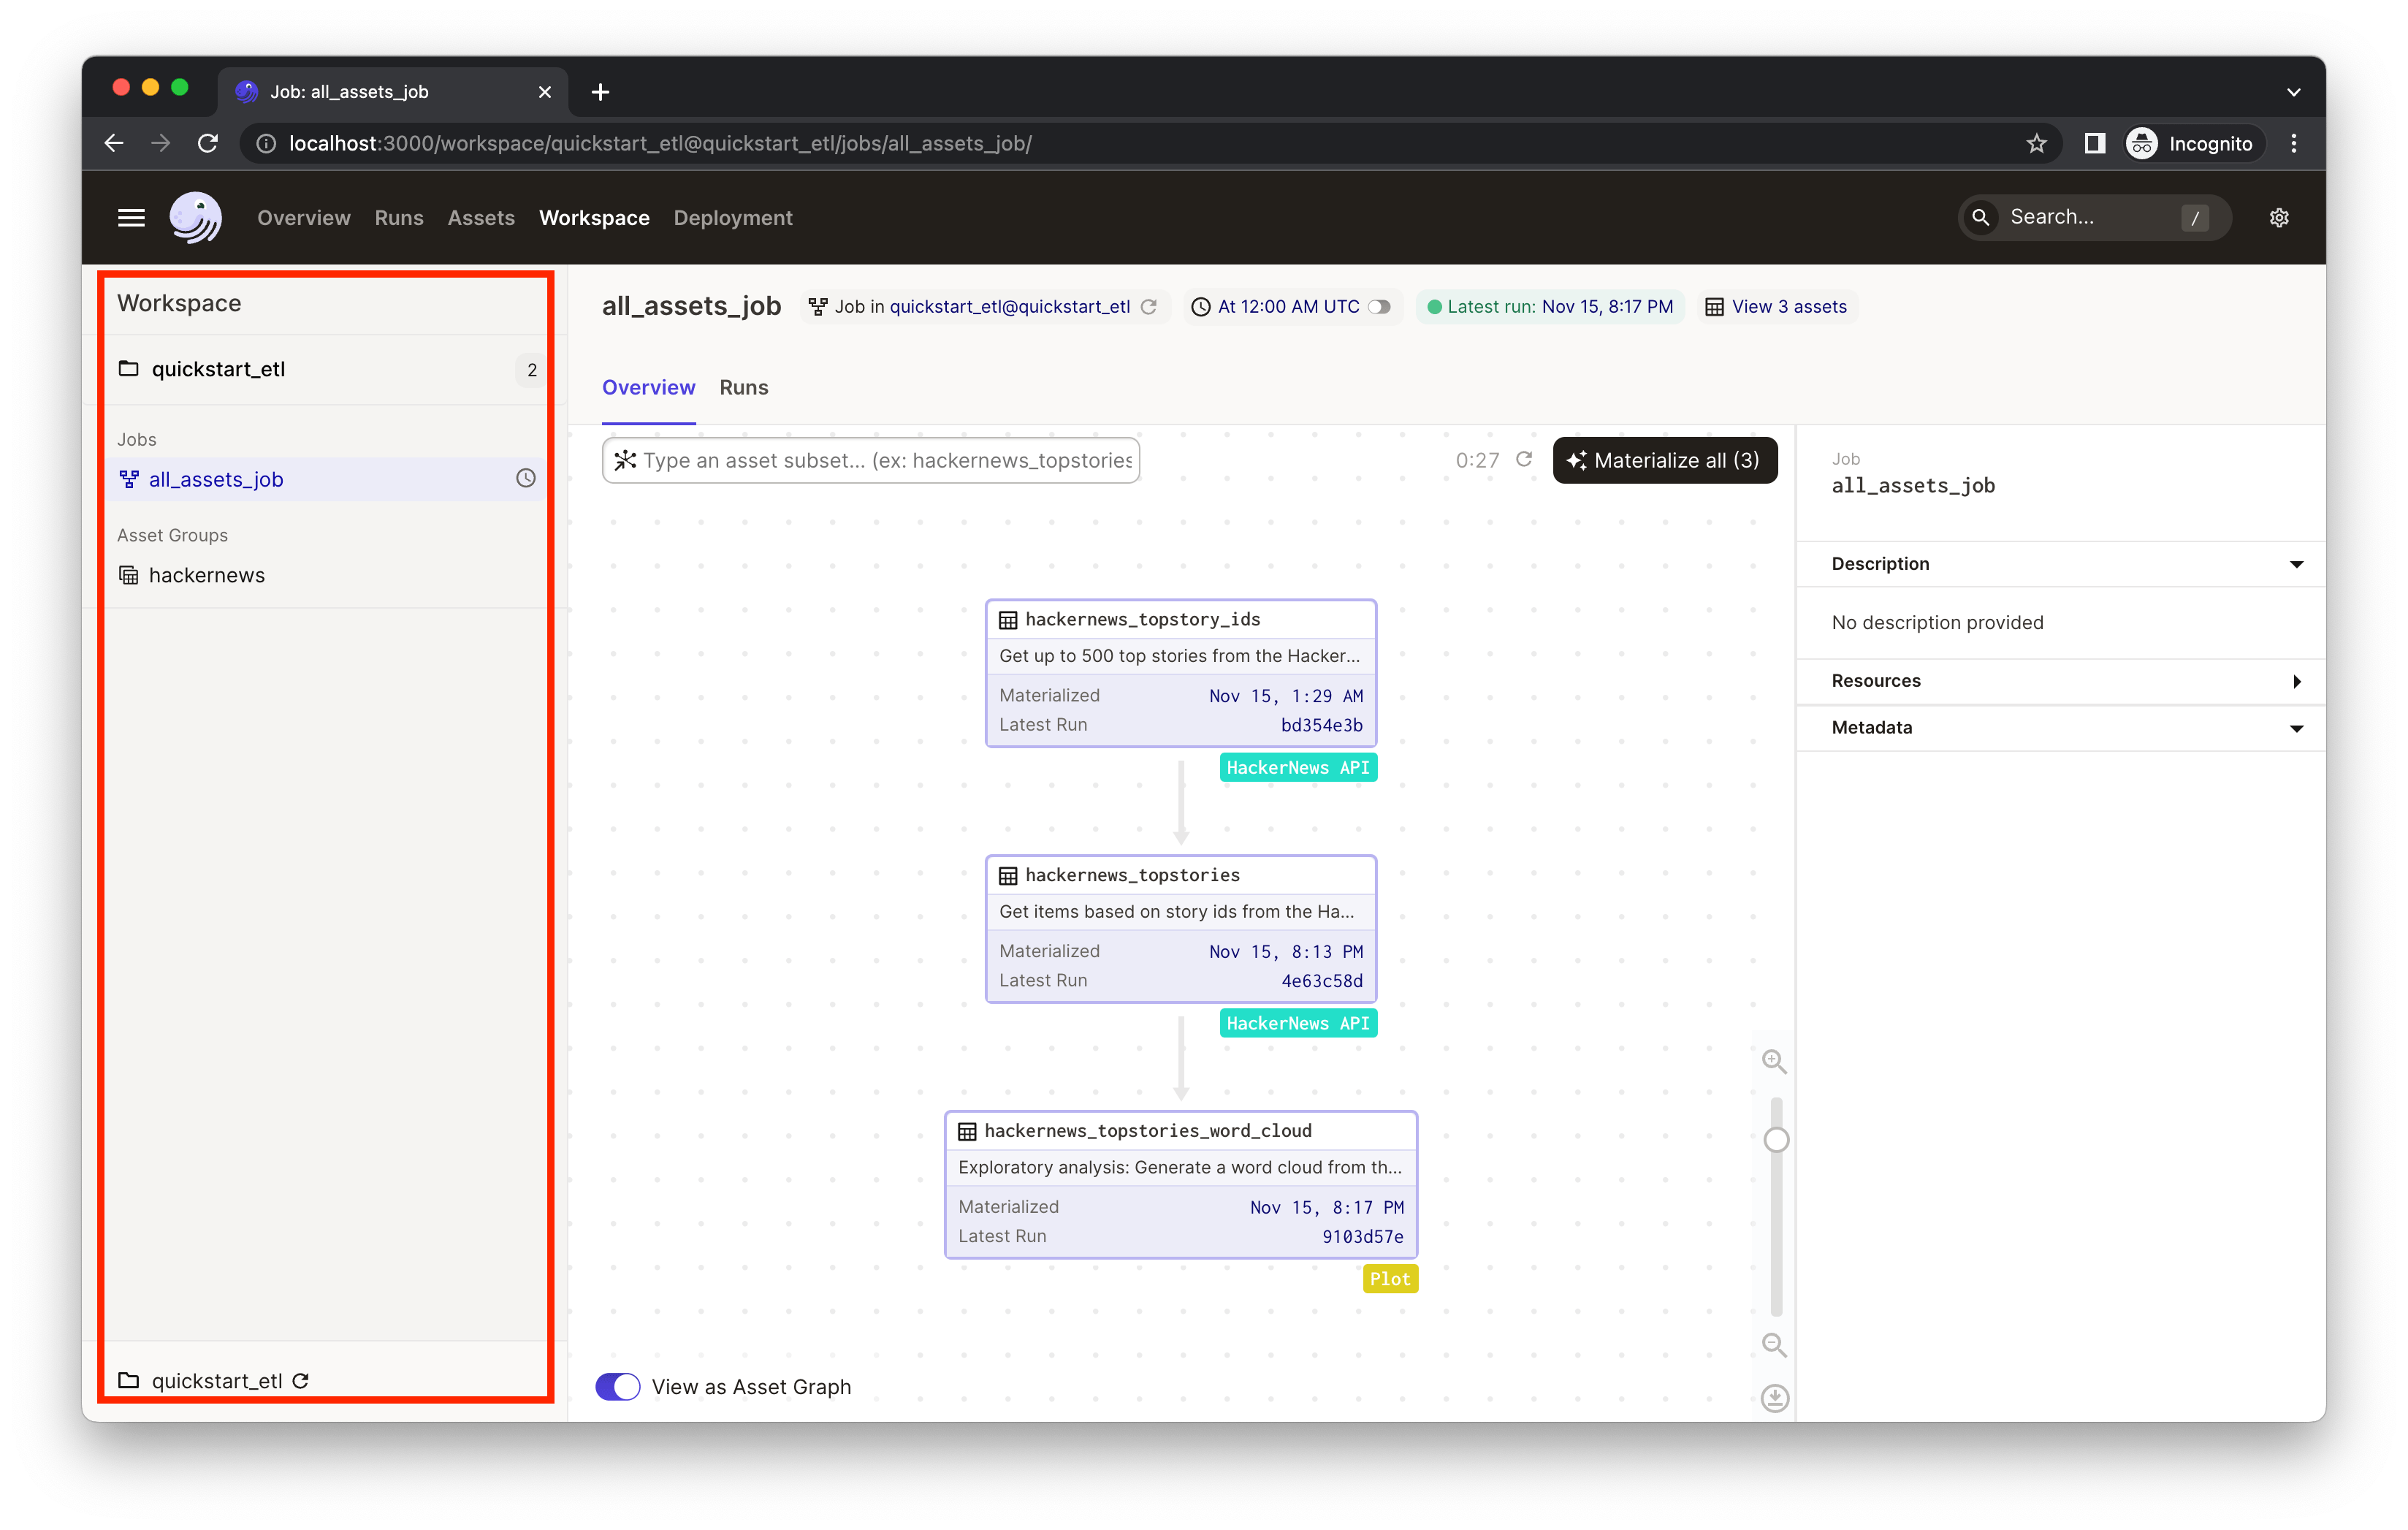
Click on the hackernews asset group to view the HackerNews assets and their relationship.
An asset is a software object that models a data asset, which can be a file in your filesystem, a table in a database, or a data report. The assets in the hackernews asset group ingest the current trending 500 HackerNews stories and plots a word cloud out of the collected stories to visualize the popular topics on HackerNews. You'll see three assets with different tags:
hackernews_topstory_idsfetches a list of top story ids from a HackerNews endpoint.hackernews_topstoriestakes the list of ids and pulls the story details from HackerNews based on the ids.hackernews_stories_word_cloudvisualizes the trending topics in a word cloud.
Dagster visualizes upstream and downstream dependencies vertically. Assets below other assets connected by arrows implies a dependency relationship. So we can tell from the UI that the asset hackernews_topstories depends on hackernews_topstory_ids (i.e. hackernews_topstories takes hackernews_topstory_ids's output as an input) and hackernews_stories_word_cloud depends on hackernews_topstories.
All three assets are defined in quickstart_gcp/assets/hackernews.py. Typically, you'll define assets by annotating ordinary Python functions with the @asset decorator.
This project also comes with ways to better organize the assets:
- Labeling/tagging. You'll find the assets are tagged with different [labels/badges], such as
HackerNews APIandPlot. This is defined in code via thecompute_kindargument to the@assetdecorator. It can be any string value that represents the kind of computation that produces the asset and will be displayed in the UI as a badge on the asset. This can help us quickly understand the data logic from a bird's eye view. - Grouping assets. We've also assigned all three assets to the group
hackernews, which is accomplished by providing thegroup_nameargument to the@assetdecorator. Grouping assets can help keep assets organized as your project grows. Learn about asset grouping here. - Adding descriptions. In the asset graph, the UI also shows the description of each asset. You can specify the description of an asset in the
descriptionargument to@asset. When the argument is not provided and the decorated function has a docstring, Dagster will use the docstring as the description. In this example, the UI is using the docstrings as the descriptions.
Now that we've got a basic understanding of Dagster assets, let's materialize them.
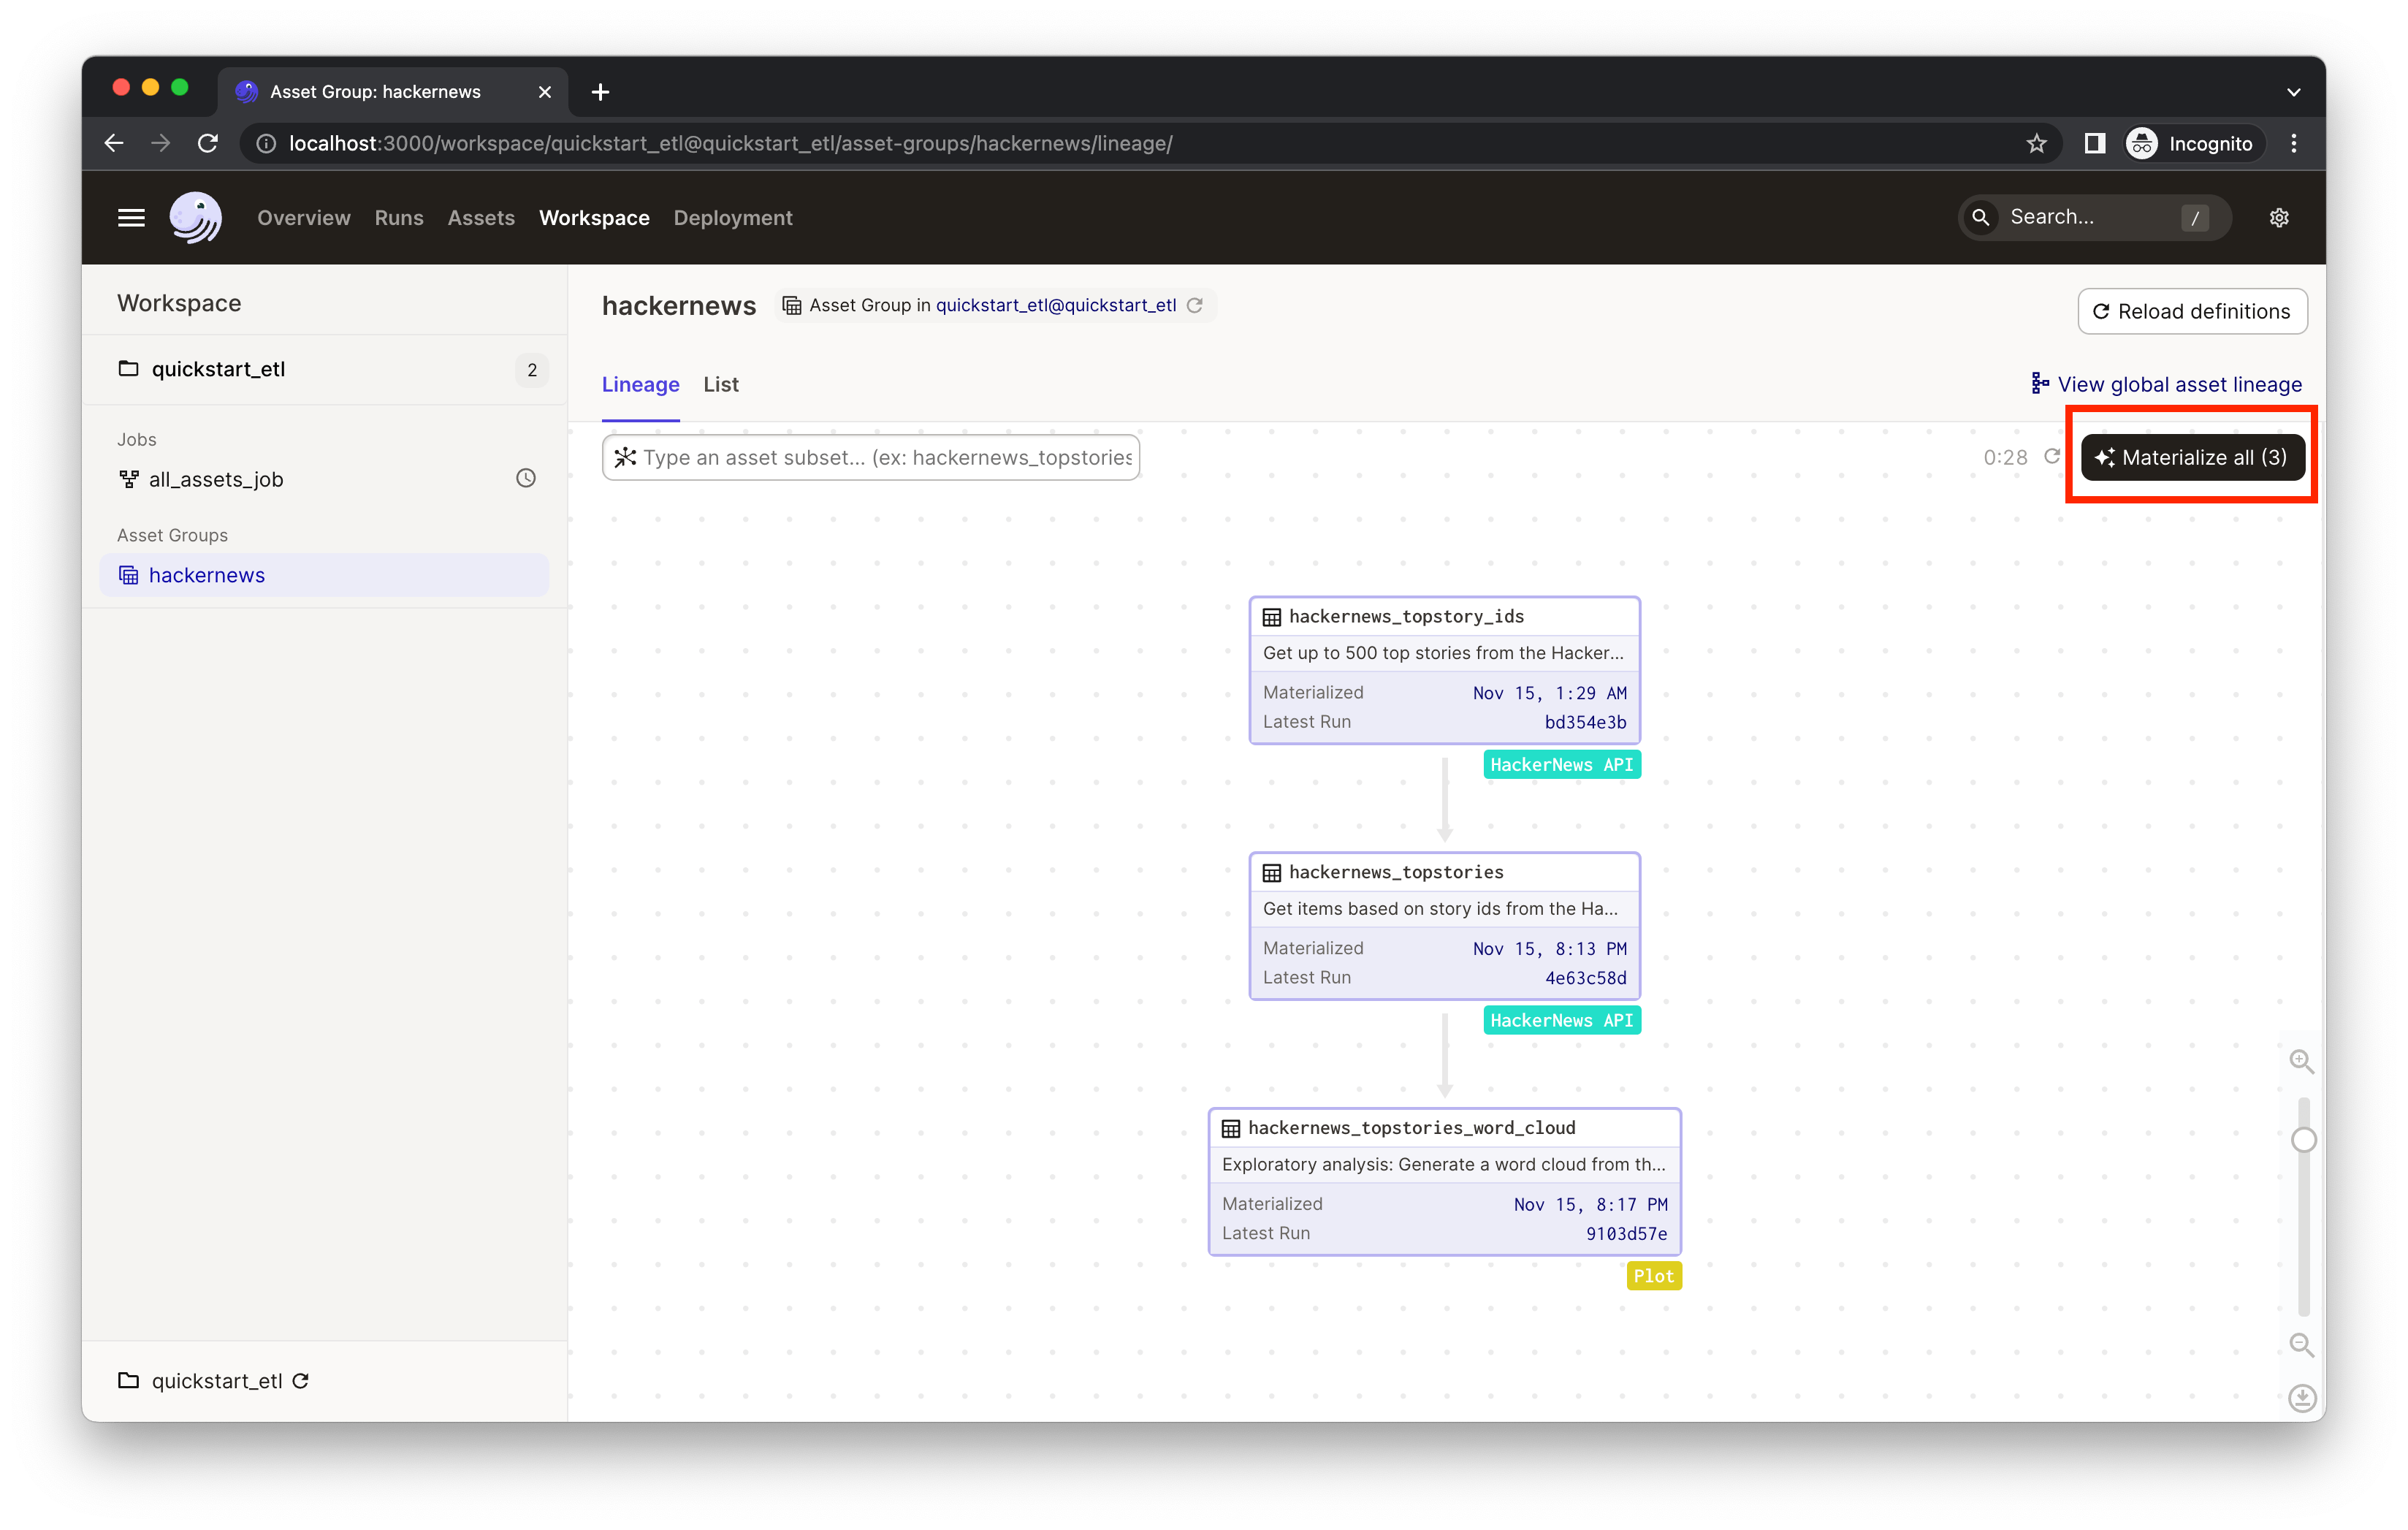
Click Materialize all to kick off a Dagster run which will pull info from the external APIs and move the data through assets.
As you iterate, some assets may become outdated. To refresh them, you can select a subset of assets to run instead of re-running the entire pipeline. This allows us to avoid unnecessary re-runs of expensive computations, only re-materializing the assets that need to be updated. If assets take a long time to run or interact with APIs with restrictive rate limits, selectively re-materializing assets will come in handy.
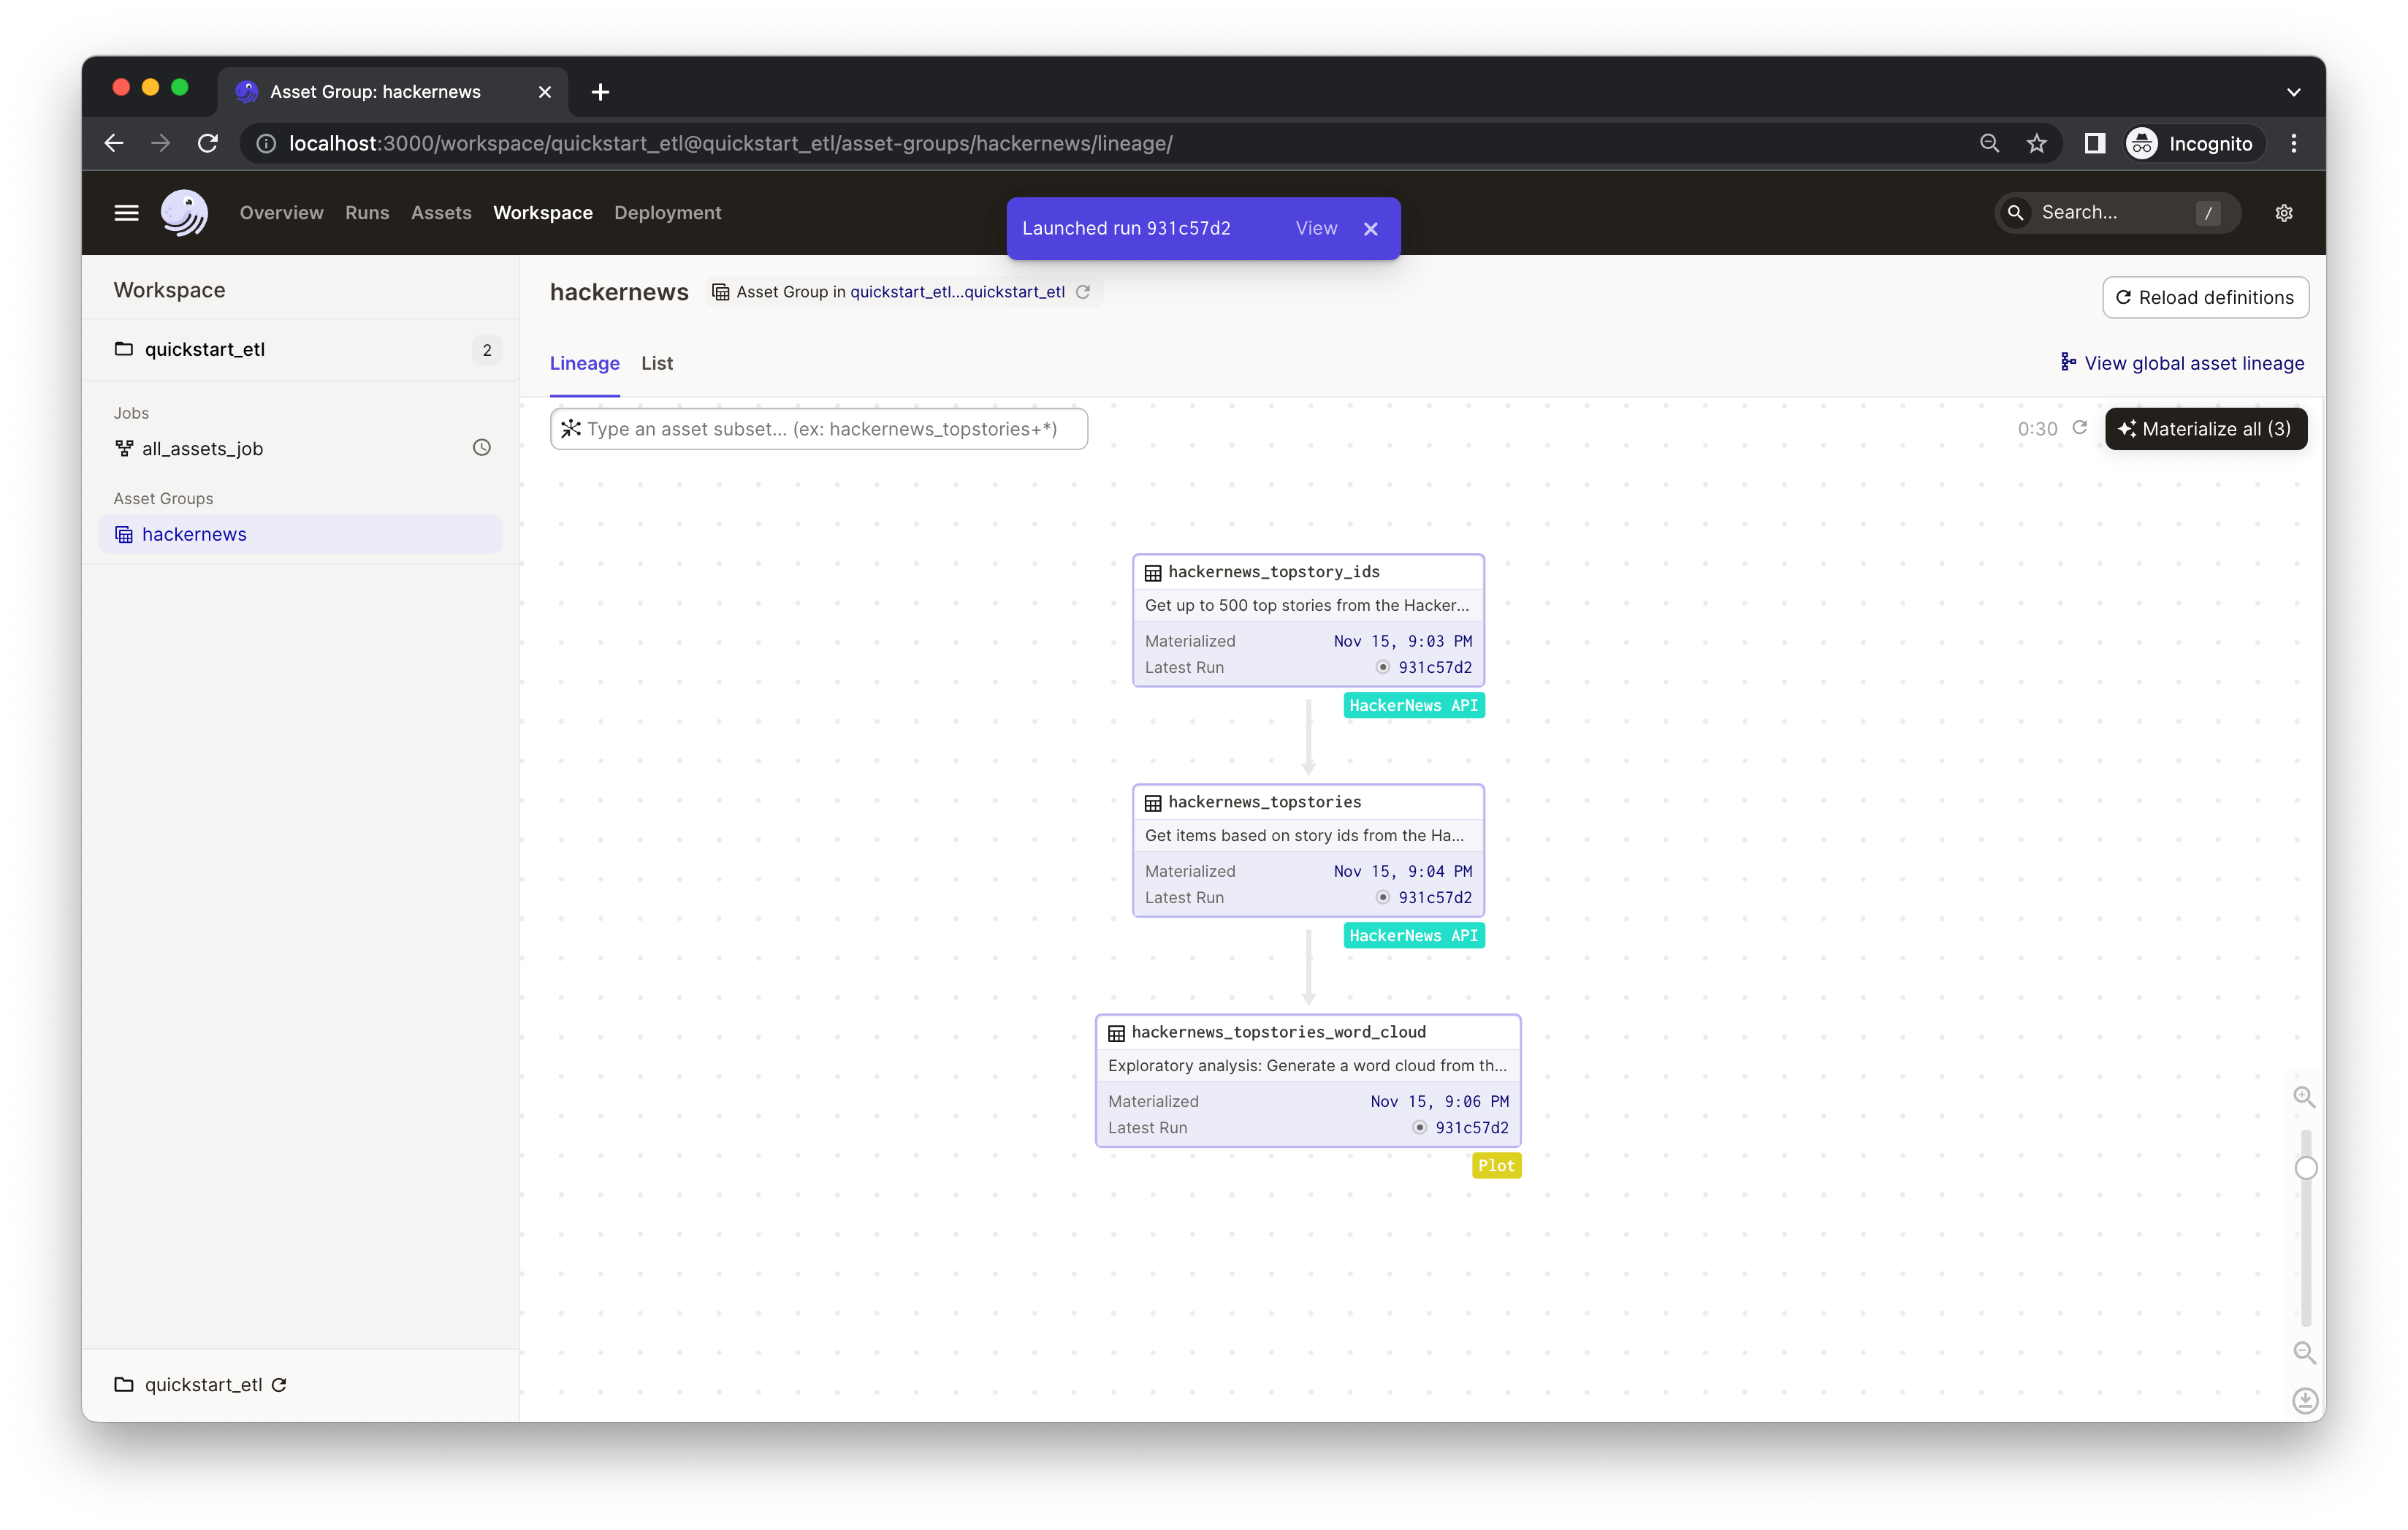
You'll see an indicator pop up with the launched run ID. Click View to monitor the run in real-time. This will open a new tab in your browser:
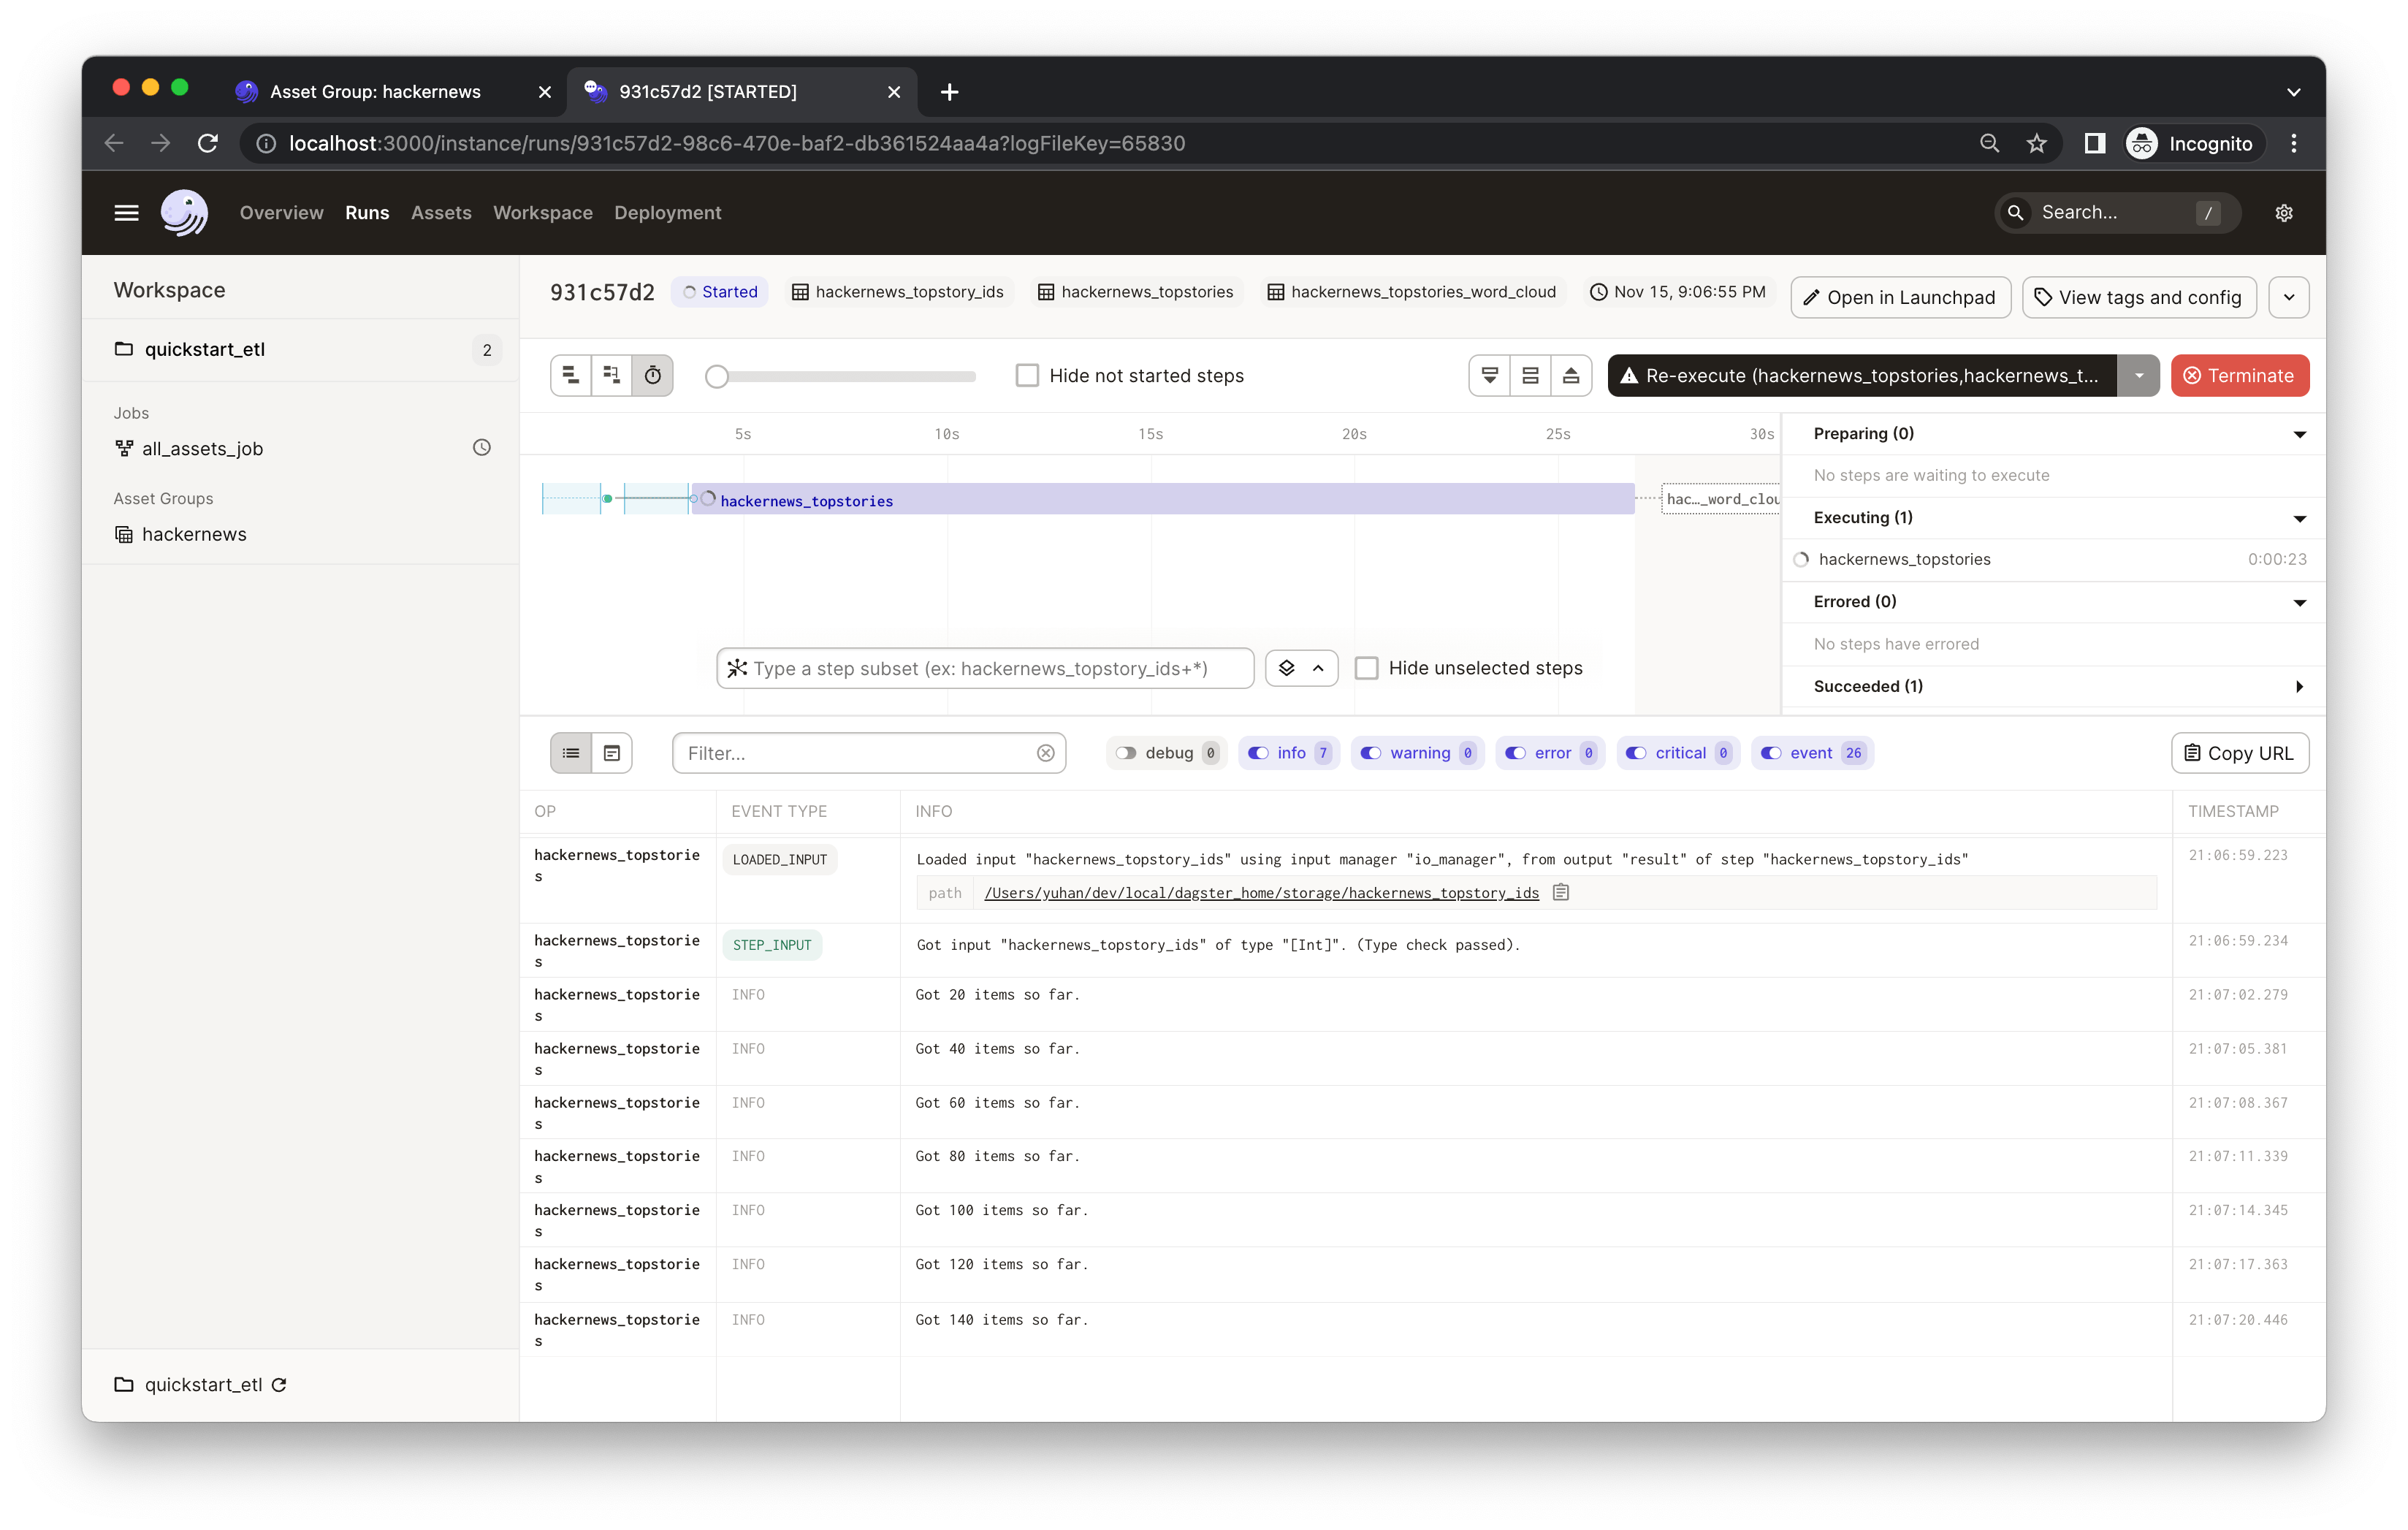
The process will run for a bit. While it's running, you should see the real-time compute logs printed in the UI. (It may take 1-2 minutes to fetch all top 500 stories from HackerNews in the hackernews_topstories step).
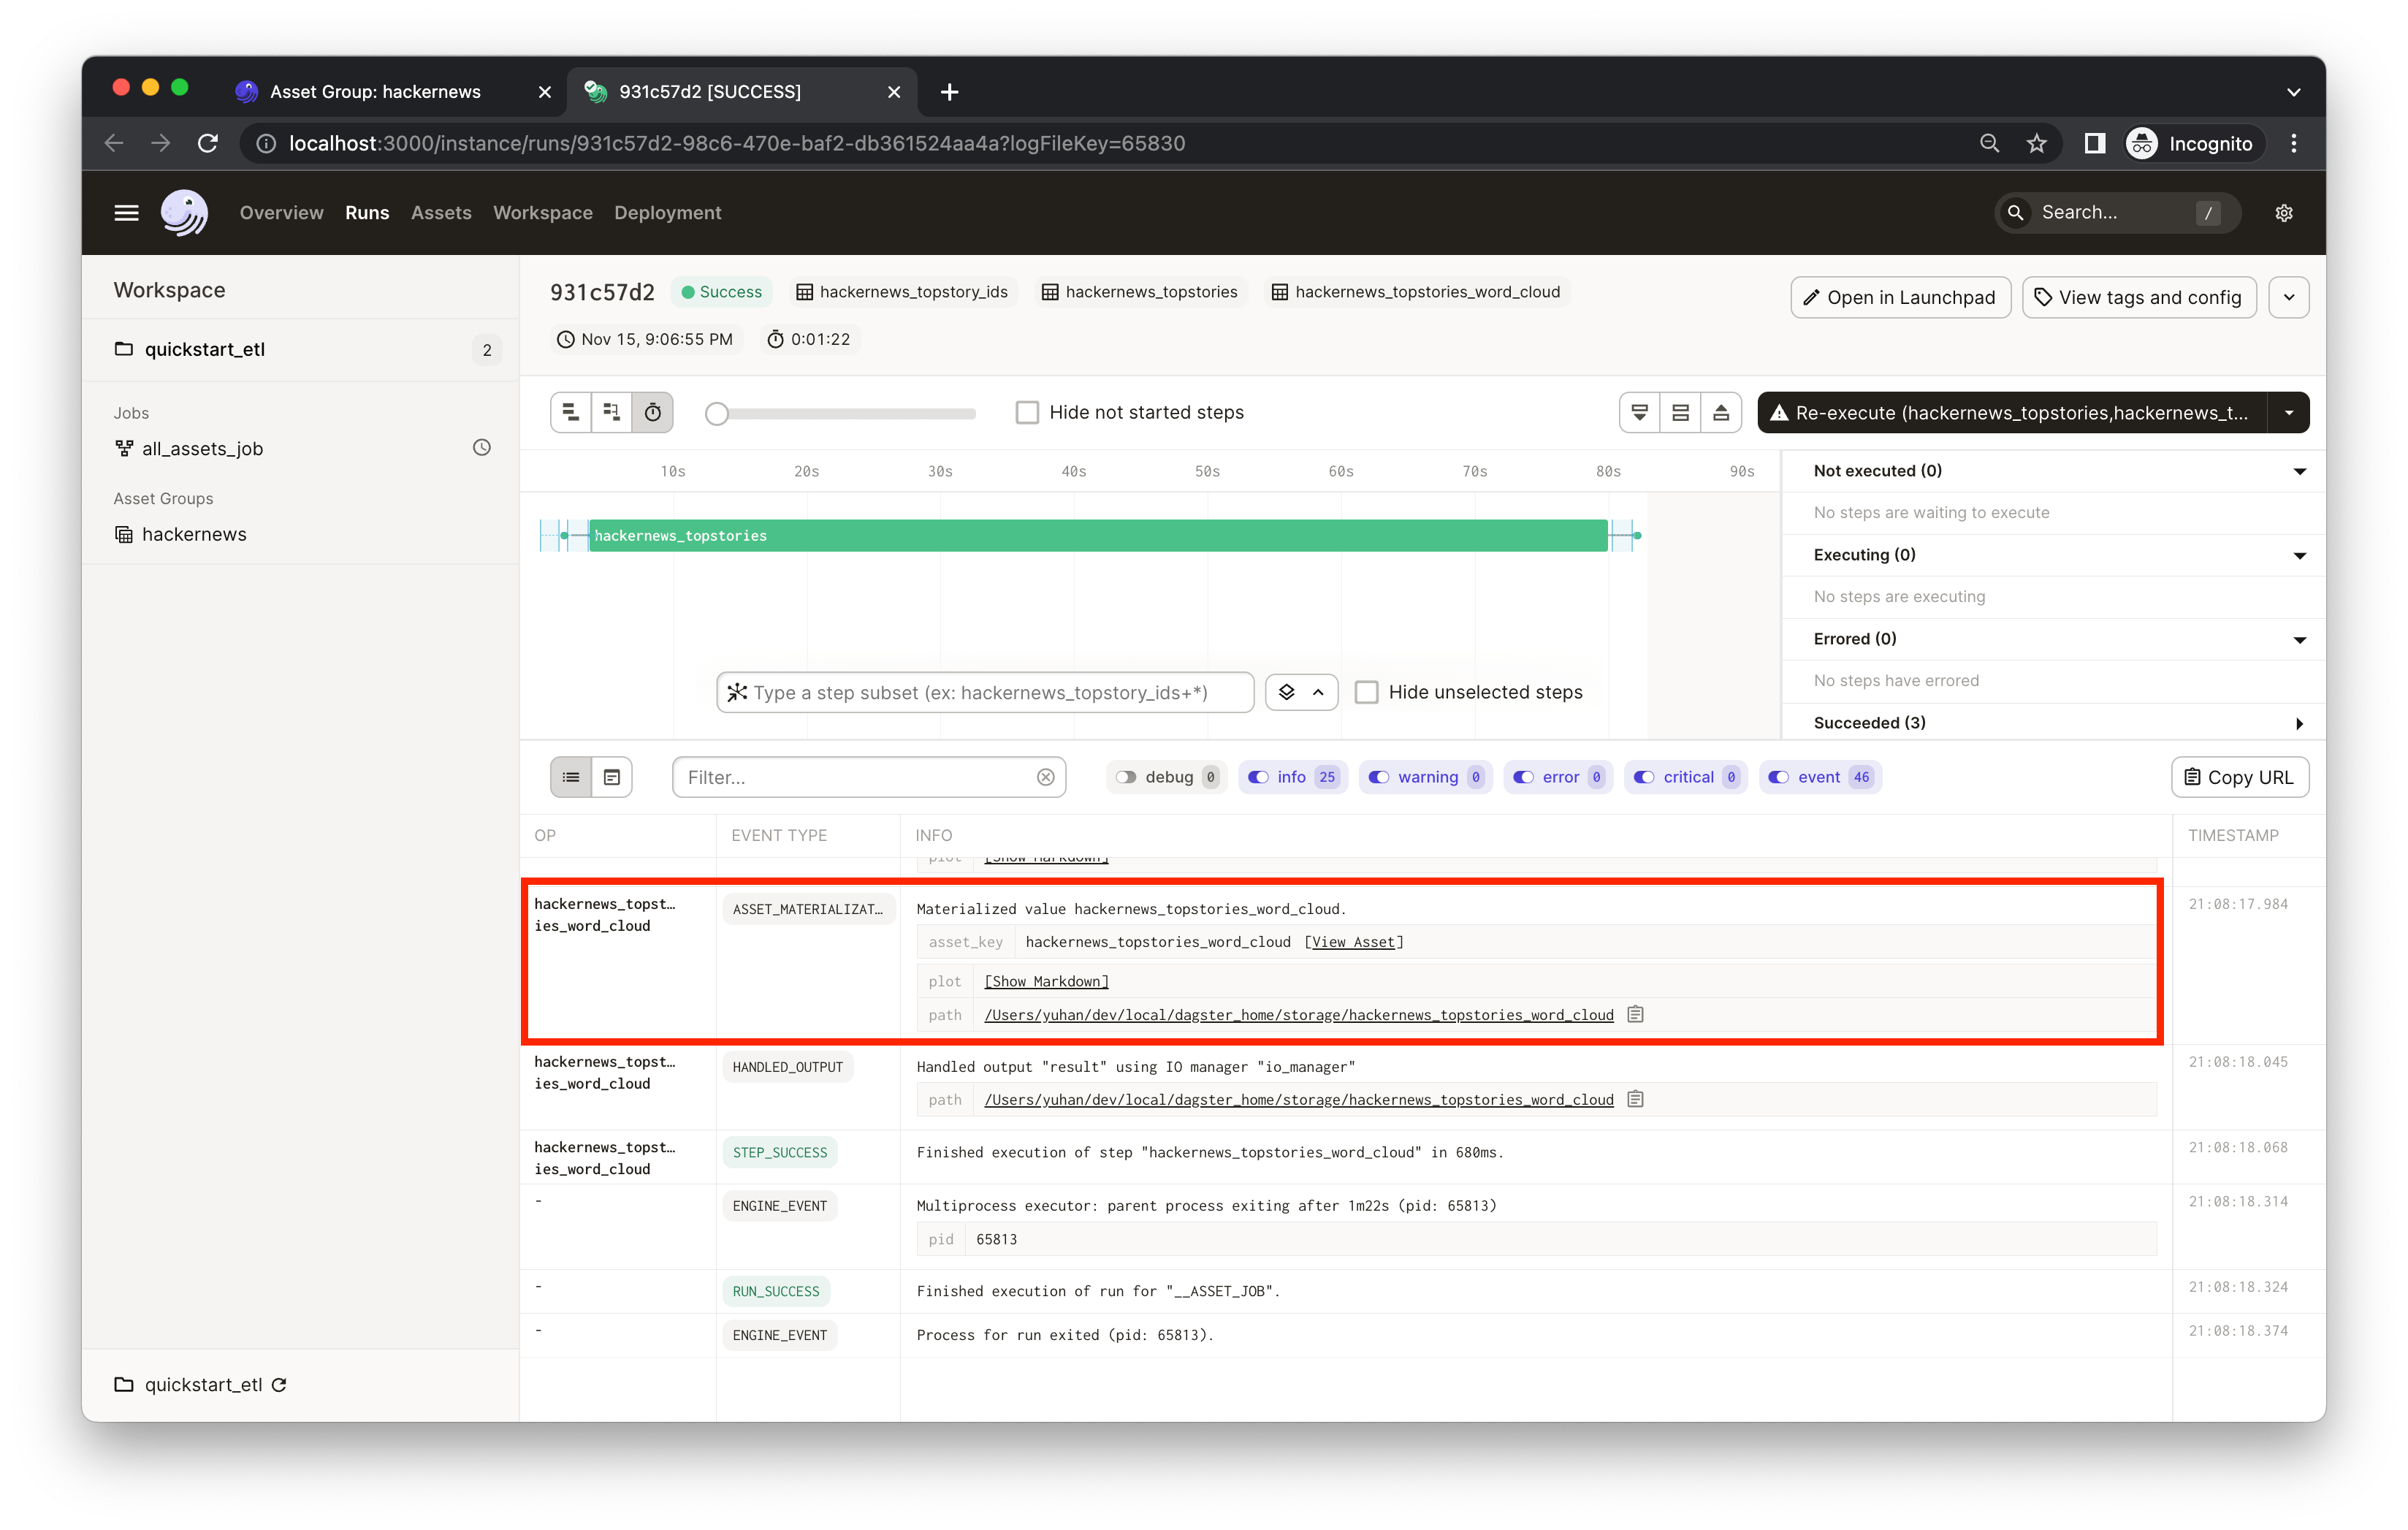
When you materialize an asset, the object returned by your asset function is saved. Dagster makes it easy to save these results to disk, to blob storage, to a database, or to any other system. In this example the assets are saved to the file system. In addition to the asset materialization, your asset functions can also generate metadata that is directly visible in Dagster. To view the materialization details and metadata, click on the "ASSET_MATERIALIZATION" event. In this example, the hackernews_stories_word_cloud asset materializes a plot that is saved to disk, but we also add the plot as metadata to make it visible in Dagster.
Click Show Markdown. You'll see a word cloud of the top 500 HackerNews story titles generated by the hackernews_topstories_word_cloud asset:

The metadata is recorded in the hackernews_topstories_word_cloud asset in quickstart_gcp/assets/hackernews.py. Dagster supports attaching arbitrary metadata to asset materializations. This metadata is also be displayed on the Activity tab of the Asset Details page in the UI or in the Asset Lineage view after selecting an asset. From the compute logs of a run, you can click the View Asset to go to the Asset Details page.

This metadata would be useful for monitoring and maintaining the asset as you iterate. Similarly, we've also recorded some metadata in the hackernews_topstories asset. You can filter the compute logs by typing the asset name (e.g. hackernews_topstories) or the event type (e.g. type:ASSET_MATERIALIZATION) in the Log Filter input box:
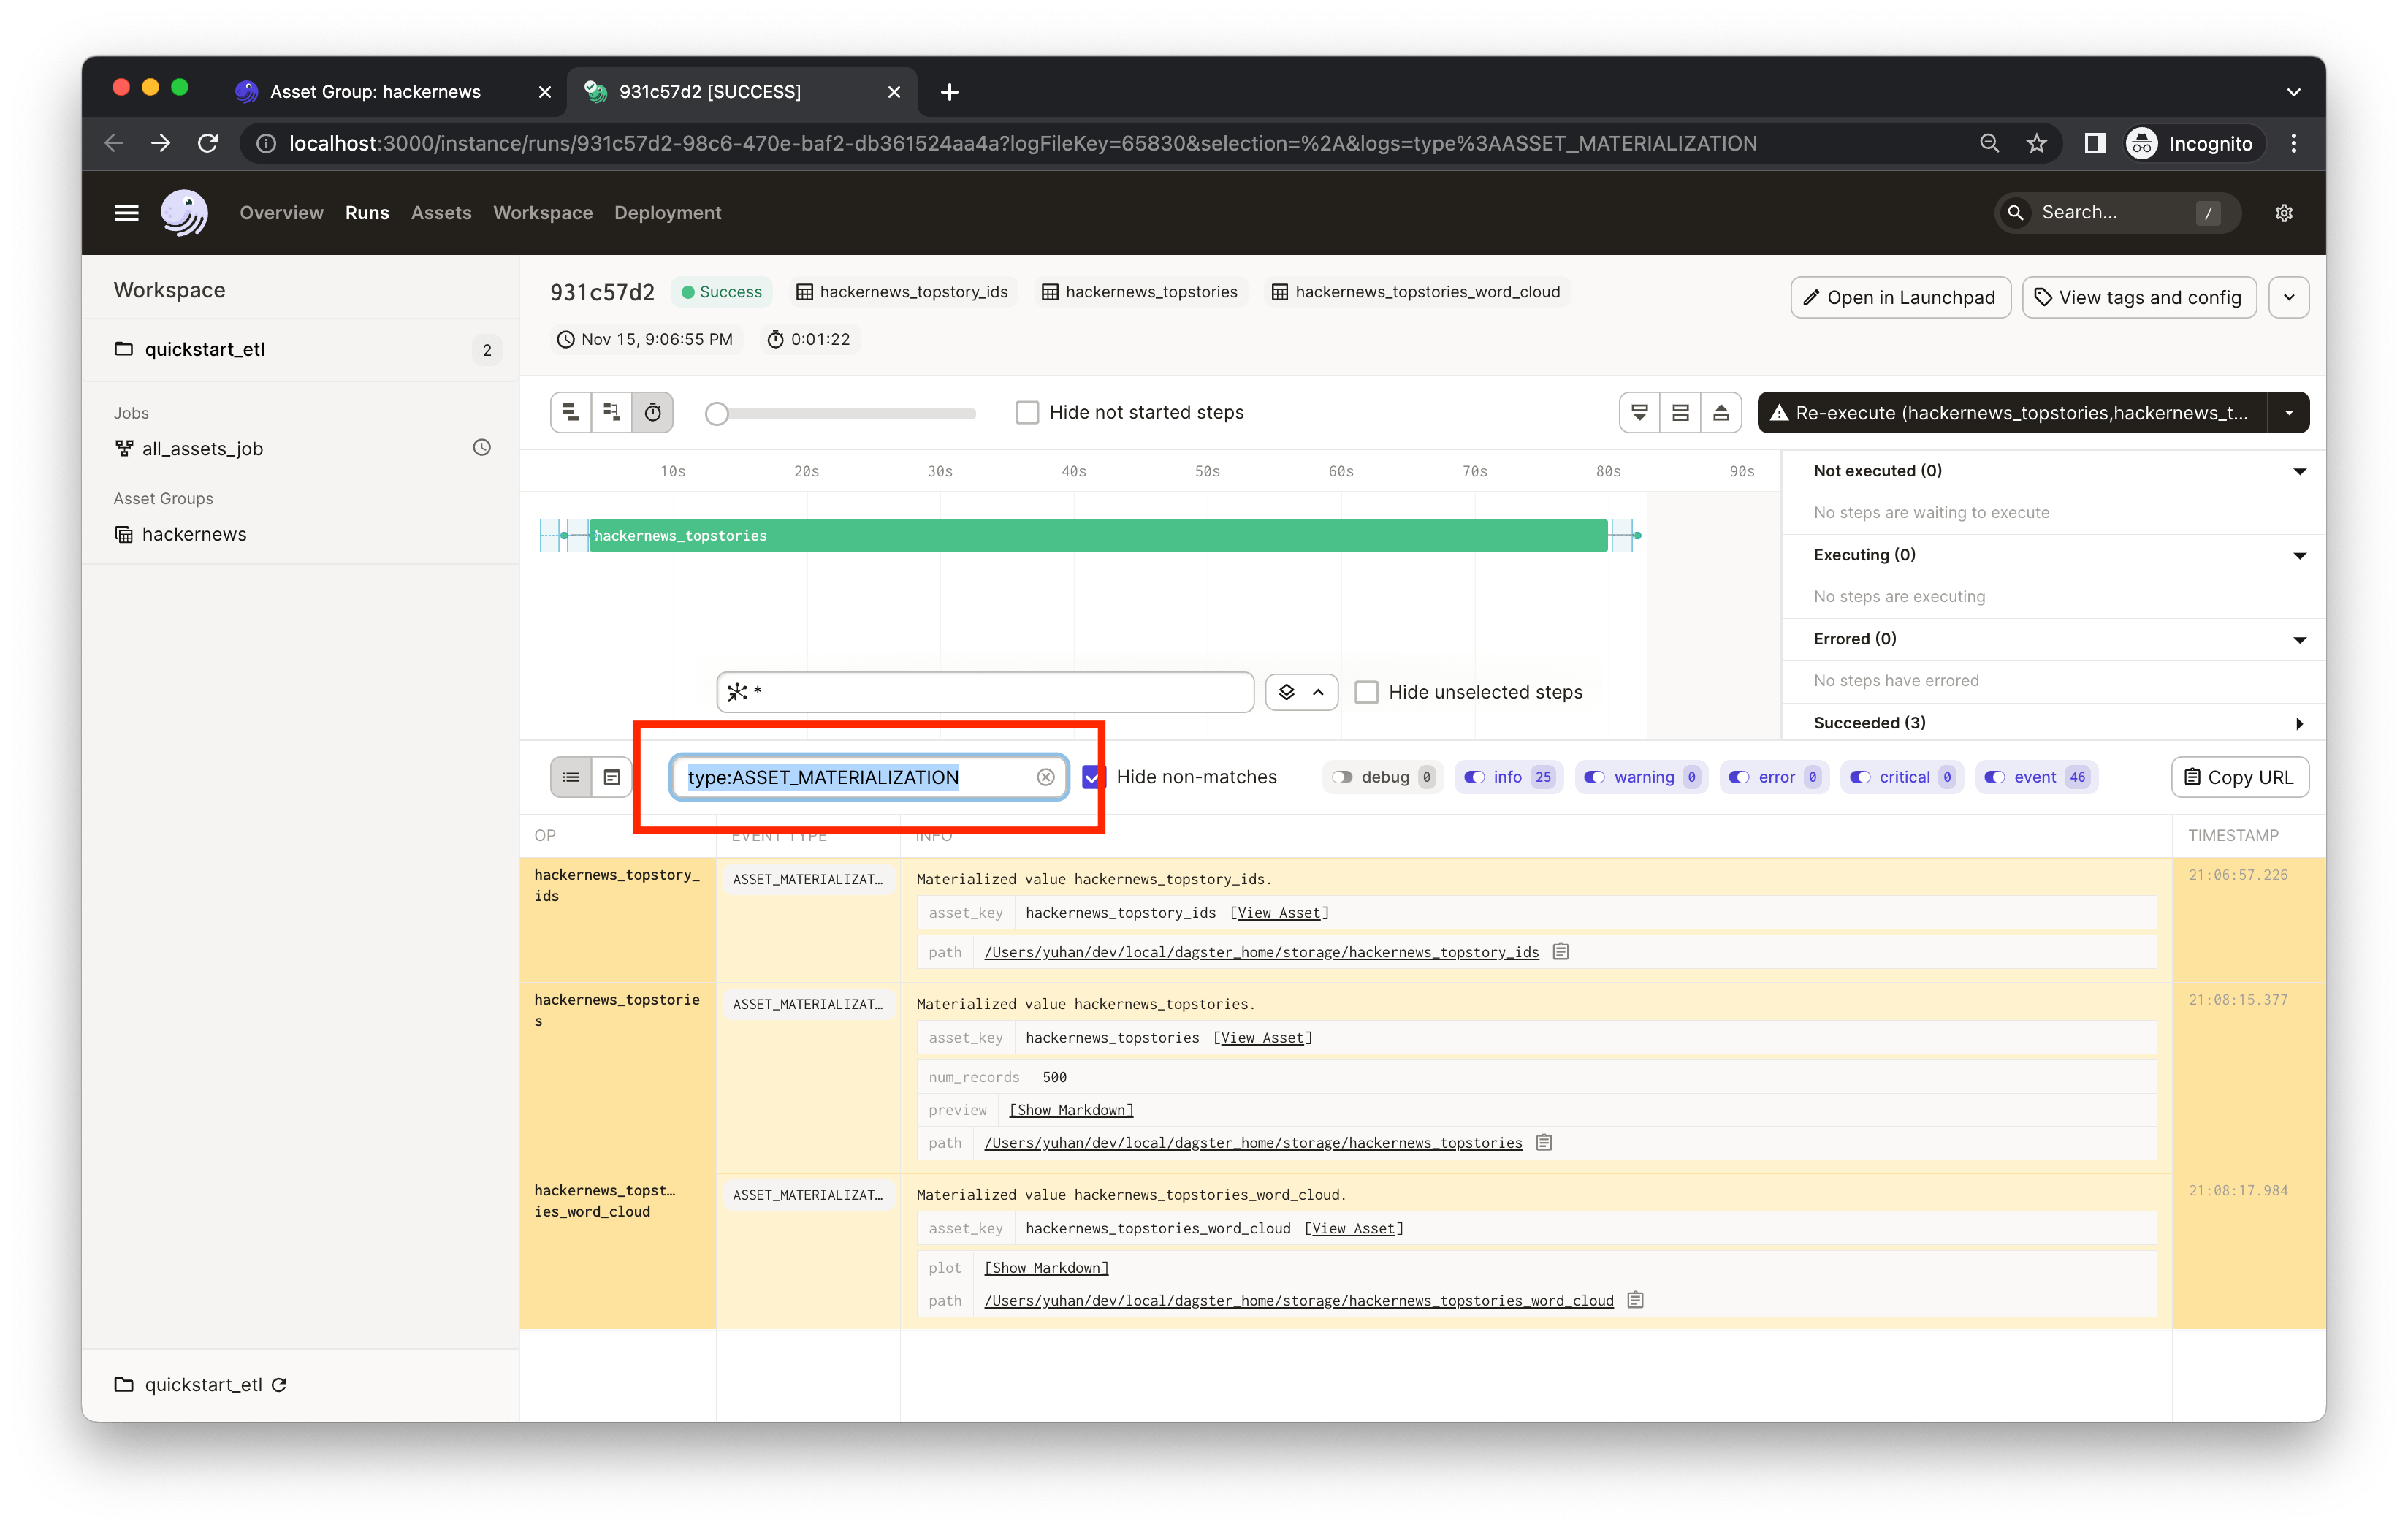
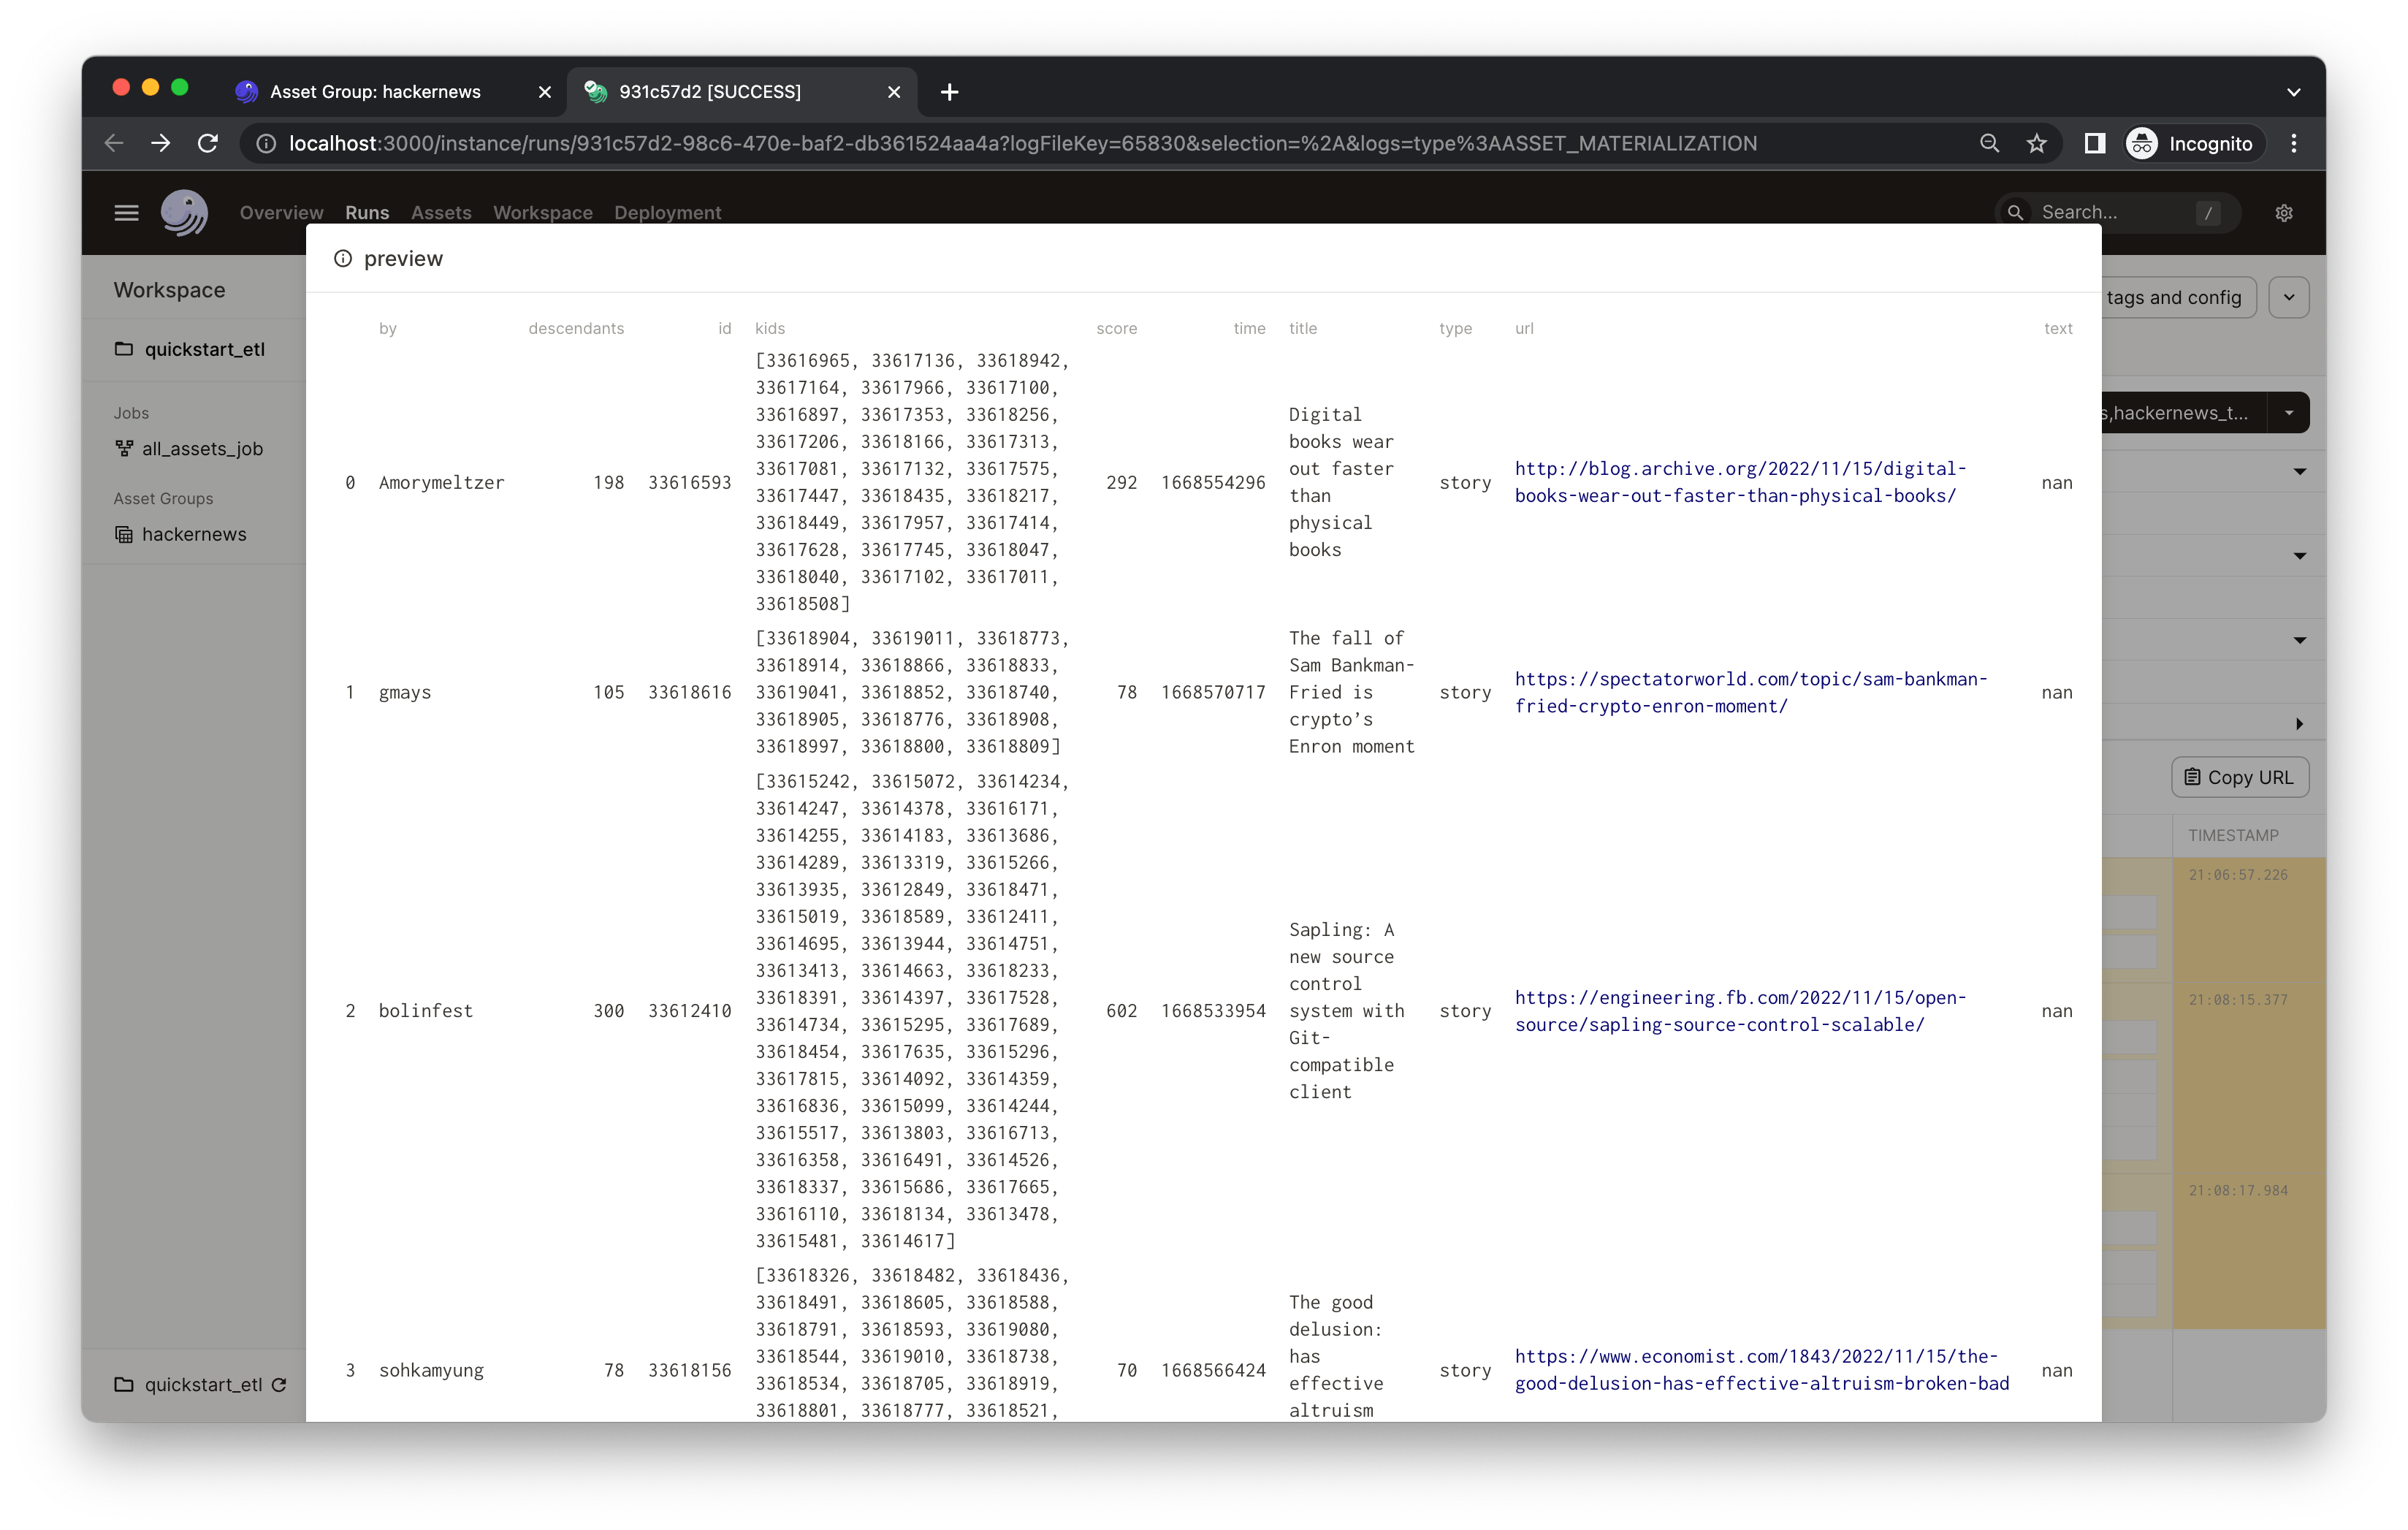
In the results, you'll see that the hackernews_topstories asset has two metadata entries: num_records and preview. Both are defined in quickstart_gcp/assets/hackernews.py, in which we record the first five rows of the output Pandas DataFrame in the preview metadata entry using the Markdown type. This could help debug and keep your assets easily monitored. Click Show Markdown to view a preview of the output data frame:
Note: You'll find a path metadata attached to every asset. This is because assets are, by default, materialized to pickle files on your local filesystem. In most projects, your assets will be materialized to a production system and you can fully customize the I/O using I/O managers.
Finally, let's refresh our plots every day so we can monitor popular topics over time. To do so, we can use schedules.
We've defined a daily schedule and job in quickstart_gcp/repository.py for all assets that are defined in the quickstart_gcp/assets/ module.
Now, let's turn on the daily schedule within Dagster.
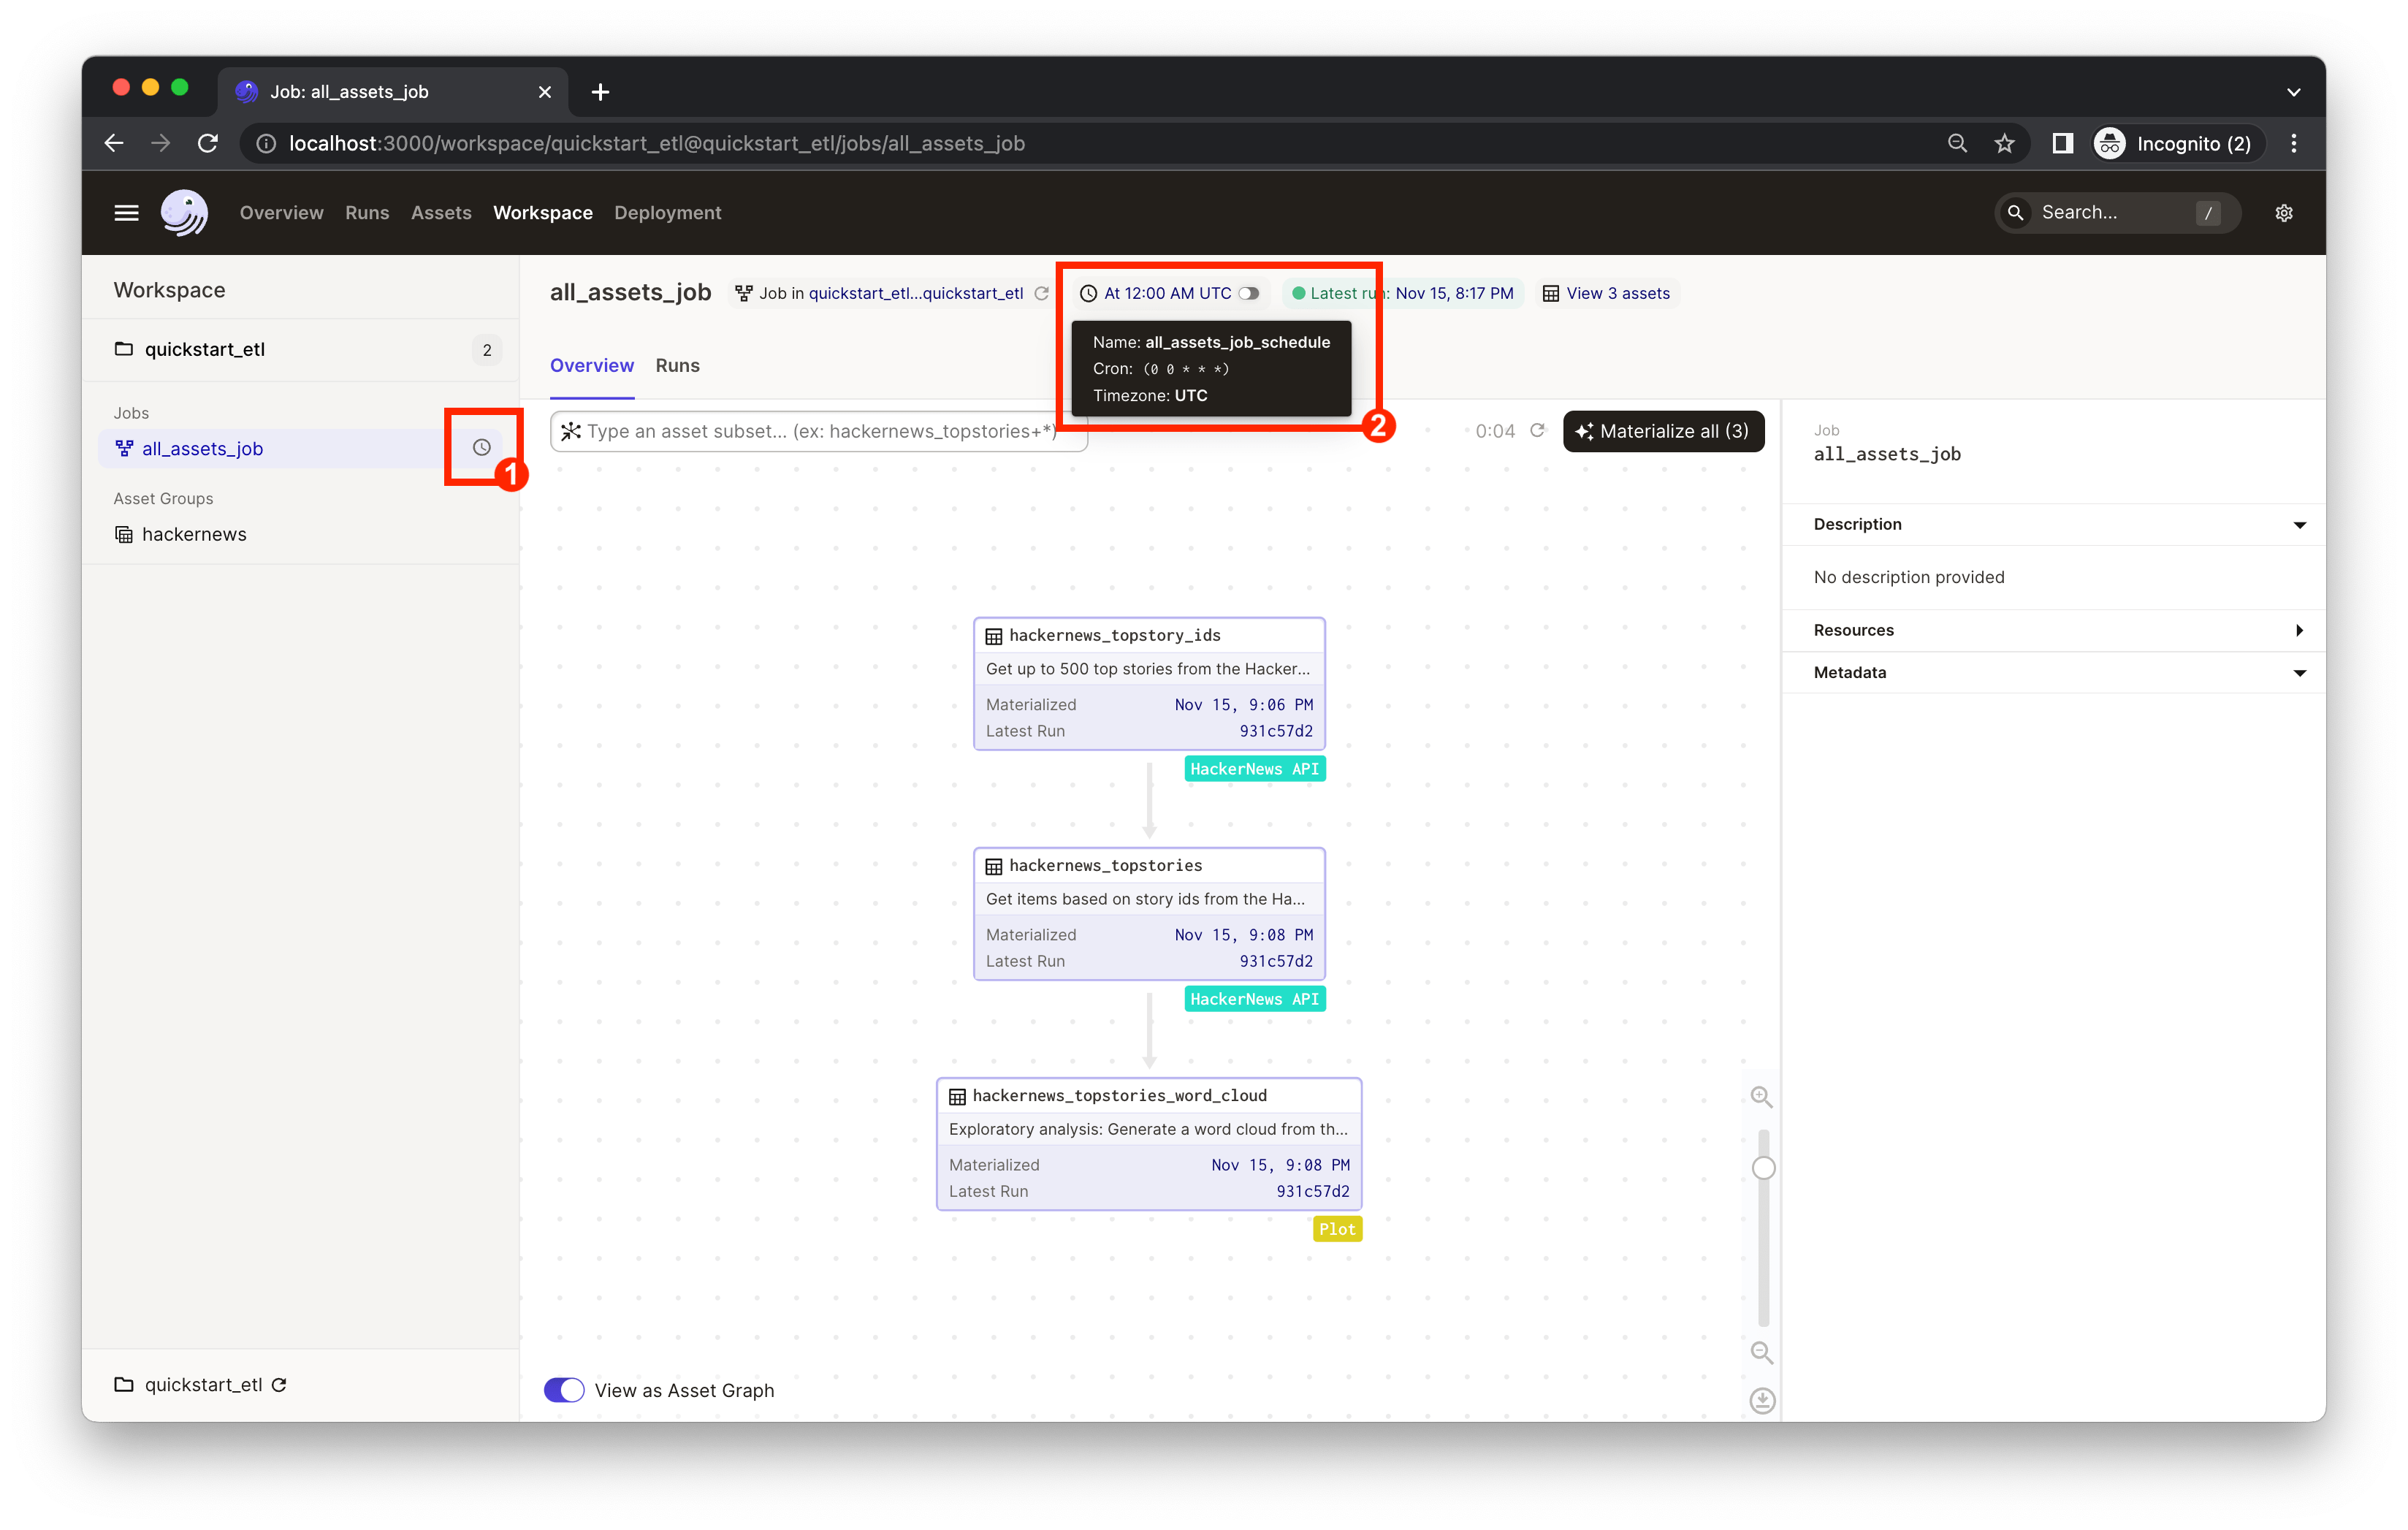
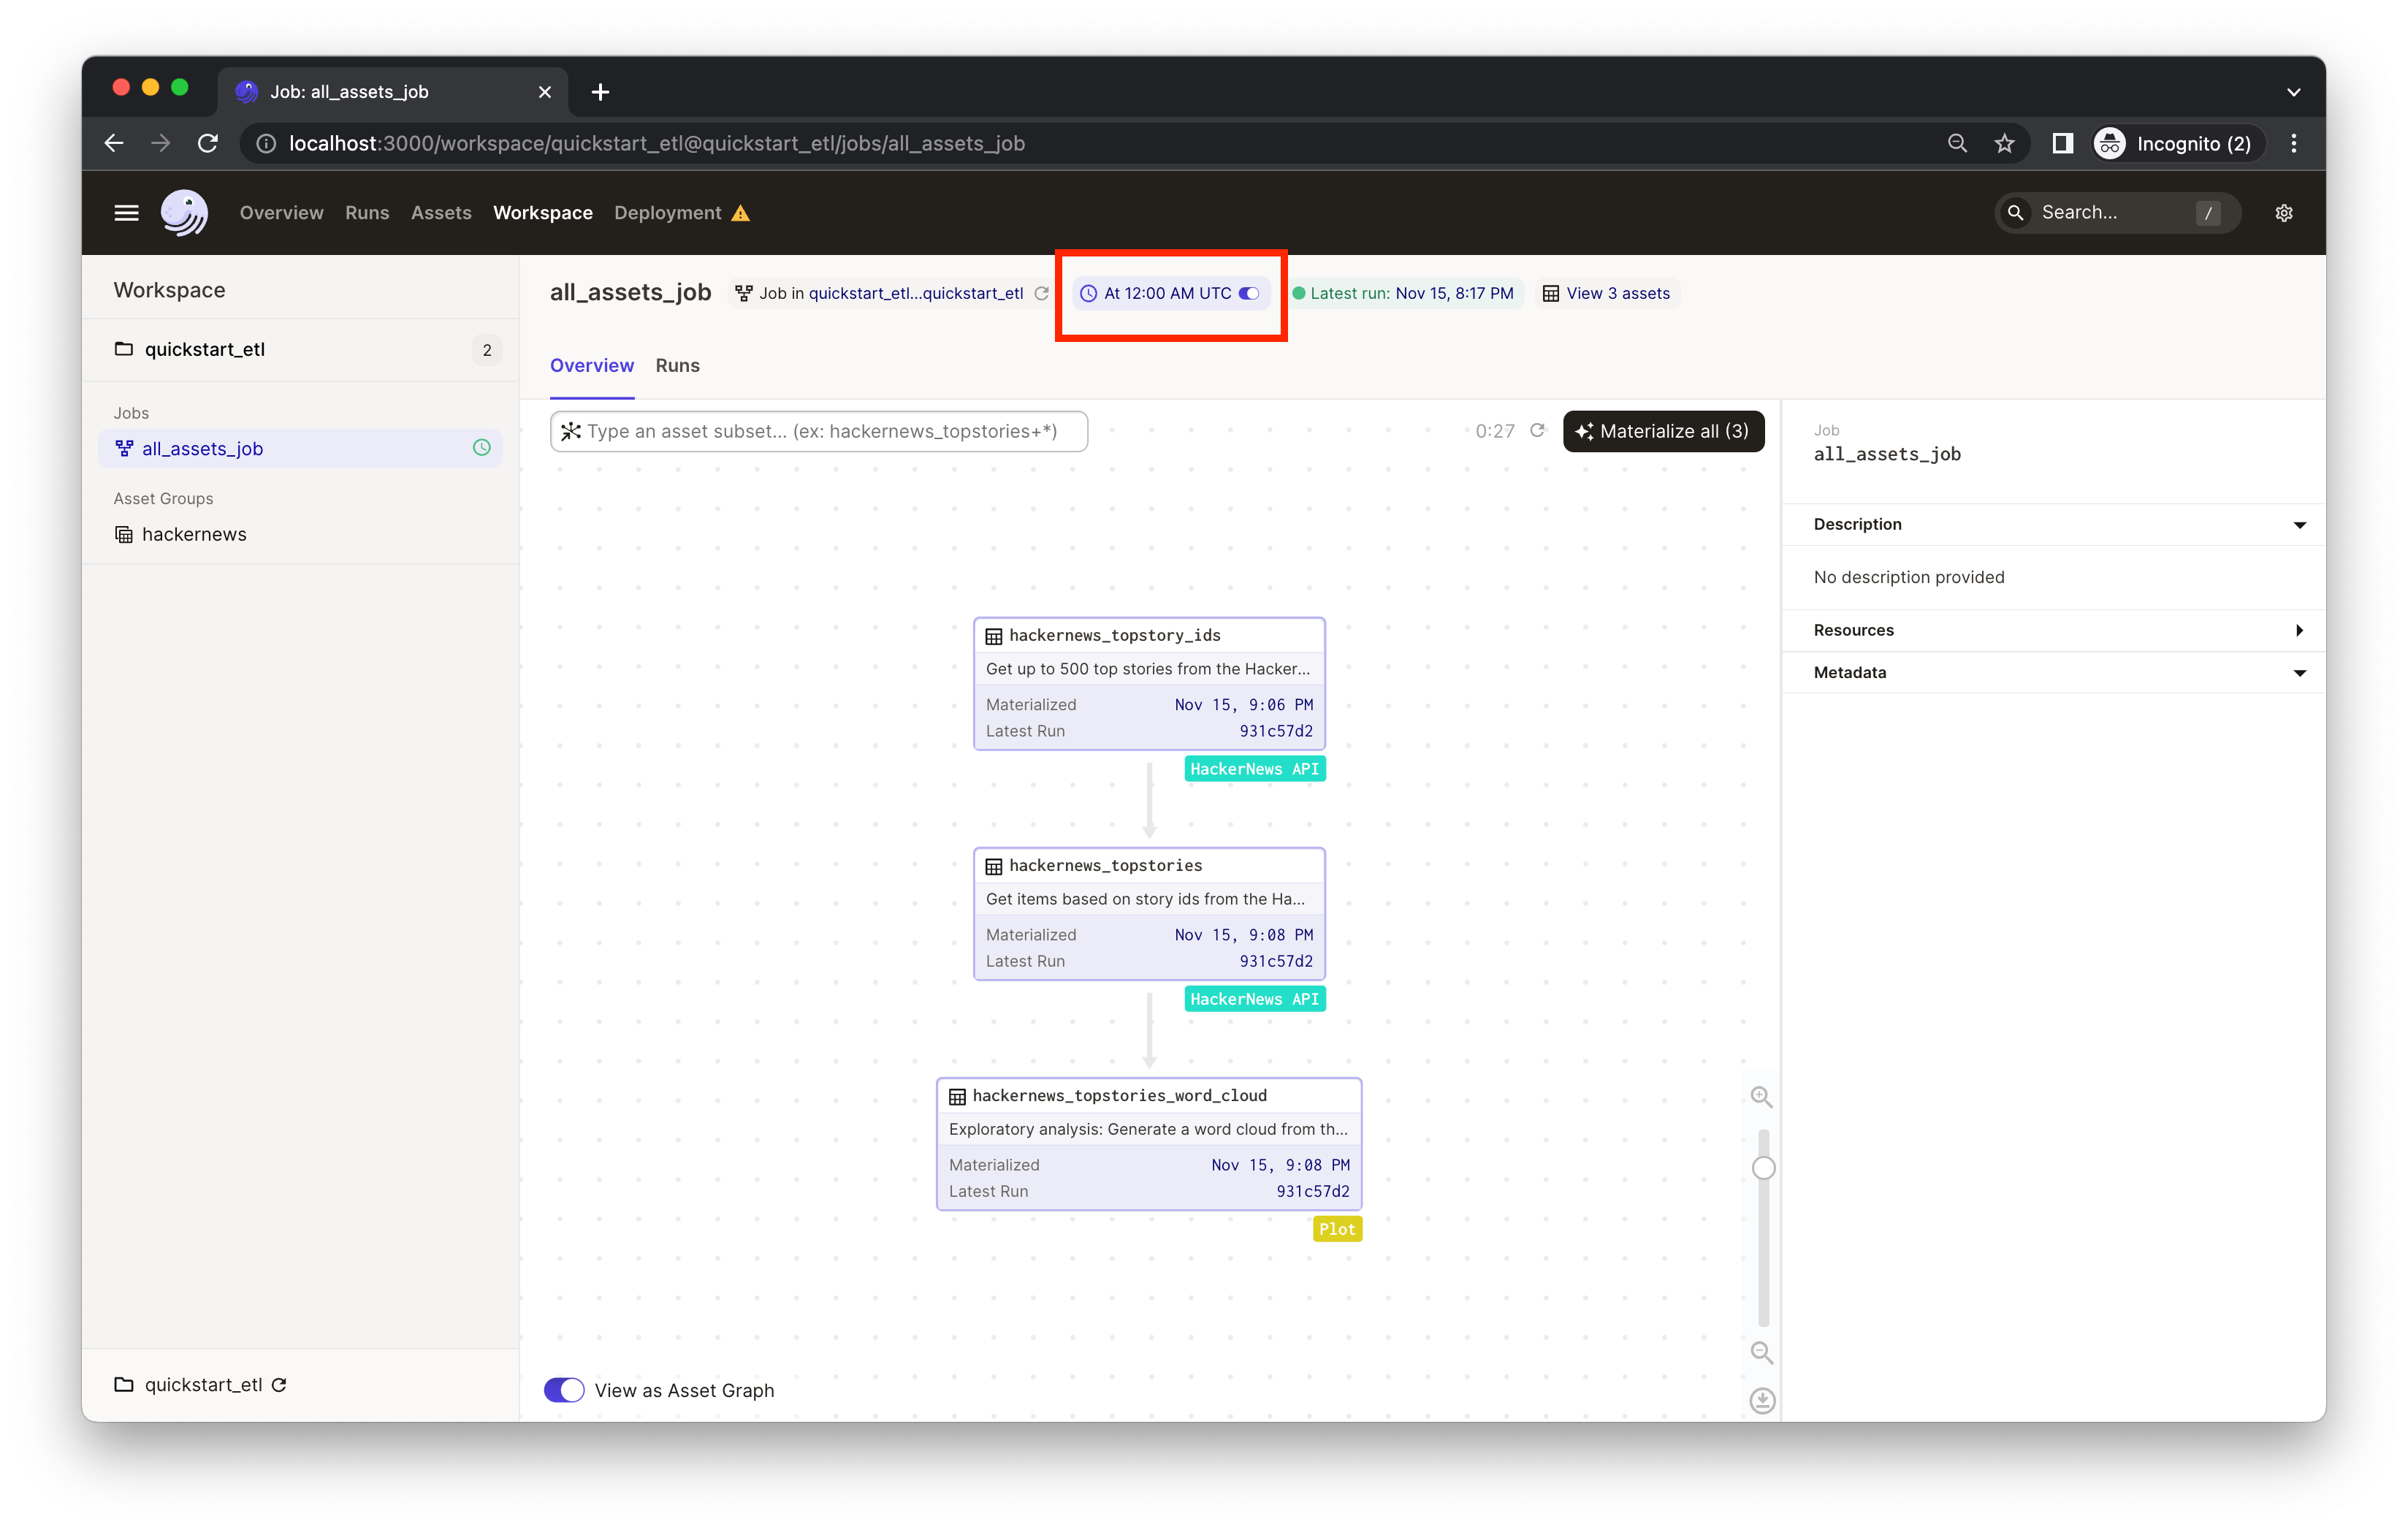
- In the left nav, it indicates the
all_assets_jobhas a schedule associated with it but it's currently off. Clicking "all_assets_job" in the left nav will bring you to the job definition page. - Mouse over the schedule indicator on the top of the page to navigate to the individual schedule page for more info about the schedule.
You can now turn on the schedule switch to set up the daily job we defined in quickstart_gcp/repository.py.
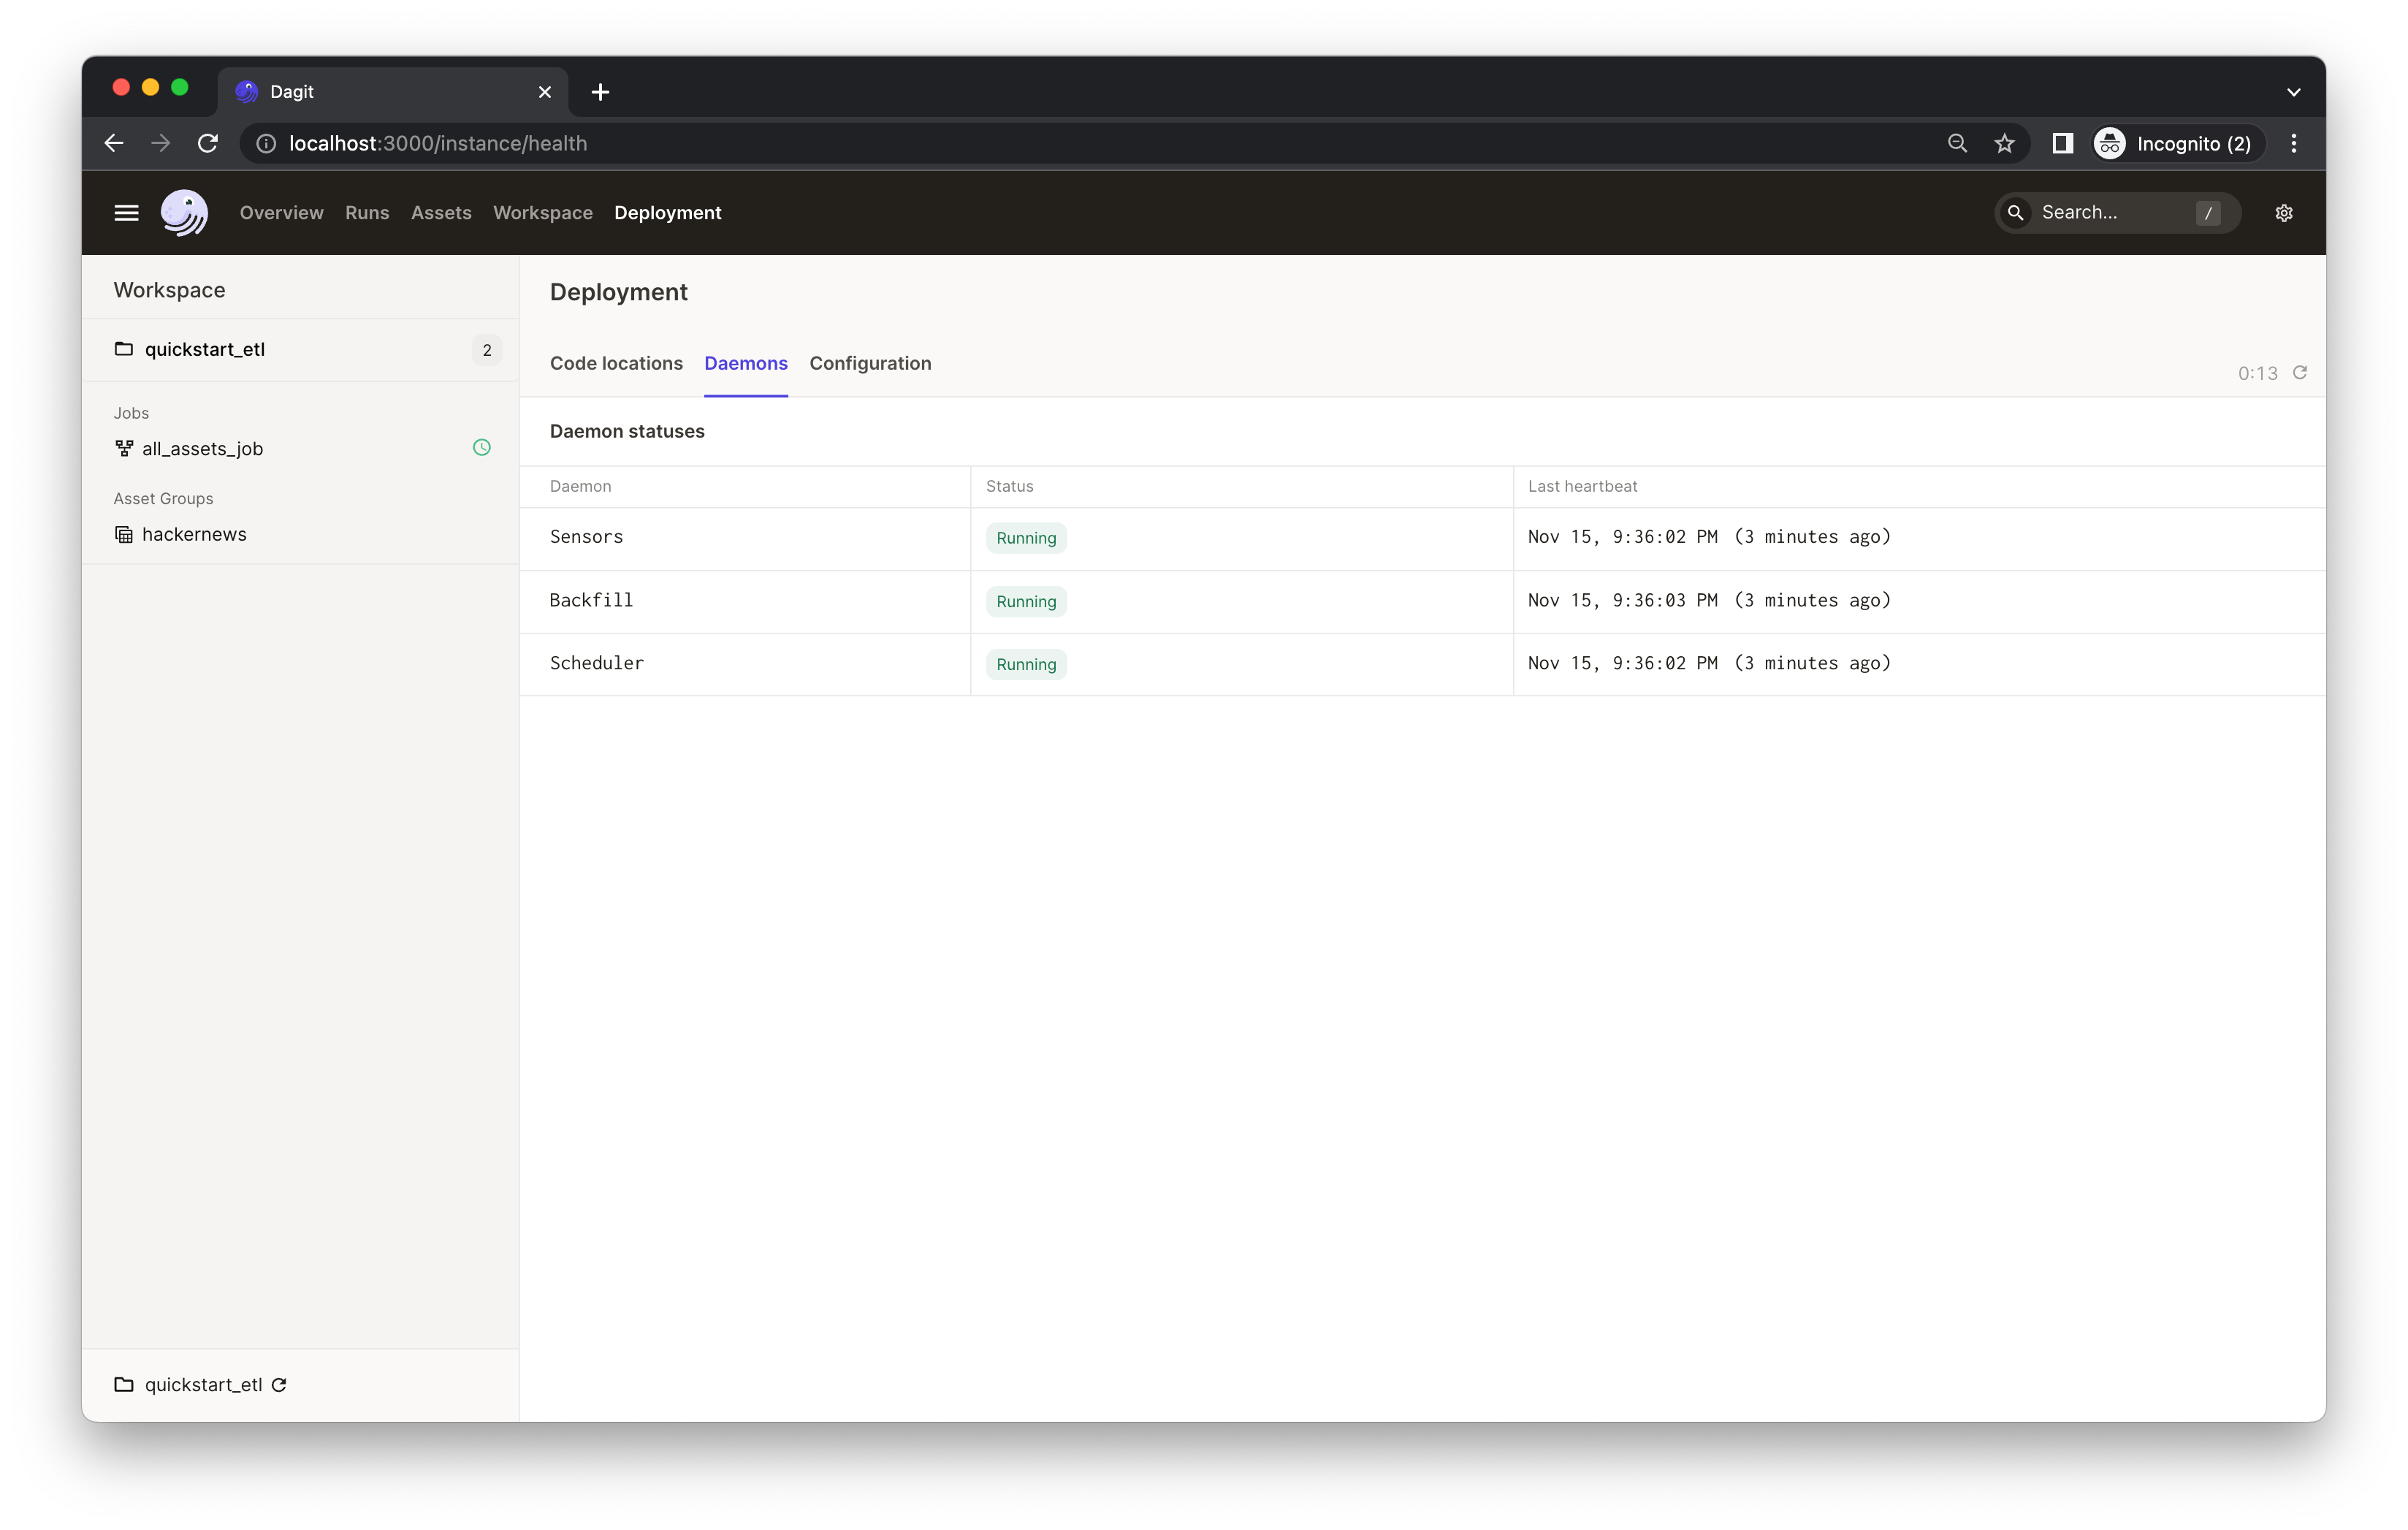
If you're running Dagster locally, you will see a warning that your daemon isn’t running.

👈 Expand to learn how to set up a local daemon
If you want to enable Dagster schedules for your jobs, start the Dagster daemon process in the same folder as your workspace.yaml file, but in a different shell or terminal.
The $DAGSTER_HOME environment variable must be set to a directory for the daemon to work. Note: using directories within /tmp may cause issues. See Dagster Instance default local behavior for more details.
In this case, go to the project root directory and run:
dagster-daemon runOnce your Dagster daemon is running, the schedules that are turned on will start running.
Congratulations 🎉 You now have a daily job running in production!
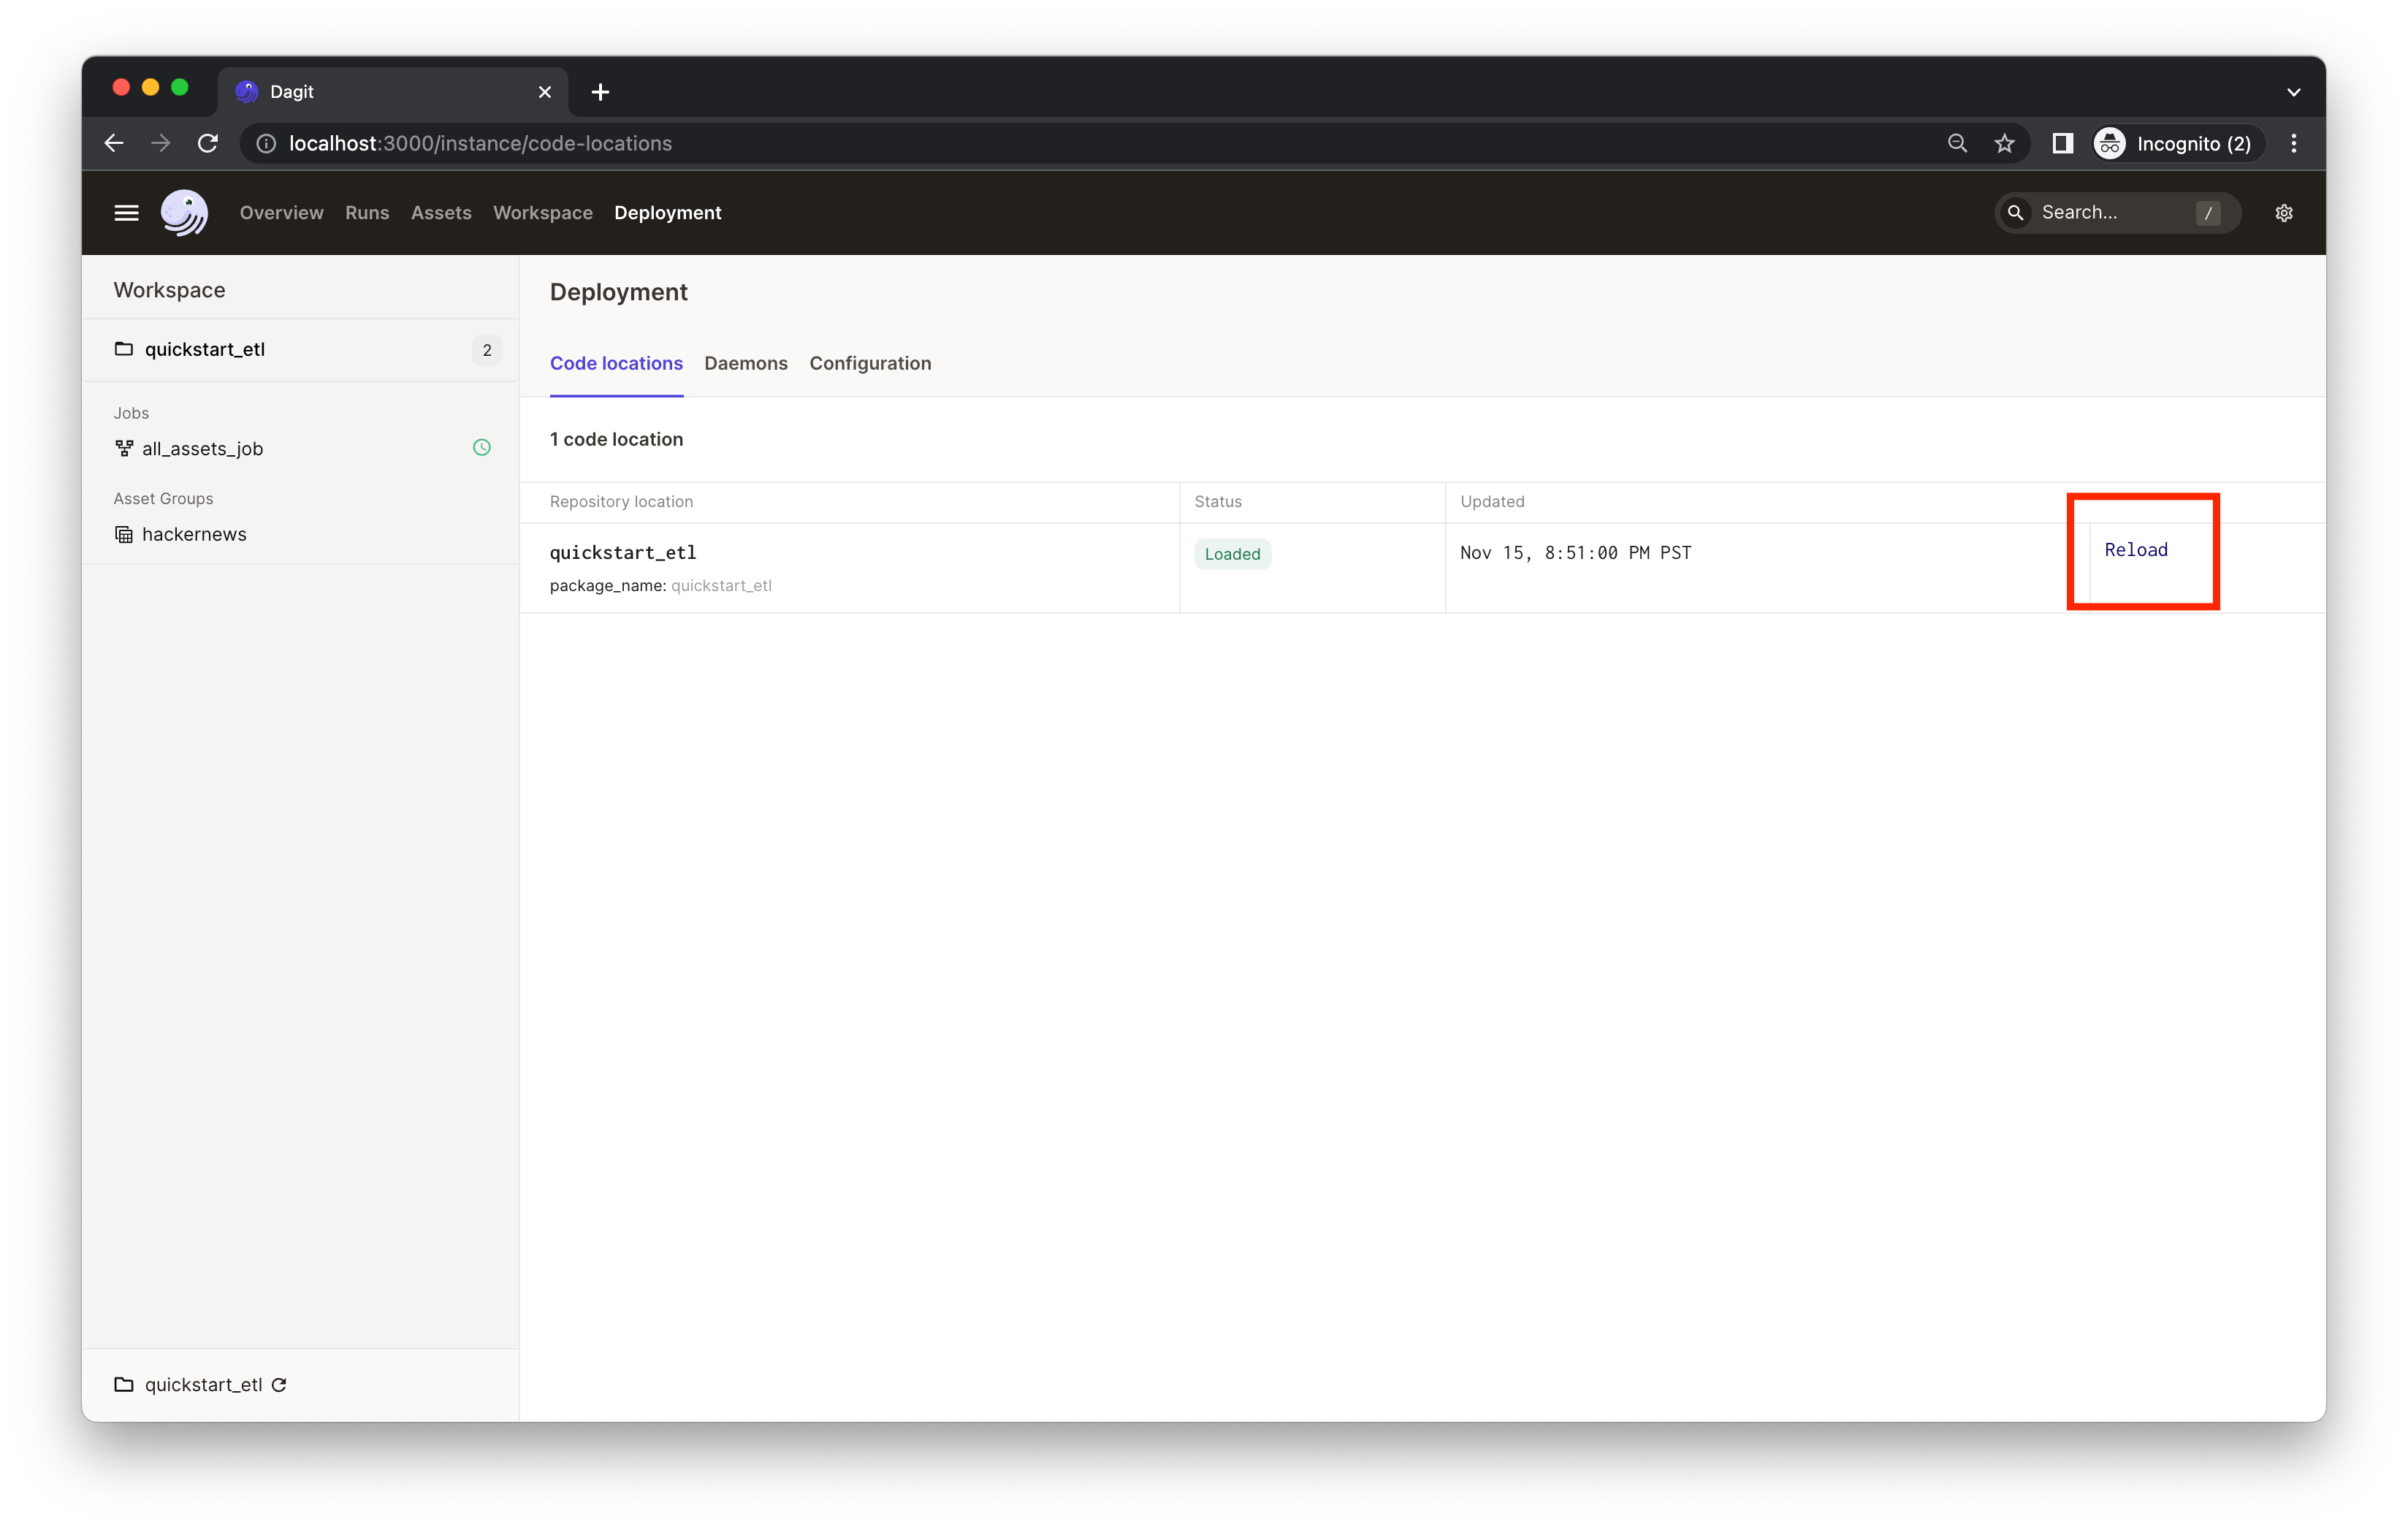
When developing pipelines locally, be sure to click the Reload definition button in the Dagster UI after you change the code. This ensures that Dagster picks up the latest changes you made.
You can reload the code using the Deployment page:
👈 Expand to view the screenshot
Or from the left nav or on each job page:
👈 Expand to view the screenshot

This example comes with a custom I/O manager. To learn more about I/O managers and see more examples, check out the I/O Manager concept page.
You can specify new Python dependencies in setup.py.
Tests are in the quickstart_gcp_tests directory and you can run tests using pytest:
pytest quickstart_gcp_tests