The goal of gurugis is to provide a series of functions useful to advanced GIS spatial analysis workflow.
You can install the development version from GitHub with:
# install.packages("devtools")
devtools::install_github("damienjacques/gurugis")This is a basic example which shows you how to make quick zonal statistics from a raster and a vector layer defining the areas:
library(gurugis)
library(raster)
#> Loading required package: sp
library(sf)
#> Linking to GEOS 3.5.1, GDAL 2.2.2, PROJ 4.9.2

# raster file for which I want to compute zonal statistics
plot(precipitation)
# vector layer with the zones
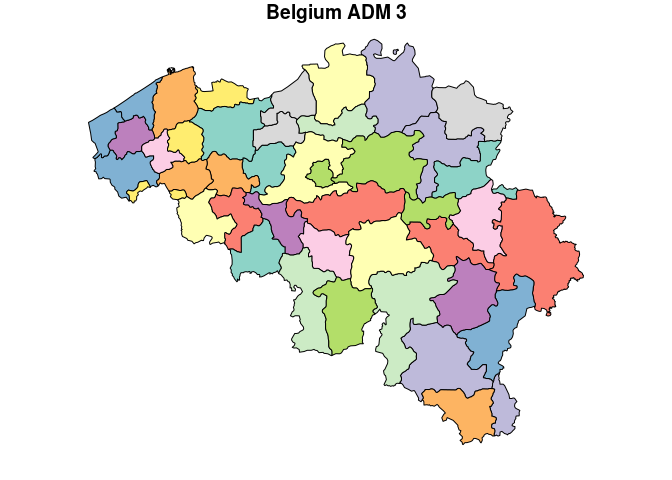
plot(belgium[10], main = "Belgium ADM 3")# compute average of precipiation in each zone
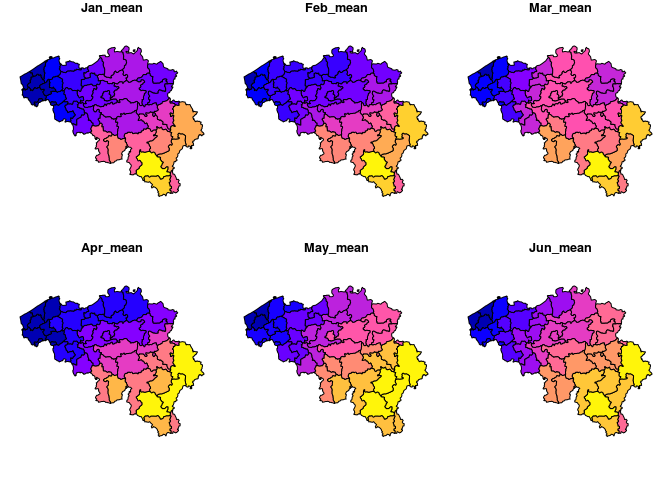
output <- zonal_pipe(precipitation, belgium, stats = "mean")
# plot 6 first months
plot(output[18:23])


