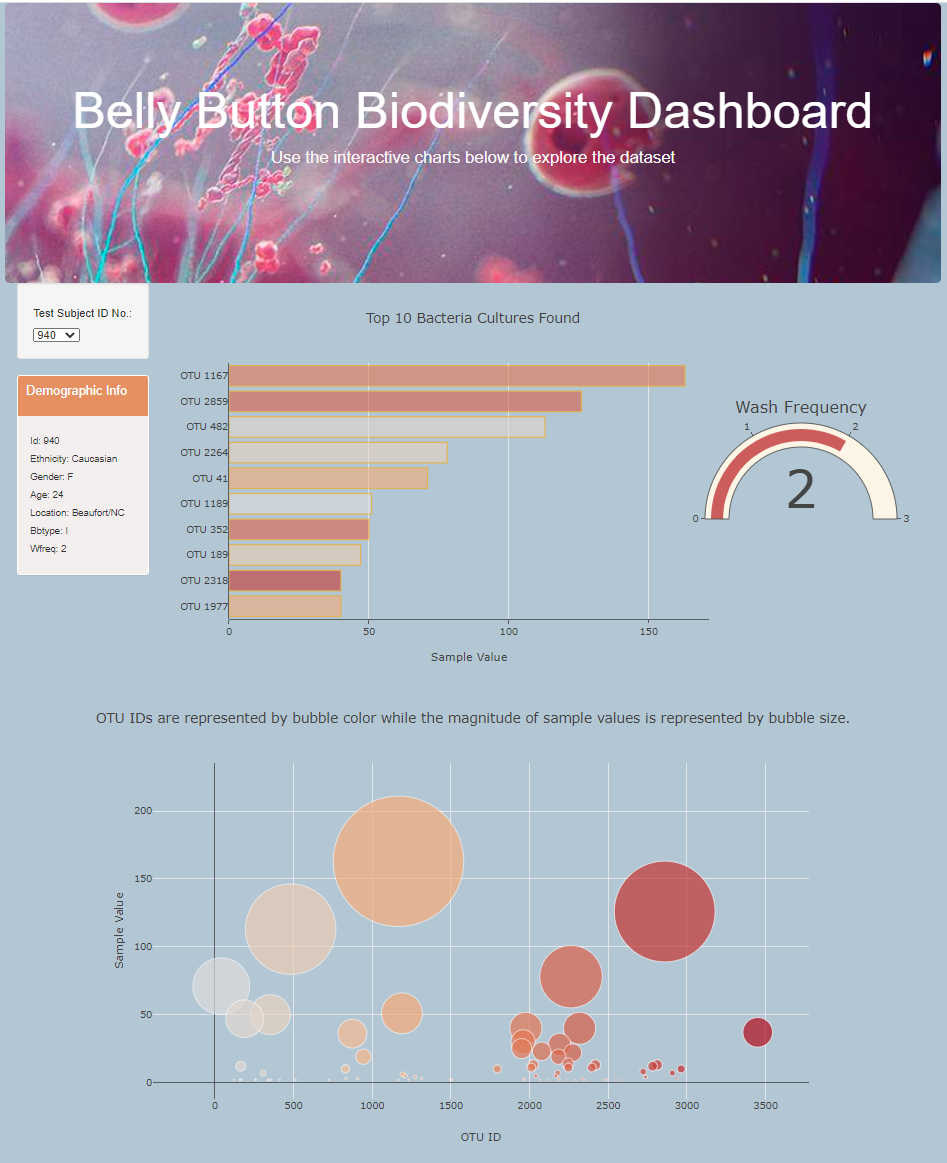
Plotly, JavaScript, HTML, and CSS, and D3.js are used to create interactive charts for a bacteria dataset. The table can be filtered by test subject ID from the dropdown menu located in left hand navigation menu: View GitHub-Page
Once the user has selected a test subject the, at a maximum, top ten bacterium found in the test subject's bellybutton will be displayed as a bar and a bubble chart. The Wash Frequency is displayed as a gauge chart to allow the user to determine whether there is a correlation between bathing and bacteria volume.
To view the JavaScript code: JavaScript Code
to view the CSS code: CSS Code
To view the HTML code: HTML Code

