This Jupyter lab notebook provides an analysis of the housing rental market data for San Francisco for the time period of 2010 to 2016.
Specifically, it provides:
- An interactive plot of the number housing units per year in San Francisco.
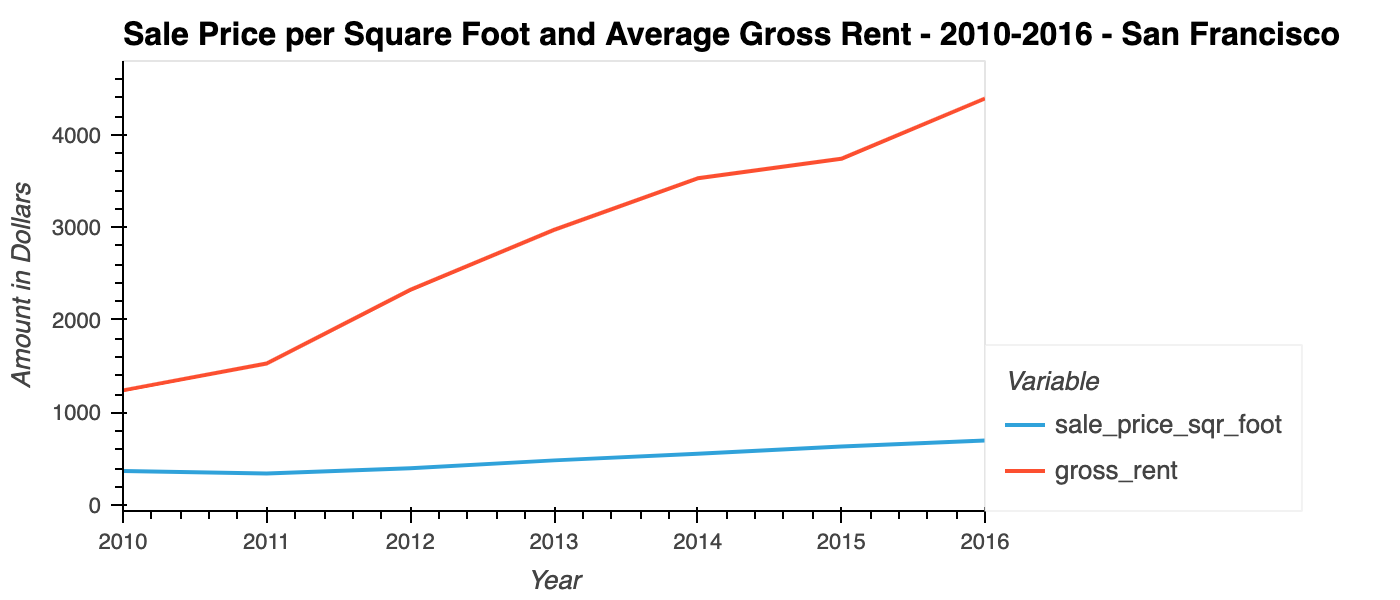
- An interactive plot showing average sale price per square foot and average gross rent for the San Francisco area.
- An interactive plot breaking down the average sale price per square foot and average gross rent on a per-neighborhood basis.
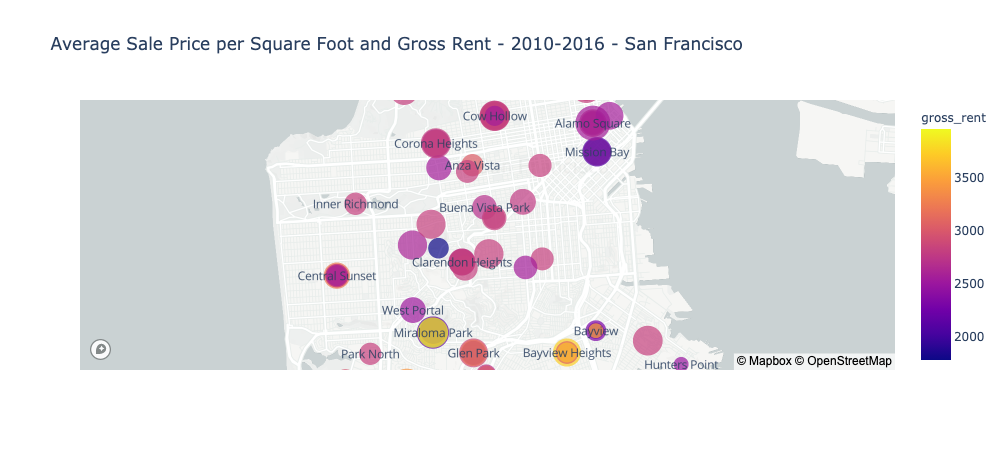
- An interactive neighborhood map that geographically shows the average sale price per square foot and average gross rent.
- A data story/analysis of the rental income growth vs sale price and whether it makes sense to develop a one-click buy-and-rent business in San Francisco based on this data.
This analysis is a Jupyter lab notebook that makes use of the following Python libraries:
- Pandas
- Pathlib
- Python Dotenv
- PyViz - hvPlot library
- PyViz - Plotly Express library
- Mapbox API
To use this notebook:
- Install Jupyter lab Version 2.3.1 and Python 3.7.
- Install Python Dotenv.
- Install PyViz visualization package.
- Install Plotly Express version 4.13.0.
- Install hvPlot version 0.7.0 or later.
- Install NodeJS version 12 or later.
Open the notebook in Jupyter lab and you can rerun the analysis.
Here are examples of the type of interactive plots in this notebook:
Michael Danenberg
MIT

