Google BSD license http://code.google.com/google_bsd_license.html
Copyright 2012 Google Inc. wrightt@google.com
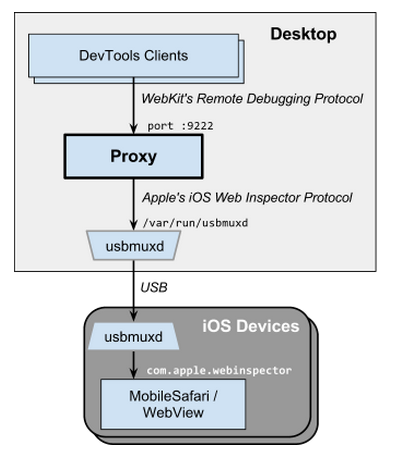
The ios_webkit_debug_proxy allows developers to inspect MobileSafari and UIWebViews on real and simulated iOS devices via the DevTools UI and WebKit Remote Debugging Protocol. DevTools requests are translated into Apple's Remote Web Inspector service calls, as illustrated below:
The proxy detects when iOS devices are attached/removed and provides the current device list on http://localhost:9221. A developer can click on a device's link (e.g. http://localhost:9222) to list that device's open tabs, then click on a tab link (e.g. http://localhost:9222/devtools/page/1) to inspect that tab in their browser's DevTools UI.
Equivalent JSON-formatted APIs are provided for programmatic clients: http://localhost:9221/json to list all devices, http://localhost/9222/json to list device ":9222"'s tabs, and ws://localhost:9222/devtools/page/1 to inspect a tab. See the examples/README for example clients.
Linux and OS X are currently supported. Windows support is planned but not implemented yet.
The proxy requires the following open-source packages:
On a Mac, it's easiest to use brew:
brew install ios-webkit-debug-proxy
On Linux or Mac:
  sudo apt-get install \
      autoconf automake \
      libusb-dev libusb-1.0-0-dev \
      libplist-dev libplist++-dev \
      usbmuxd libtool \
      libimobiledevice-dev

  git clone git@github.com:google/ios-webkit-debug-proxy.git
  cd ios-webkit-debug-proxy

  ./autogen.sh
  make
  sudo make install
On Linux you must run the usbmuxd daemon. The above install adds a /lib/udev rule to start the daemon whenever a device is attached. To verify that usbmuxd can list your attached device(s), run idevice_id -l
To start the proxy, run:
ios_webkit_debug_proxy
Press Ctrl-C to quit. The proxy can be left running as a background process. Add "-d" for verbose output. Run with "--help" for more options.
The iOS Simulator is supported but, for now, the simulator must be started before the proxy. The simulator can be started in XCode as usual, or via the command line:
   SIM_DIR=/Applications/Xcode.app/Contents/Developer/Platforms/iPhoneSimulator.platform/Developer
   "$SIM_DIR/Applications/iPhone Simulator.app/Contents/MacOS/iPhone Simulator" \
       -SimulateApplication \
       $SIM_DIR/SDKs/iPhoneSimulator6.1.sdk/Applications/MobileSafari.app/MobileSafari
The default configuration works well for most developers.
As noted above, the device_id-to-port assignment defaults to:
  :9221 for the device list
  :9222 for the first iOS device that is attached
  :9223 for the second iOS device that is attached
  ...
  :9322 for the max device
If a port is in use then the next available port will be used, up to the range limit.
The port assignment is first-come-first-serve but is preserved if a device is detached and reattached, assuming that the proxy is not restarted, e.g.:
- start the proxy
- the device list gets :9221
- attach A gets :9222
- attach B gets :9223
- detach A, doesn't affect B's port
- attach C gets :9224 (not :9222)
- reattach A gets :9222 again (not :9225)
The port assignment rules can be set via the command line. The default is equivalent to:
ios_webkit_debug_proxy -c null:9221,:9222-9322
where "null" represents the device list. The following example restricts the proxy to a single device and port:
ios_webkit_debug_proxy -c 4ea8dd11e8c4fbc1a2deadbeefa0fd3bbbb268c7:9227
For more information, run the proxy with "--help".
By default, the DevTools UI "frontend" HTML, JS, and image files are proxied from:
http://chrome-devtools-frontend.appspot.com/static/18.0.1025.74/devtools.html
You can use the -f argument to specify different source, e.g. a local
WebKit checkout:
ios_webkit_debug_proxy -f /usr/local/WebCore/inspector/front-end/inspector.html
or a remote server:
ios_webkit_debug_proxy -f http://foo.com:1234/bar/inspector.html
The value must end in ".html"
To disable the frontend proxy, use the --no-frontend argument.
Or, instead of using the proxied DevTools UI files, you can use Chrome's local "chrome-devtools:" resource files if you know the device port and page number, e.g.:
chrome-devtools://devtools/devtools.html?host=localhost:9222&page=1
Ideally we could use -f chrome-devtools://devtools/devtools.html, but Chrome's
sandbox blocks the generated links with a JavaScript console error:
Not allowed to load local resource: chrome-devtools://...
even if you launch Chrome with --allow-file-access-from-files.
See design.md for an overview of the source layout and architecture.
