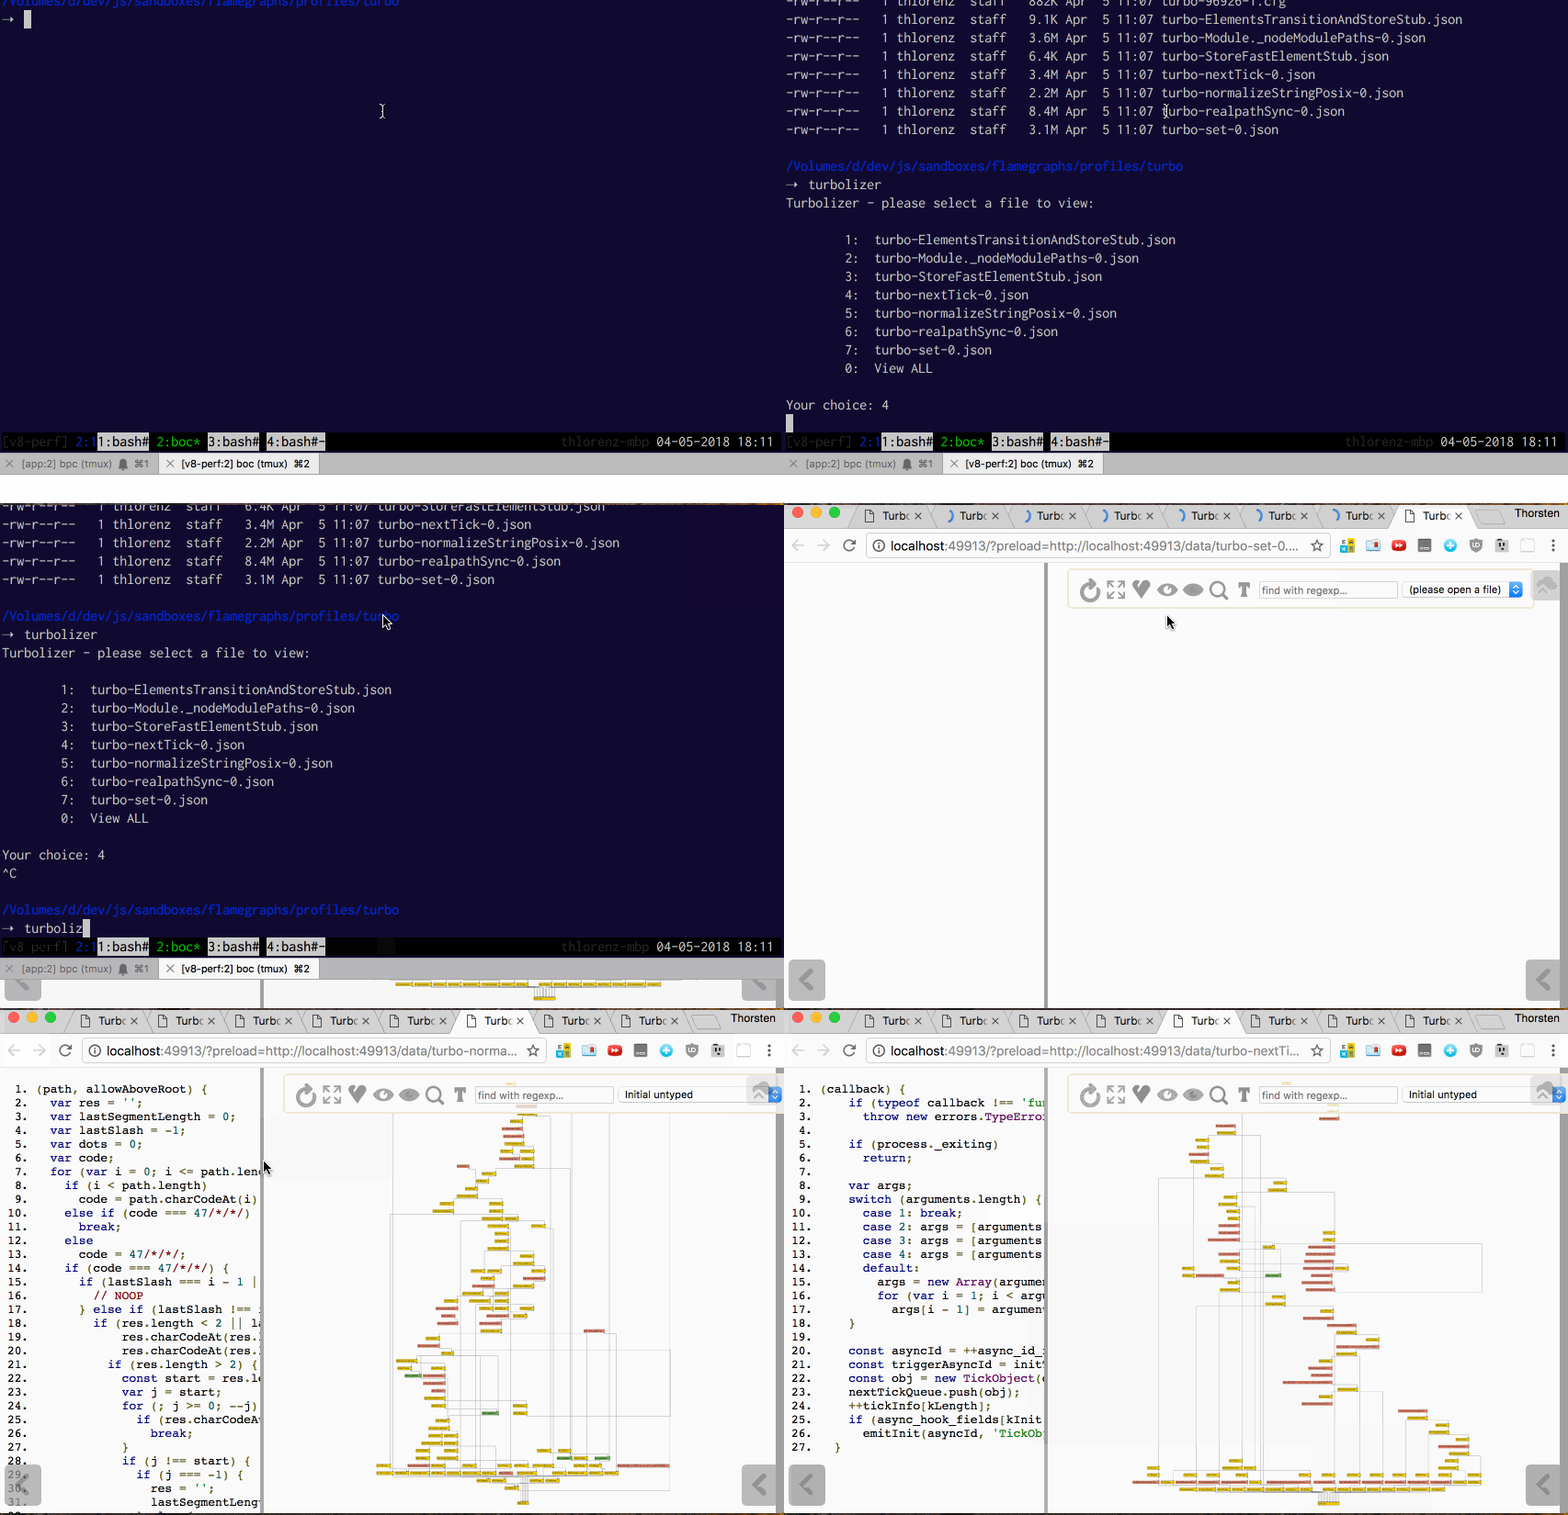
Turbolizer tool derived from the one included with v8/tools.
npm install -g turbolizer
Run your app with the --trace-turbo flag, i.e. node --trace-turbo app.js to produce turbo-*.json files.
Then just run turbolizer in the same directory and select which file (or all) you want to
load and the turbolizer application will open in the browser with it preloaded.
If you don't want to install anything, as an alternative can then either load them one by one via the hosted browser version of this repo at thlorenz.github.io/turbolizer.
Original Readme from the v8 repository
Turbolizer is a HTML-based tool that visualizes optimized code along the various phases of Turbofan's optimization pipeline, allowing easy navigation between source code, Turbofan IR graphs, scheduled IR nodes and generated assembly code.
Turbolizer consumes .json files that are generated per-function by d8 by passing the '--trace-turbo' command-line flag.
Host the turbolizer locally by starting a web server that serves the contents of the turbolizer directory, e.g.:
cd src/tools/turbolizer
python -m SimpleHTTPServer 8000
Optionally, profiling data generated by the perf tools in linux can be merged with the .json files using the turbolizer-perf.py file included. The following command is an example of using the perf script:
perf script -i perf.data.jitted -s turbolizer-perf.py turbo-main.json
The output of the above command is a json object that can be piped to a file which, when uploaded to turbolizer, will display the event counts from perf next to each instruction in the disassembly. Further detail can be found in the bottom of this document under "Using Perf with Turbo."
Using the python interface in perf script requires python-dev to be installed and perf be recompiled with python support enabled. Once recompiled, the variable PERF_EXEC_PATH must be set to the location of the recompiled perf binaries.
Graph visualization and manipulation based on Mike Bostock's sample code for an interactive tool for creating directed graphs. Original source is at https://github.com/metacademy/directed-graph-creator and released under the MIT/X license.
Icons derived from the "White Olive Collection" created by Breezi released under the Creative Commons BY license.
In order to generate perf data that matches exactly with the turbofan trace, you must use either a debug build of v8 or a release build with the flag 'disassembler=on'. This flag ensures that the '--trace-turbo' will output the necessary disassembly for linking with the perf profile.
The basic example of generating the required data is as follows:
perf record -k mono /path/to/d8 --trace-turbo --perf-prof main.js
perf inject -j -i perf.data -o perf.data.jitted
perf script -i perf.data.jitted -s turbolizer-perf.py turbo-main.json
These commands combined will run and profile d8, merge the output into a single 'perf.data.jitted' file, then take the event data from that and link them to the disassembly in the 'turbo-main.json'. Note that, as above, the output of the script command must be piped to a file for uploading to turbolizer.
There are many options that can be added to the first command, for example '-e' can be used to specify the counting of specific events (default: cycles), as well as '--cpu' to specify which CPU to sample.
