This group project is a part of AI Bootcamp at </becode>
A learning challenge, Wiwinio Project targetted to acquire and consolidate knowledge in the following subjects:
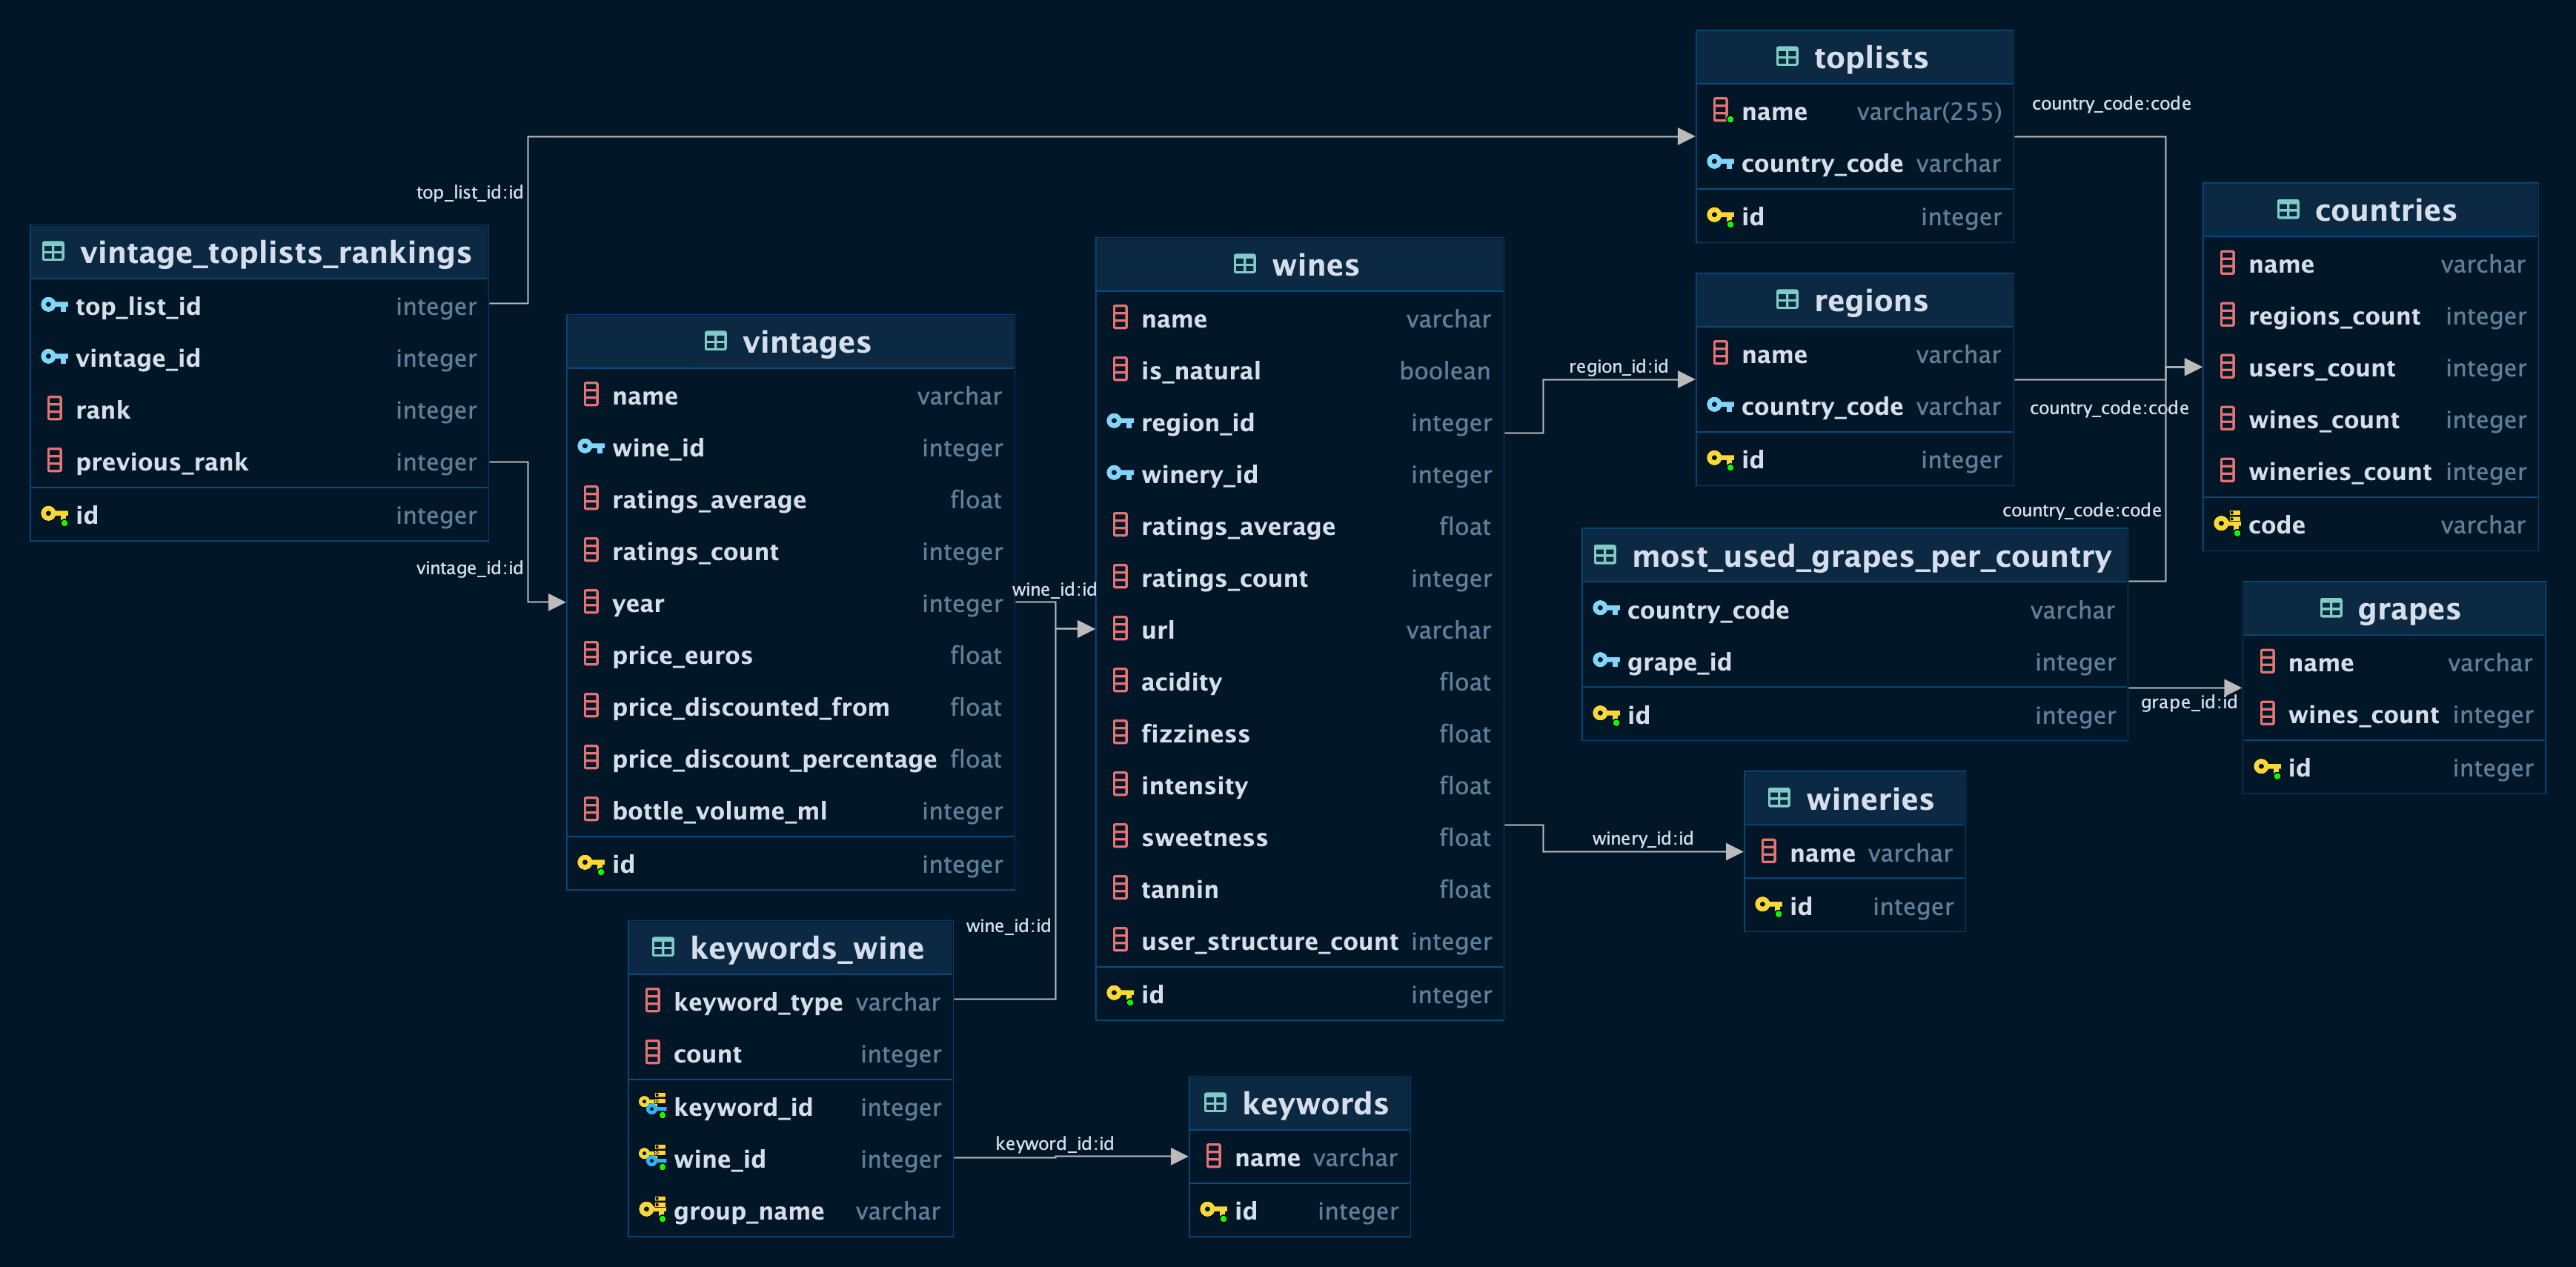
A sample database (SQLite), reflecting the assortiment, ratings, and sales information for the Belgian market, from the wine selling website (Vivino) was provided.
The team had to answer several questions, like...
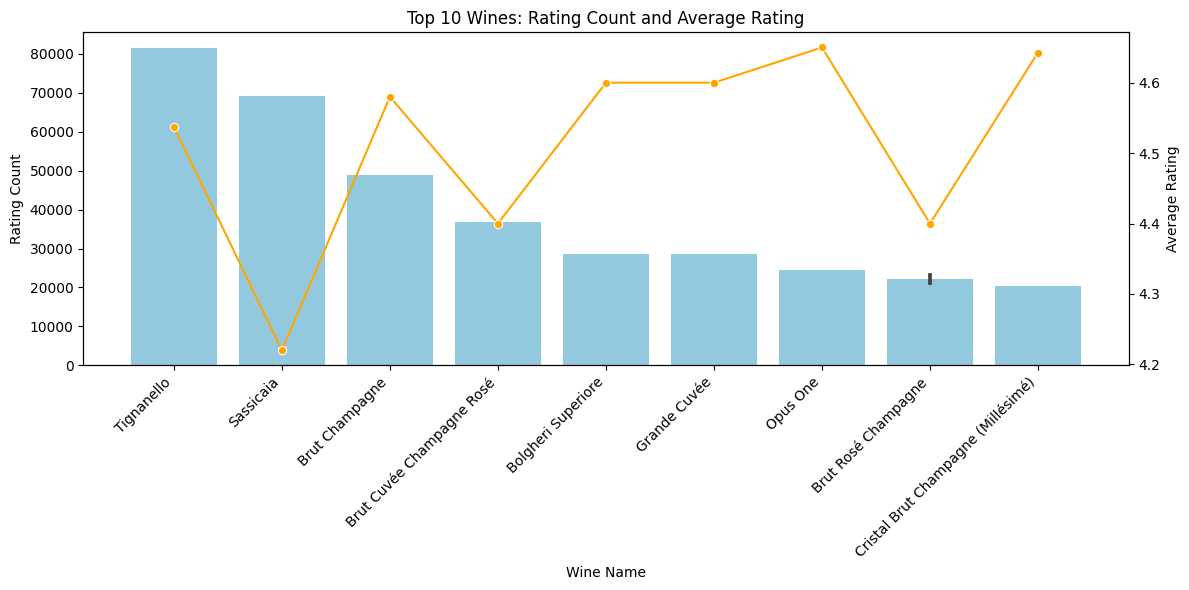
- Highlight 10 wines to increase the sales. Which ones should be choosen and why?
- With the marketing budget for this year, which country should be prioritzed and why?
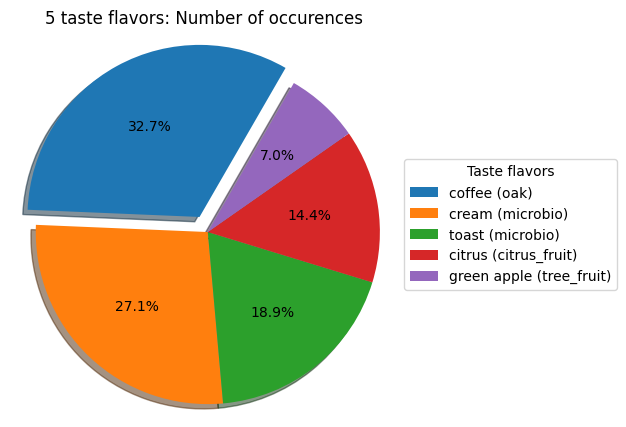
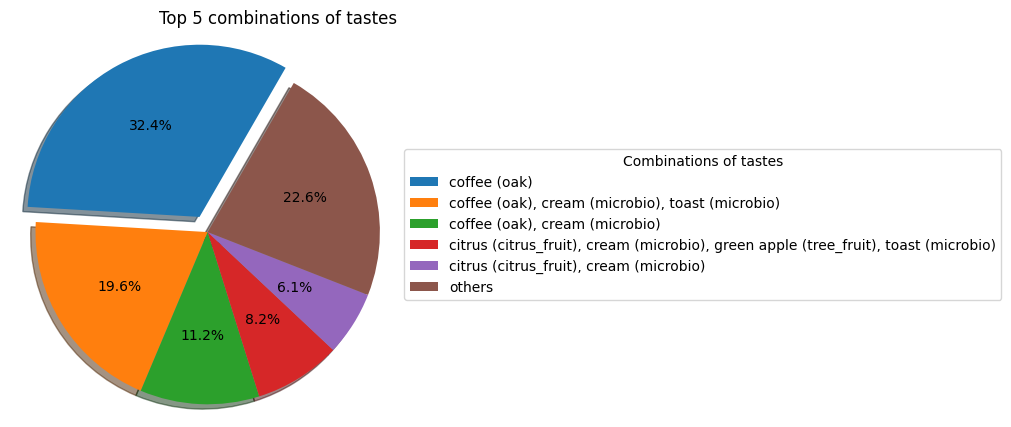
- Analyse the special tastes and their combinations.
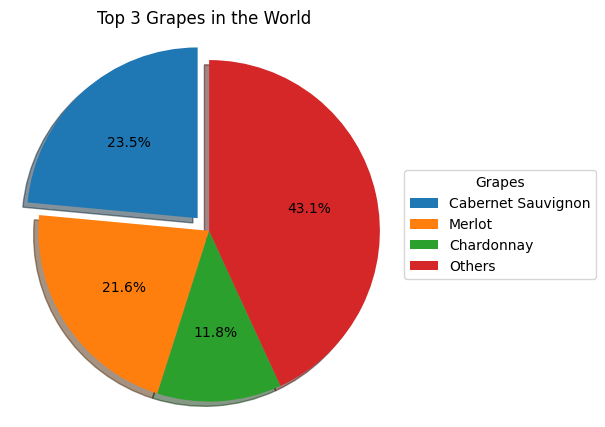
- Select top 5 wines produced from the most popular grapes.
- Create a country leaderboard based on the wines ratings and popularity.
The analysis is done and saved in Jypiter Notebooks.
Here are some plots to illustrate some findings:
The results are delivered as a Streamlit-based web app.
Please see Usage instructions below.
The Wiwinio Project is available from the GitHub repository. PLease, follow the following instructions to clone and browse the project files.
-
Clone the project repository to your local machine
-
Navigate to clone's root folder
-
Create and activate project's virtual environment
- Run:
python -m venv _project_env - Run:
source _project_env/Scripts/activate
- Run:
-
Install the required libraries:
You can click on the badge links to learn more about each library and its specific version used in this project. You can install them manually using
pip install <library name>or just runningpip install -r requirements.txt.
- To use Streamlit-based presentation do as follows:
- Run
cd srcto move to src folder - Run
streamlit run 1_??_Home.pyto open the web app - Explore the analysis
- Run
The project folder is organized as follows:
.
└── Repository Name/
    ├── data/
    │   └── < data files (e.g. db, csv, pickles, etc.) >
    ├── src/
    │   └── pages/
    │   │   └── < streamlit pages >
    │   └── 1_🌐_Home.py
    ├── notebooks/
    │   └── < notebooks for data exploration >
    ├── output/
    │   └── < any artifacts of analysis (graphs, model objects, etc.) >
    ├── .gitattributes
    ├── .gitignore
    ├── requirements.txt
    ├── main.py
    └── README.md
Fatemeh Loni (Team Lead & Data Analyst) LinkedIn | GitHub
Daniel Bauwens (Data Engineer) LinkedIn | GitHub
Vitaly Shalem (Data Analyst) LinkedIn | GitHub
BeCode.org (Ghent, Belgium)
August 2023
