Quorum Profiling is a toolset built for the purpose of running stress tests on networks running on Quorum and measure/monitor the TPS and other benchmarking parameters at network level. The tests are fired using Jmeter. The tools can be used in different scenarios as described below:
-
Scenario 1 - Spin up a Quorum network in AWS and execute stress test: In this scenario, the tool can be used to spin up a quorum network in AWS and run some tests using
Jmetertests and measure/monitor TPS, CPU & Memory usage metrics. A dashboard is also available to monitor the progress ofJmetertests. Refer testing Quorum in AWS for more details on how to use it. -
Scenario 2 - Executing stress test on an existing Quorum network with Jmeter test profile: In case there is an existing Quorum network already running and the sole purpose is to execute certain stress test scenarios, the
Jmetertest profiles available within the tool can be executed as required. Refer testing Quorum with JMeter Test Profiles for more details on how to use it. -
Scenario 3 - Measuring TPS in an existing Quorum network: The toolset include a TPS monitoring tool which can be used to measure/monitor the TPS of an existing Quorum network Refer measuring TPS in Quorum for more details on how to use it.
-
Scenario 4 - Using the tool for local testing: The tool can be used for development purpose as well to execute tests on local Quorum network. Refer running locally for more details on how to use it.
The prerequisites for each of the above scenario is as listed below:
- Scenario 1:
- Terraform runtime - Can be downloaded from HashiCorp website. For MacOS use
brew install terraform- terraform-provider-quorum plugin
terraform-provider-quorum_v0.1.0: You can build it from here and place understresstest-aws/.terraform/plugins/darwin_amd64
- Scenario 2:
Jmeter:Jmeterinstalled on the machine from where the test scripts are being executed. If you using MacOS usebrew install jmeter. For other OS, please refer here for further detailsinfluxDB: By default we push the metrics to influxDB. Refer here for further details oninfluxDBinstallation and here for instructions to run without metrics push toinfluxDB.- A running Quorum network on which the tests to be executed
- Scenario 3:
- requires Go (version 1.13 or later). For MacOs use
brew install go- A running Quorum network for monitoring the TPS
- Scenario 4:
docker: for installingdocker, refer here- For running the tests the tool expects
host_acct.csvandnetwork.propertiesfiles to be present inquorum-profiling/scriptsdirectory. Samplehost_acct.csvcan be found here. Samplenetwork.propertiescan be found here Modify the sample files as necessary and copy these files toquorum-profiling/scriptsbefore starting the test.- A running Quorum network for monitoring
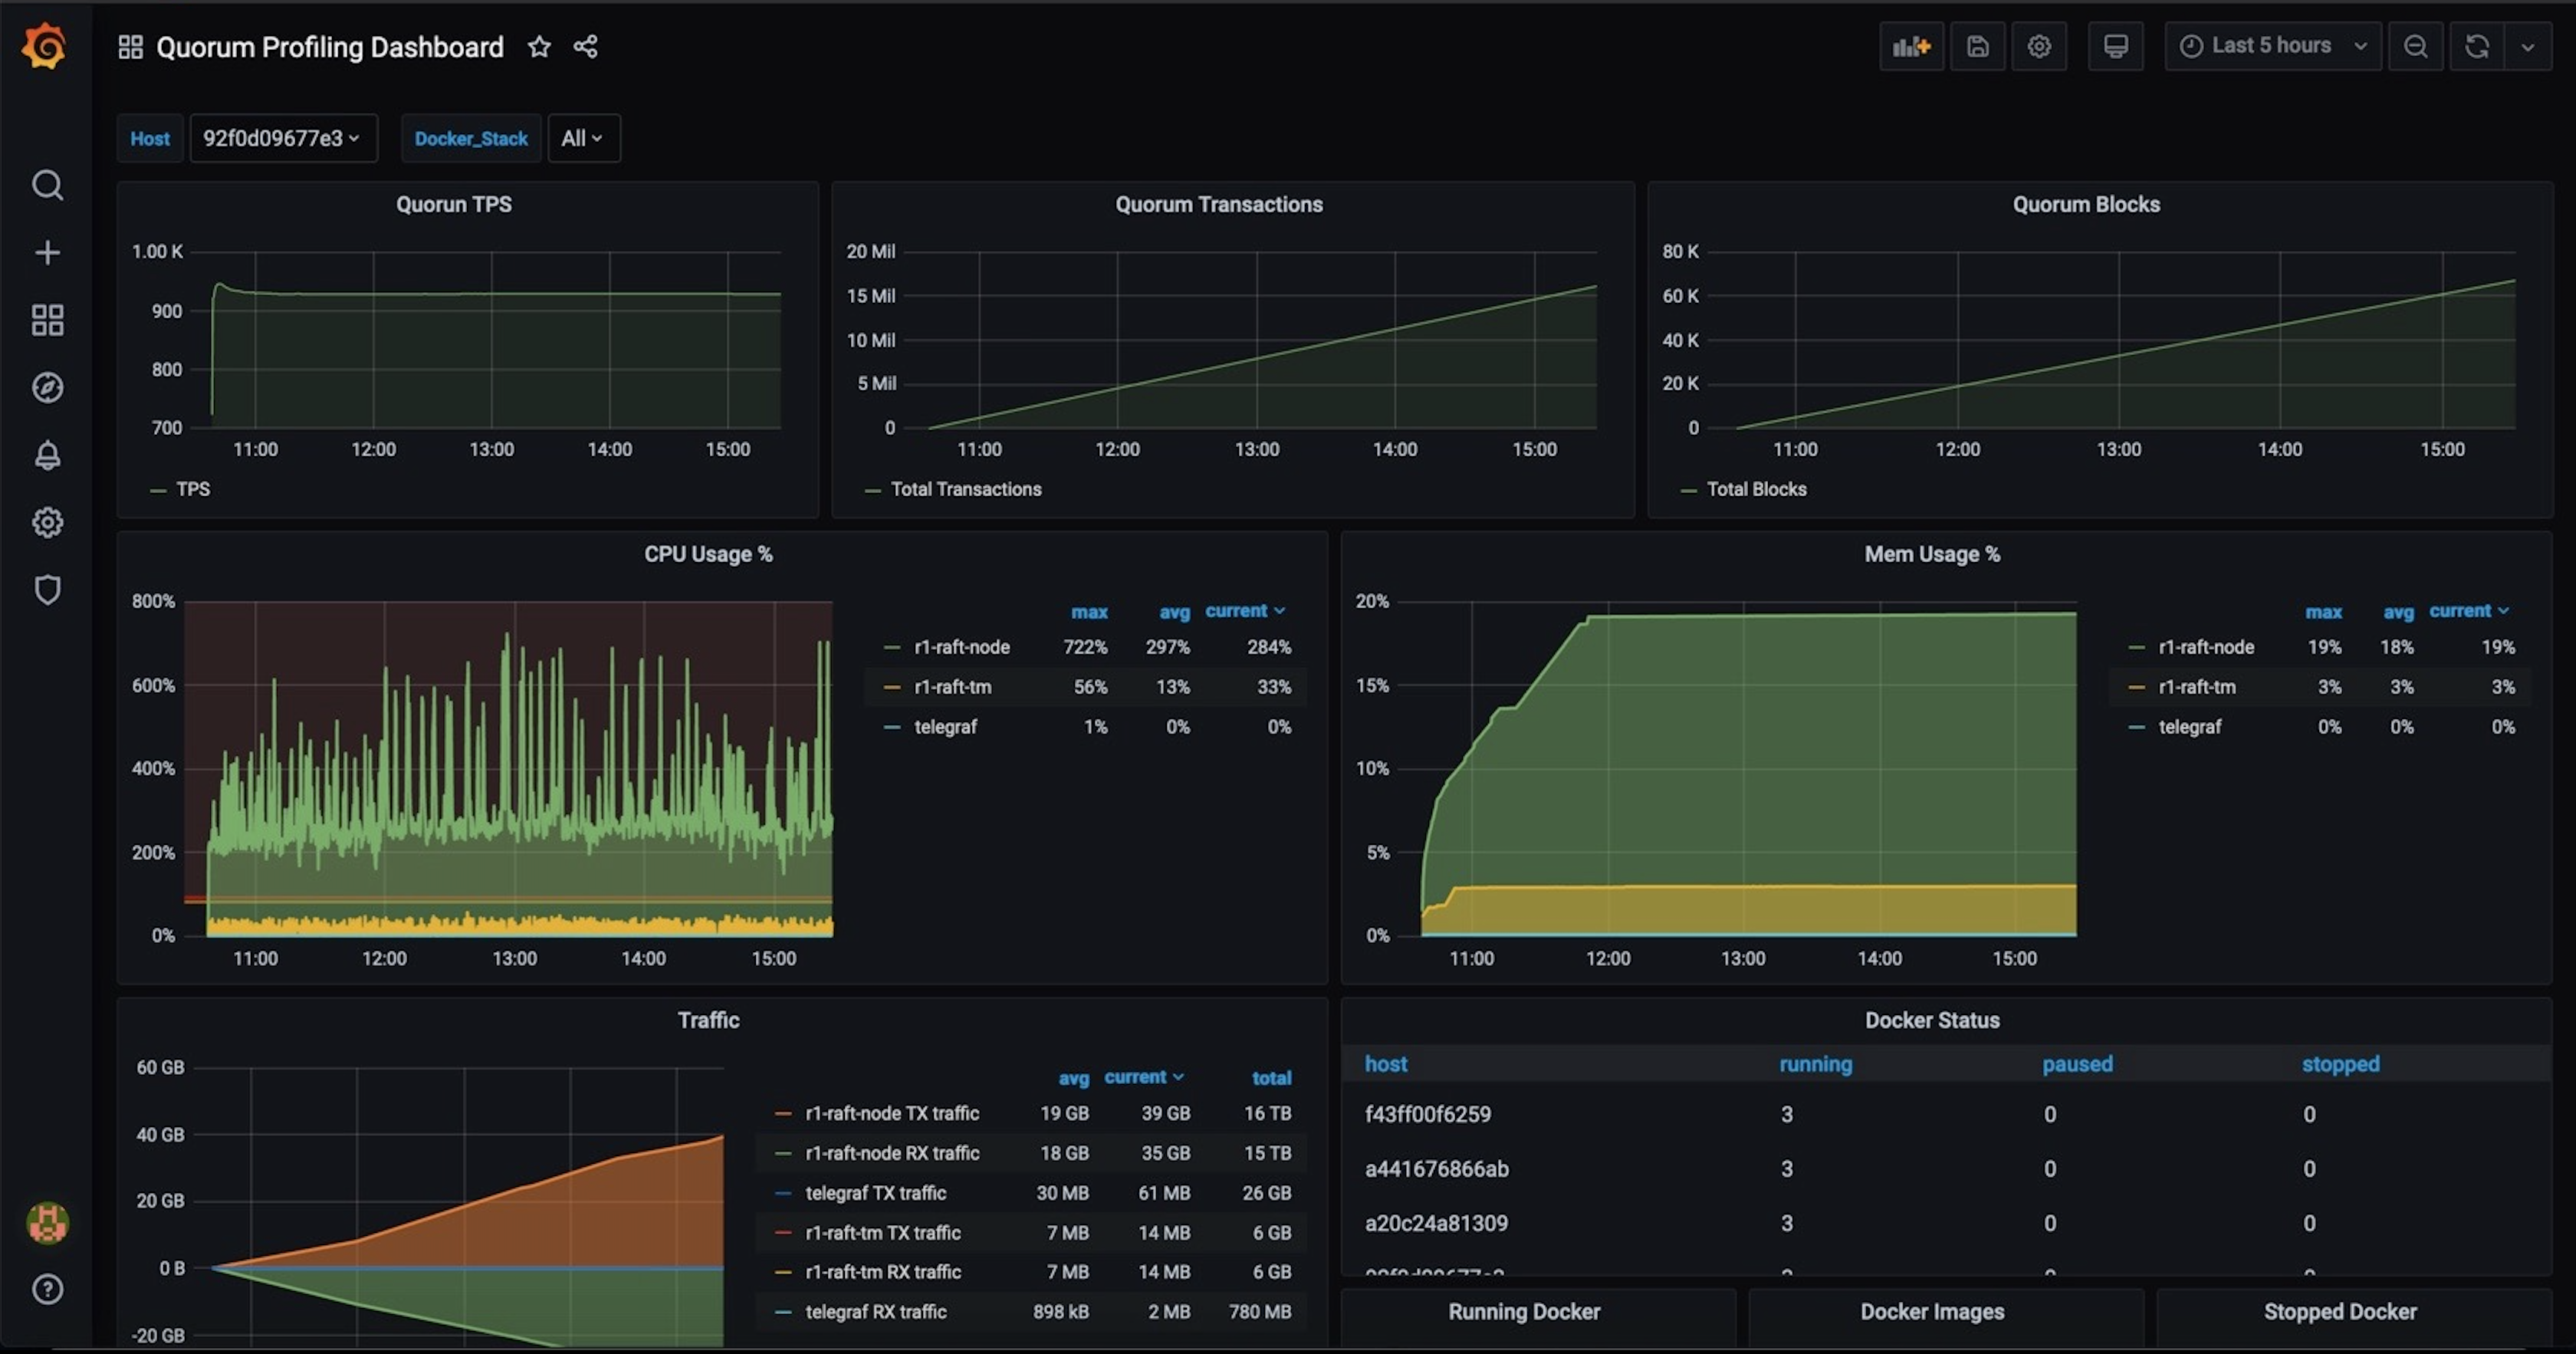
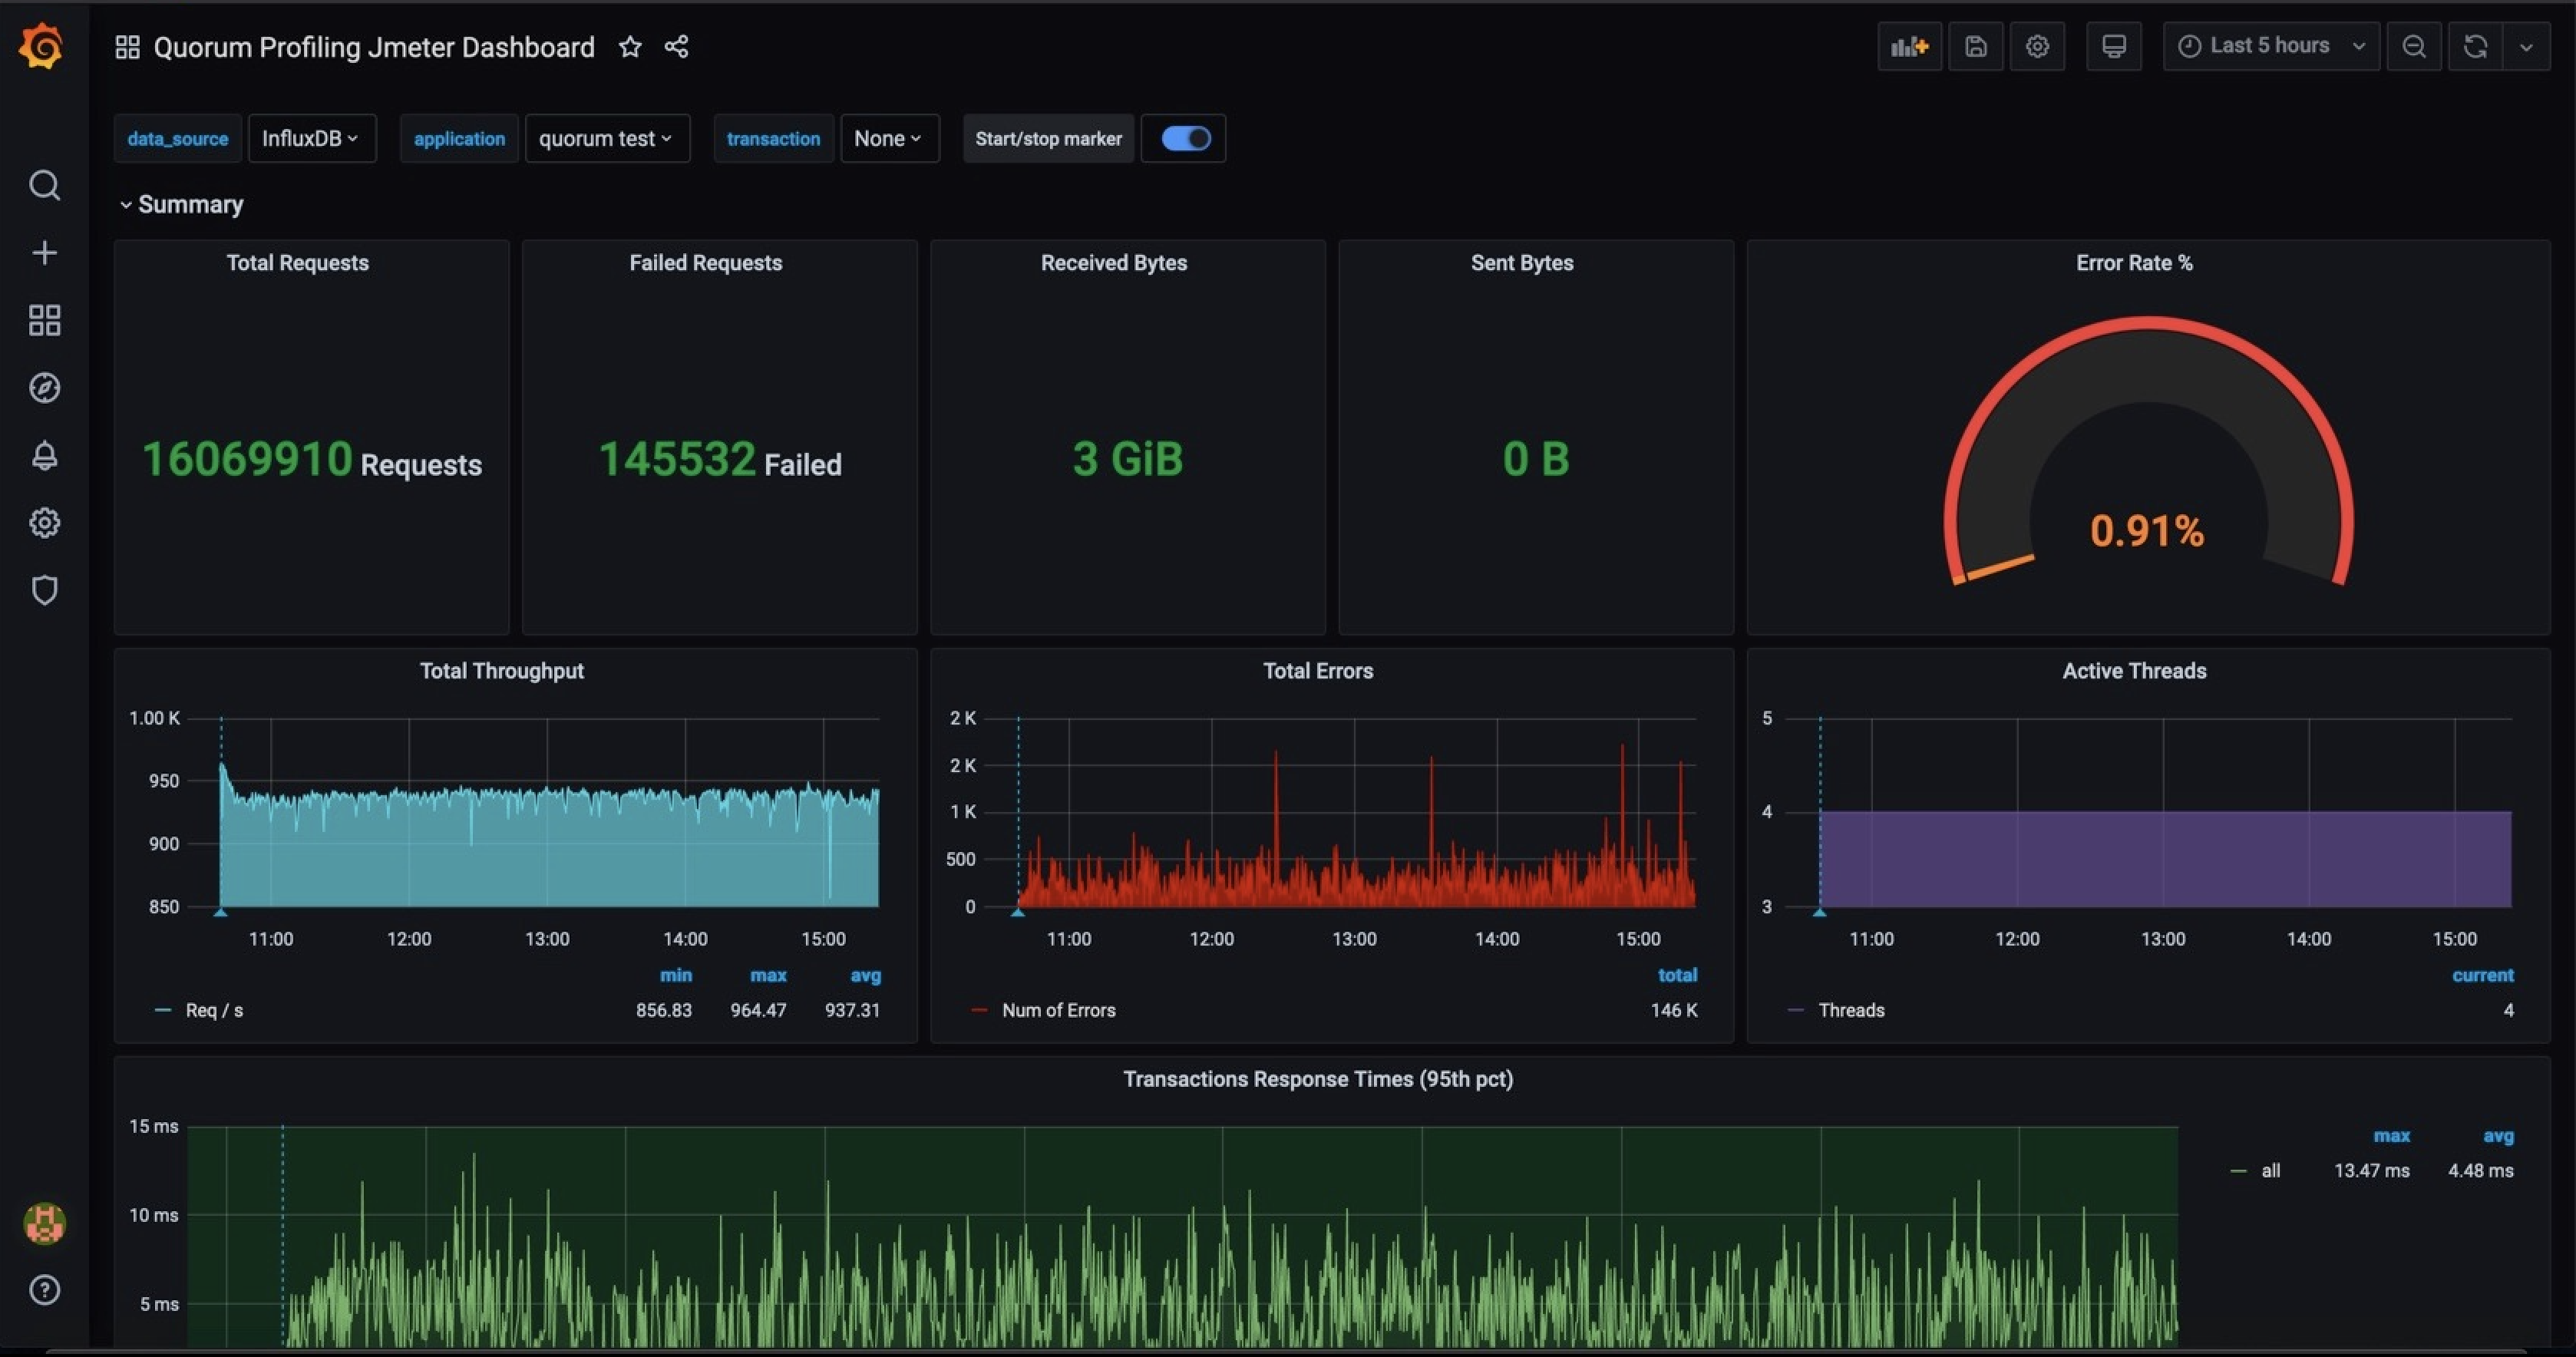
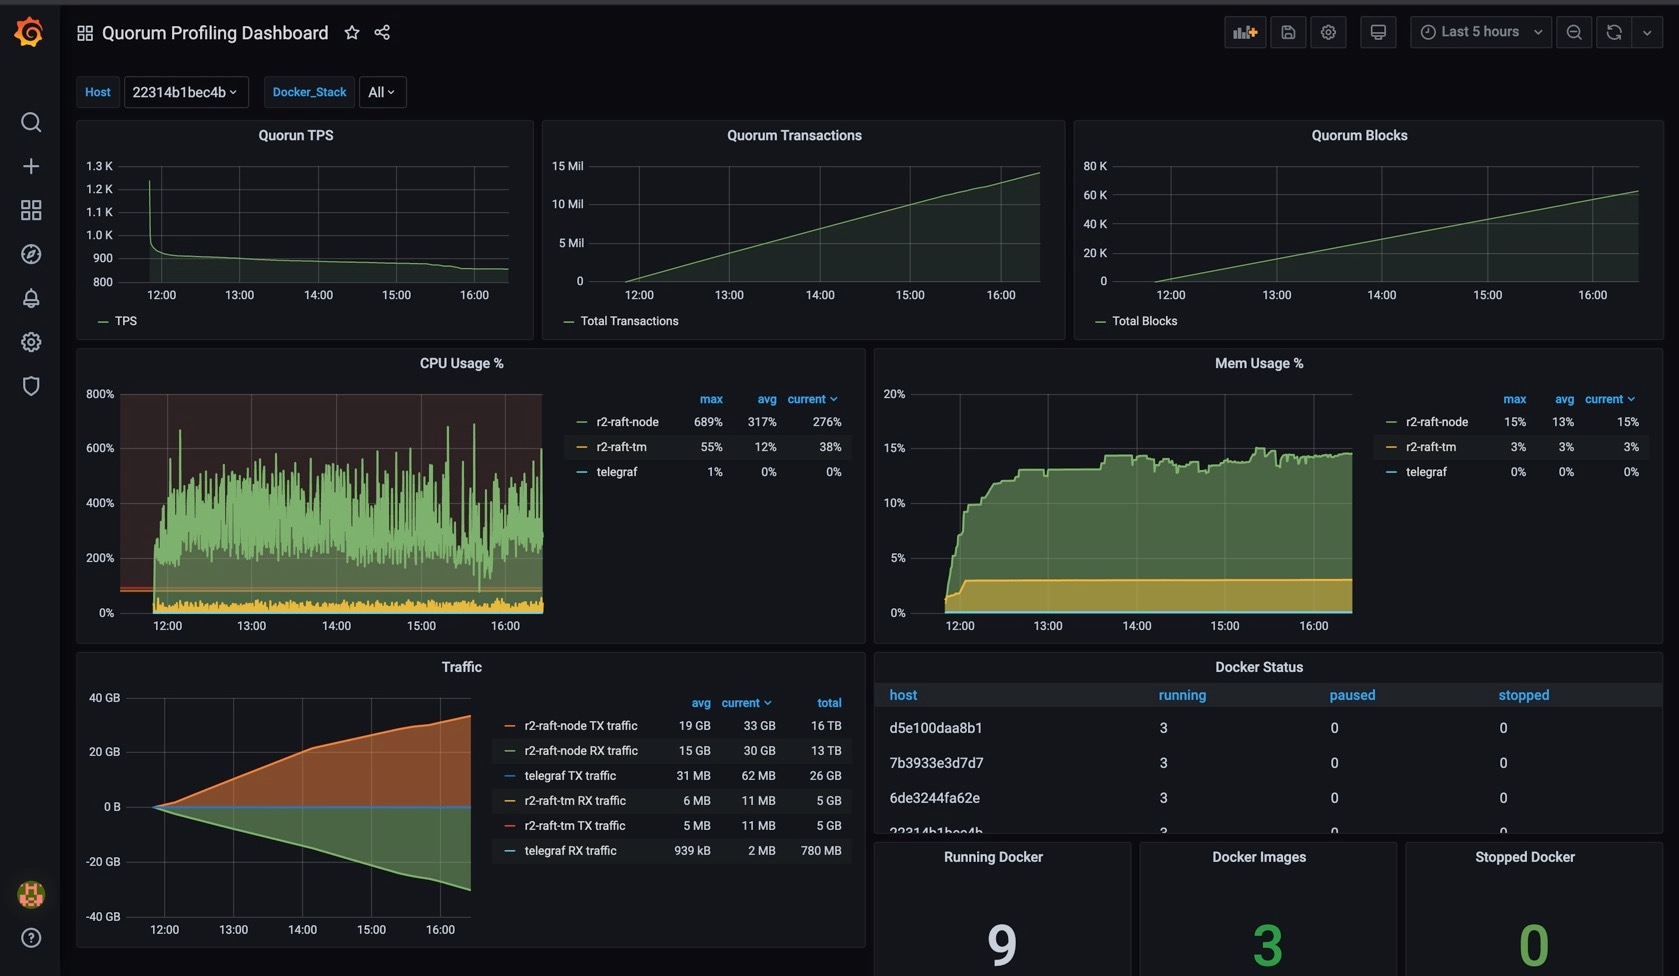
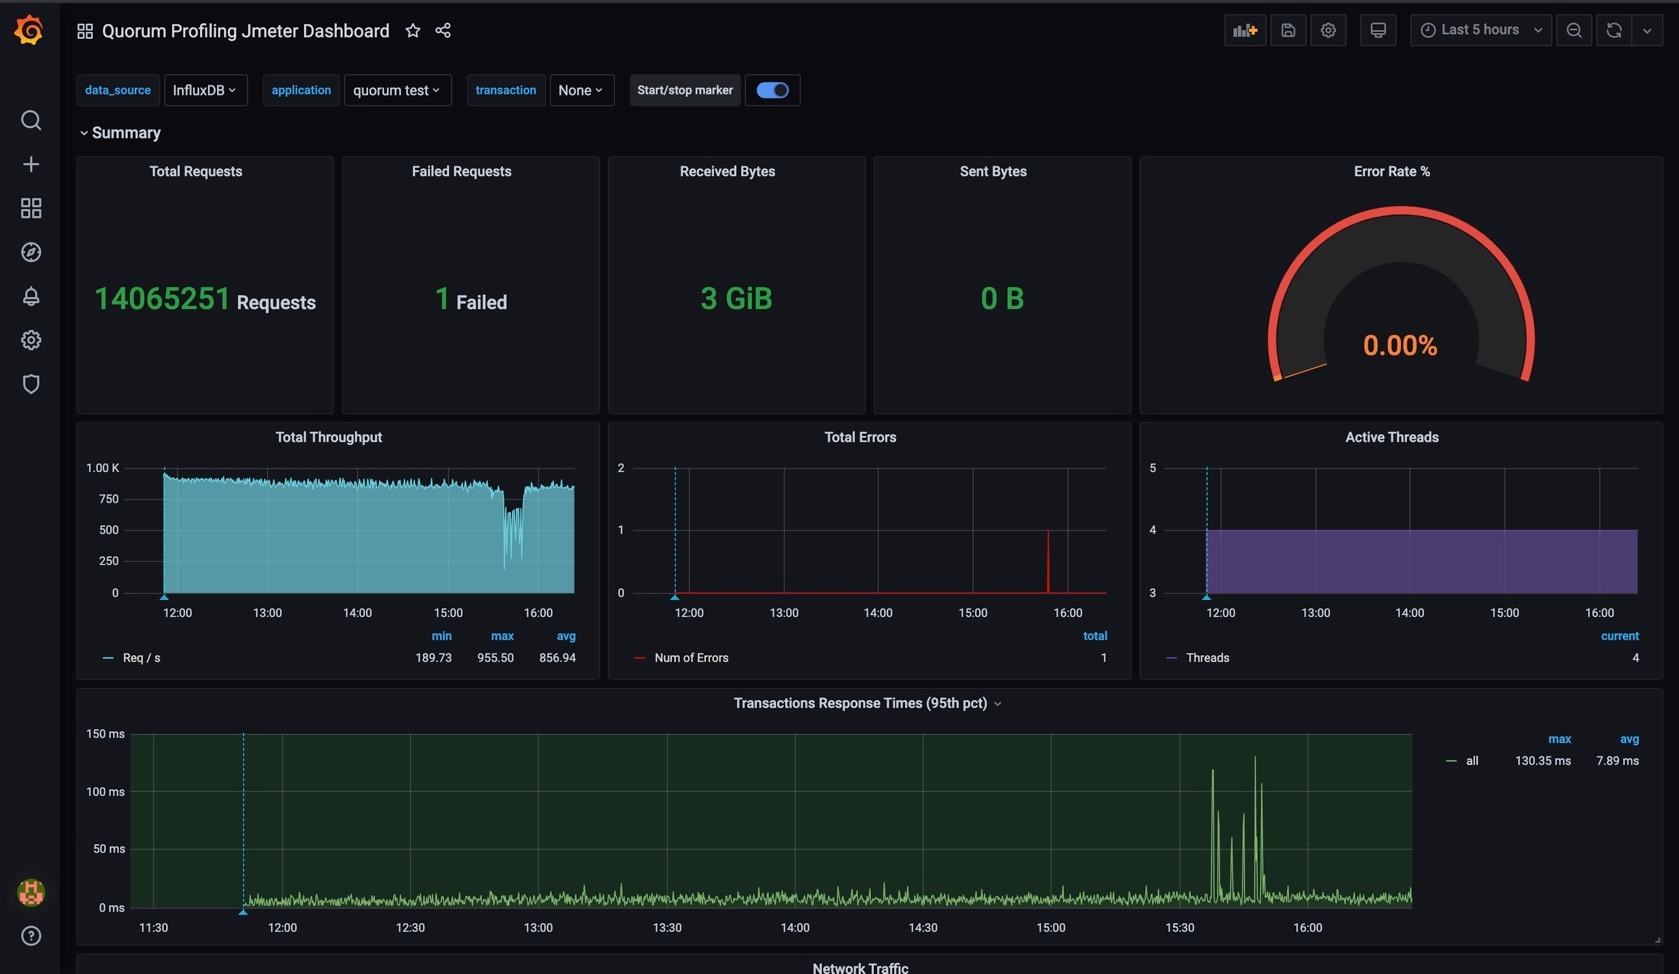
The tool executes the stress test profile selected and then collects the following metrics:
- CPU/memory usage metrics of
geth&tesseradocker containers from all the nodes in the network (usingtelegraf) - TPS, total transactions count and total block count metrics from all nodes in the network
Jmetertest execution metrics
The above metrics are pushed to influxdb. The tool also supports pull of the metrics data from a prometheus end point. The metrics can be viewed in grafana dashboards. Sample dashboards are as shown below:


