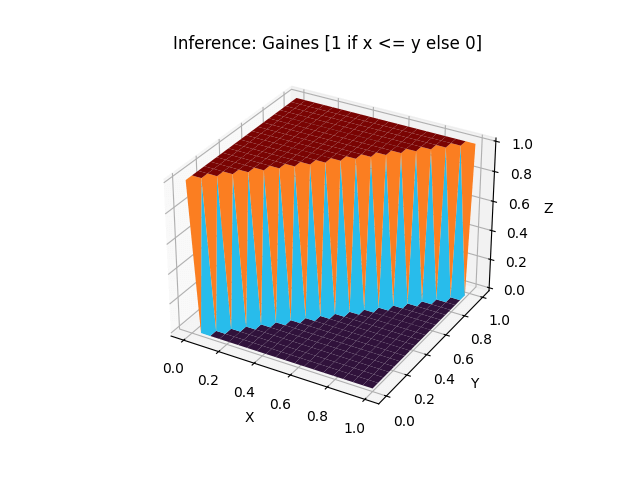
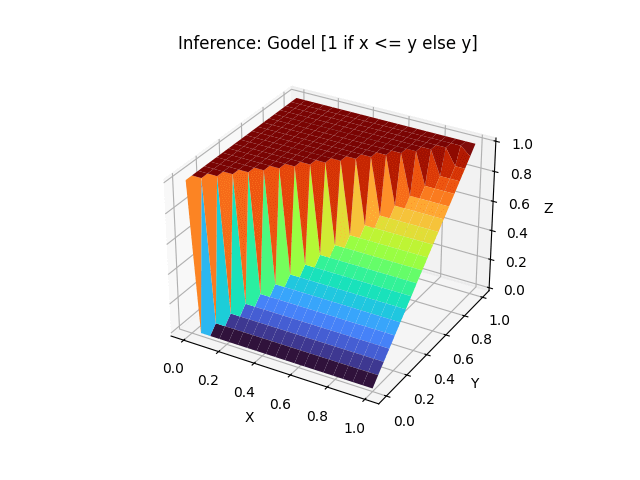
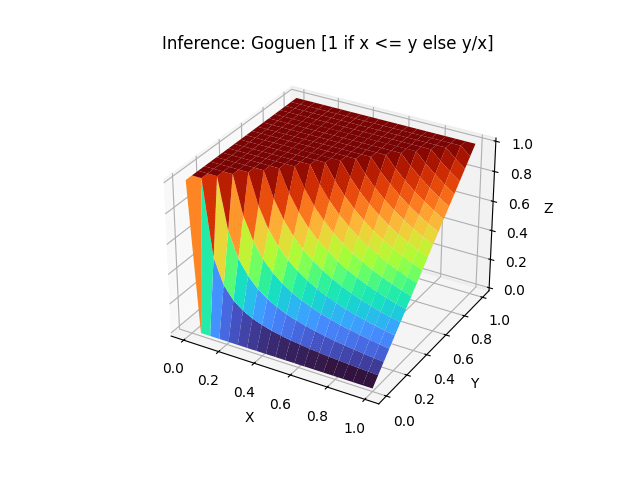
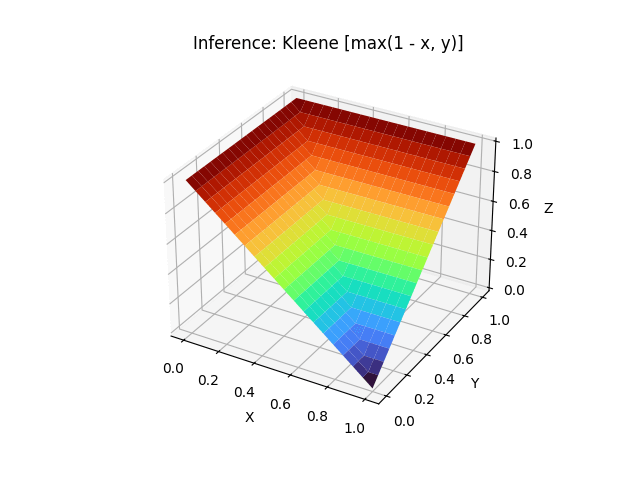
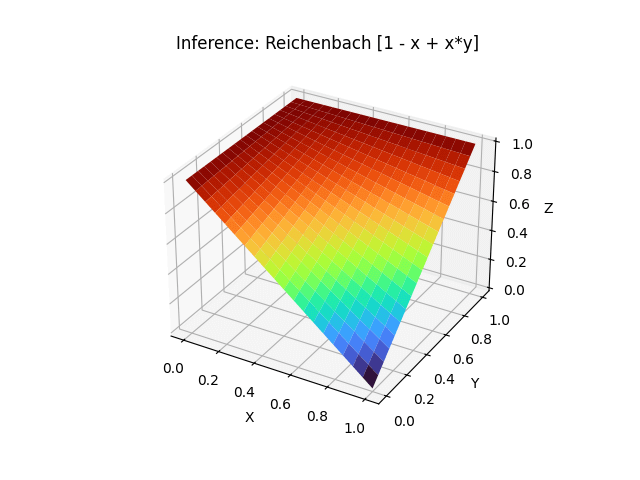
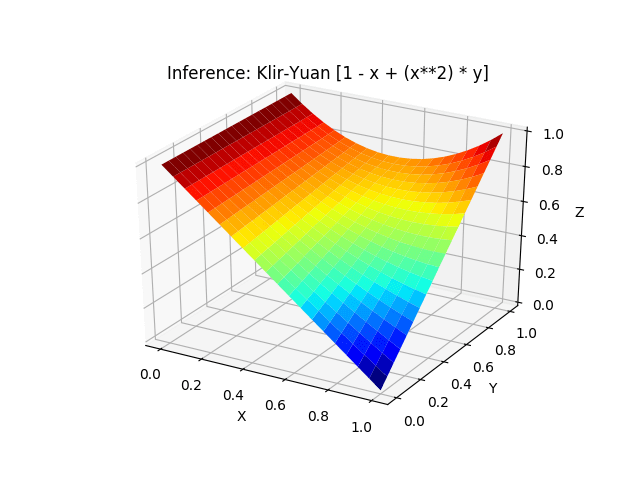
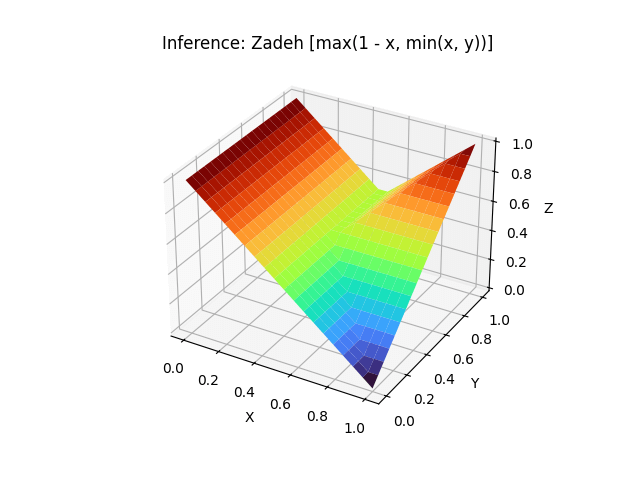
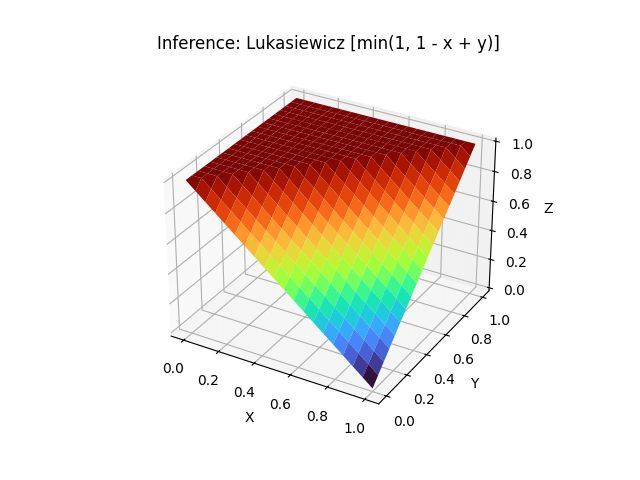
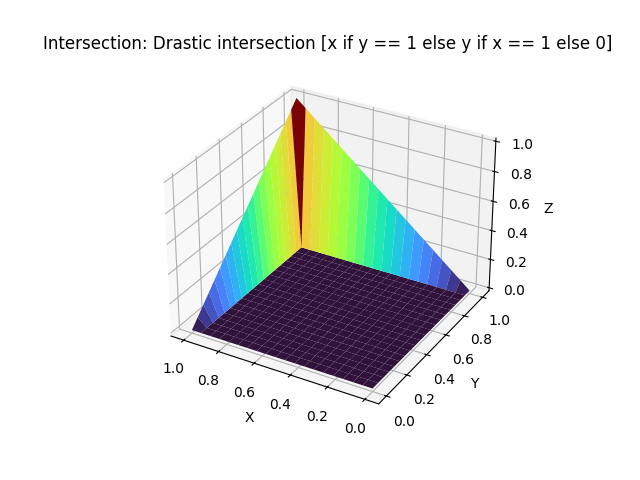
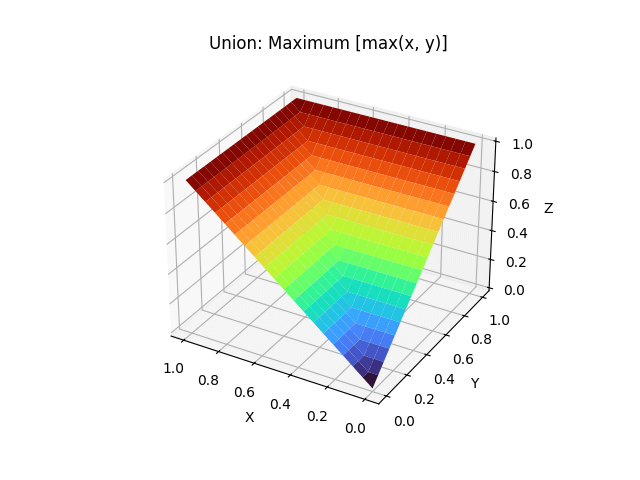
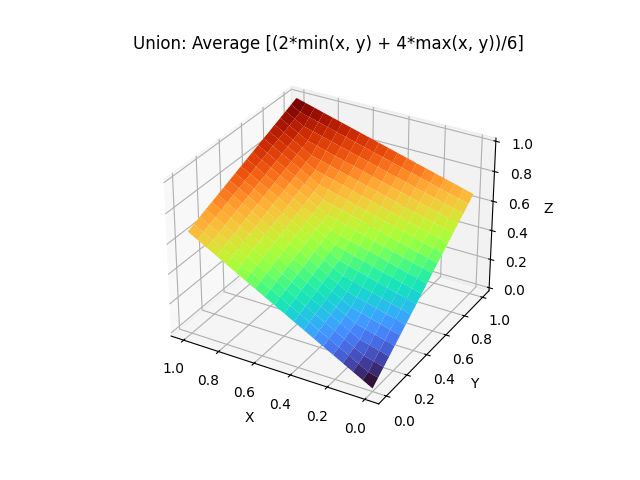
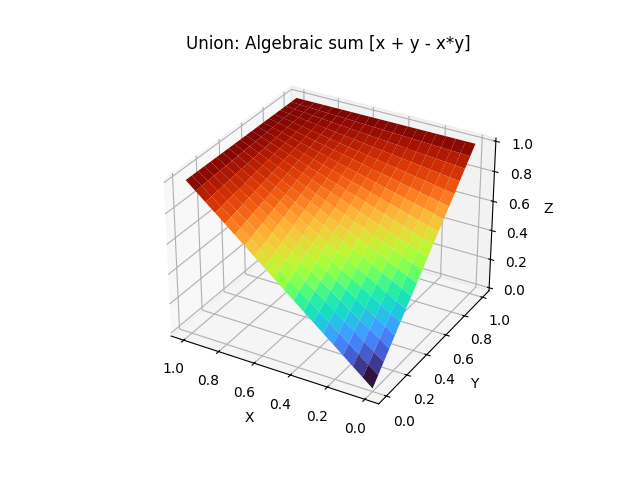
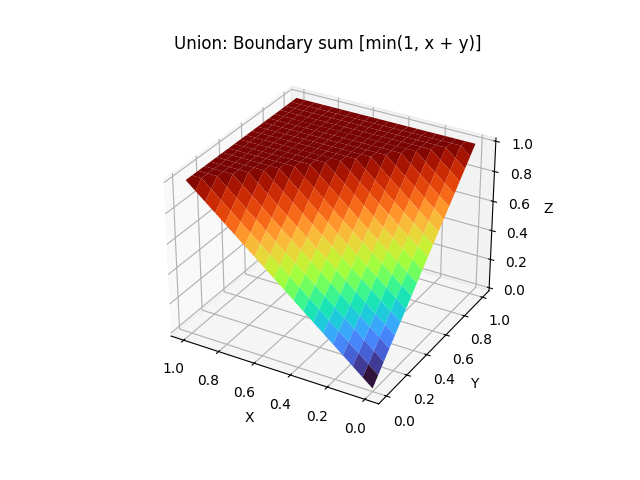
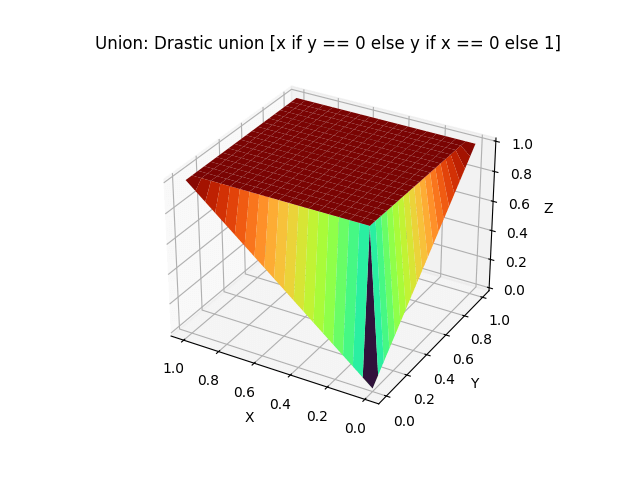
To run it you'll need matplotlib. You can setup a virtual environment inside the project folder with
virtualenv -p python3 venv
source venv/bin/activate
pip install -r requirements.txt
The two values that can be easily adjusted in the code are TILES and COLOR_MAP.
- Increasing or decreasing the value of
TILESmakes the figure more or less fine-grained. - Possible values to assign to
COLOR_MAPcan be found in this colormap reference.
| x | y | x AND y | x OR y | IF x THEN y |
|---|---|---|---|---|
| 0 | 0 | 0 | 0 | 1 |
| 0 | 1 | 0 | 1 | 1 |
| 1 | 0 | 0 | 1 | 0 |
| 1 | 1 | 1 | 1 | 1 |
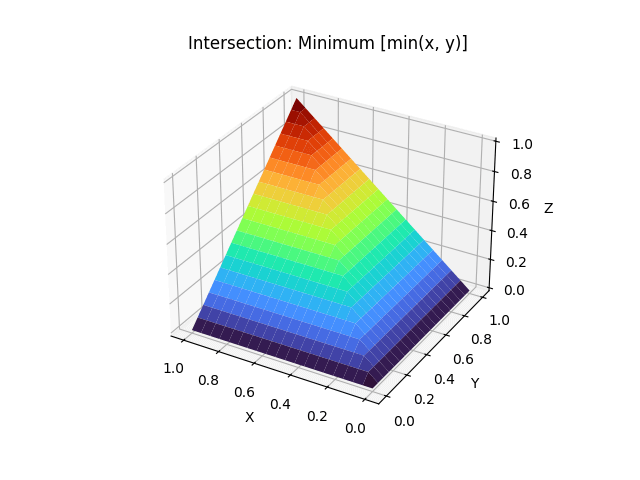
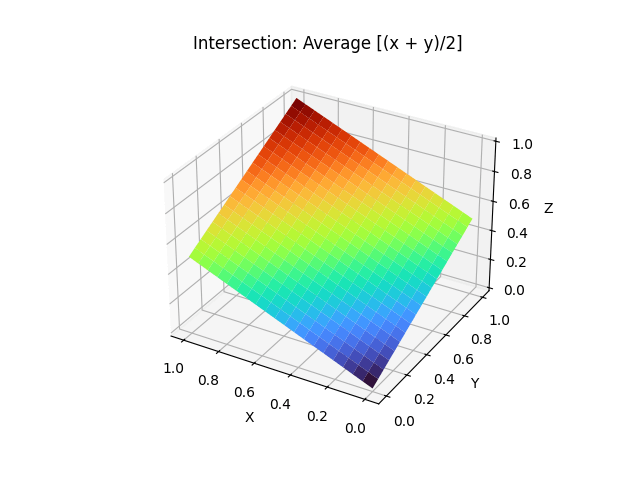
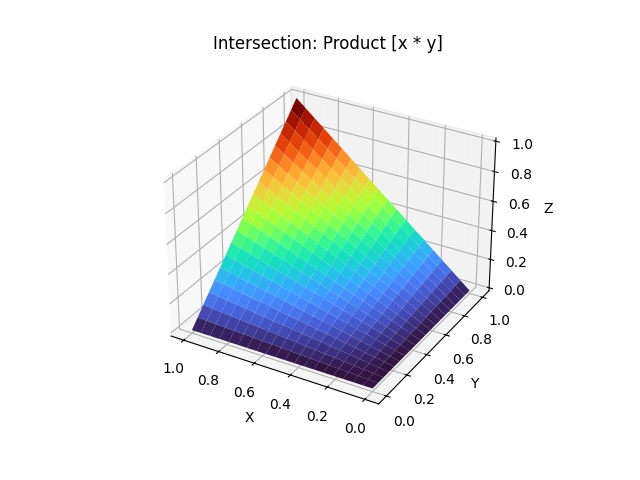
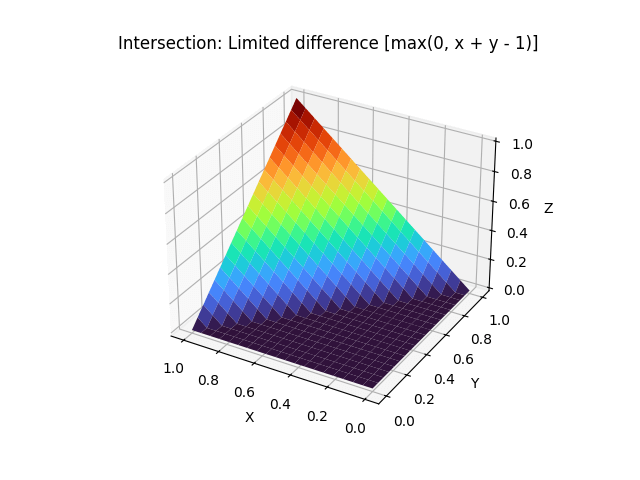
Note that the range values for x are inverted compared to Intersection and Union
to make it easier to see the surface.
