This project is a simple tool to extract and plot data outputed in the log of CharlesX.
To install the tool you need to install the python package in your current python environment by running the command:
pip install git+https://github.com/qdouasbin/charlesxlogminmax.git
To uninstall the tool run the command:
pip uninstall charlesxlogminmax
Once the module is installed you can create small scripts to install the data.
If you want to extract data from charlesx log as a .csv file you can use the following script:
import charlesxlogminmax.extract_data as ext_dat

log_file = 'path-to-my-charlesx-log.out'
out_file = 'my-charlesx-data.csv'
ext_dat.extract_log_data(log_file, out_file)If you want to plot the data you can do it from the .csv file that you have created:
import charlesxlogminmax.plot_min_max as plt_minmax

plt_minmax.plot_log_data(out_file)
Alternatively, you can directly give the CharlesX log as an input:
import charlesxlogminmax.plot_min_max as plt_minmax

plt_minmax.plot_log_data(log_file)
The plotting feature also has a few options. todo --> describe options here.
Here are the different options available:
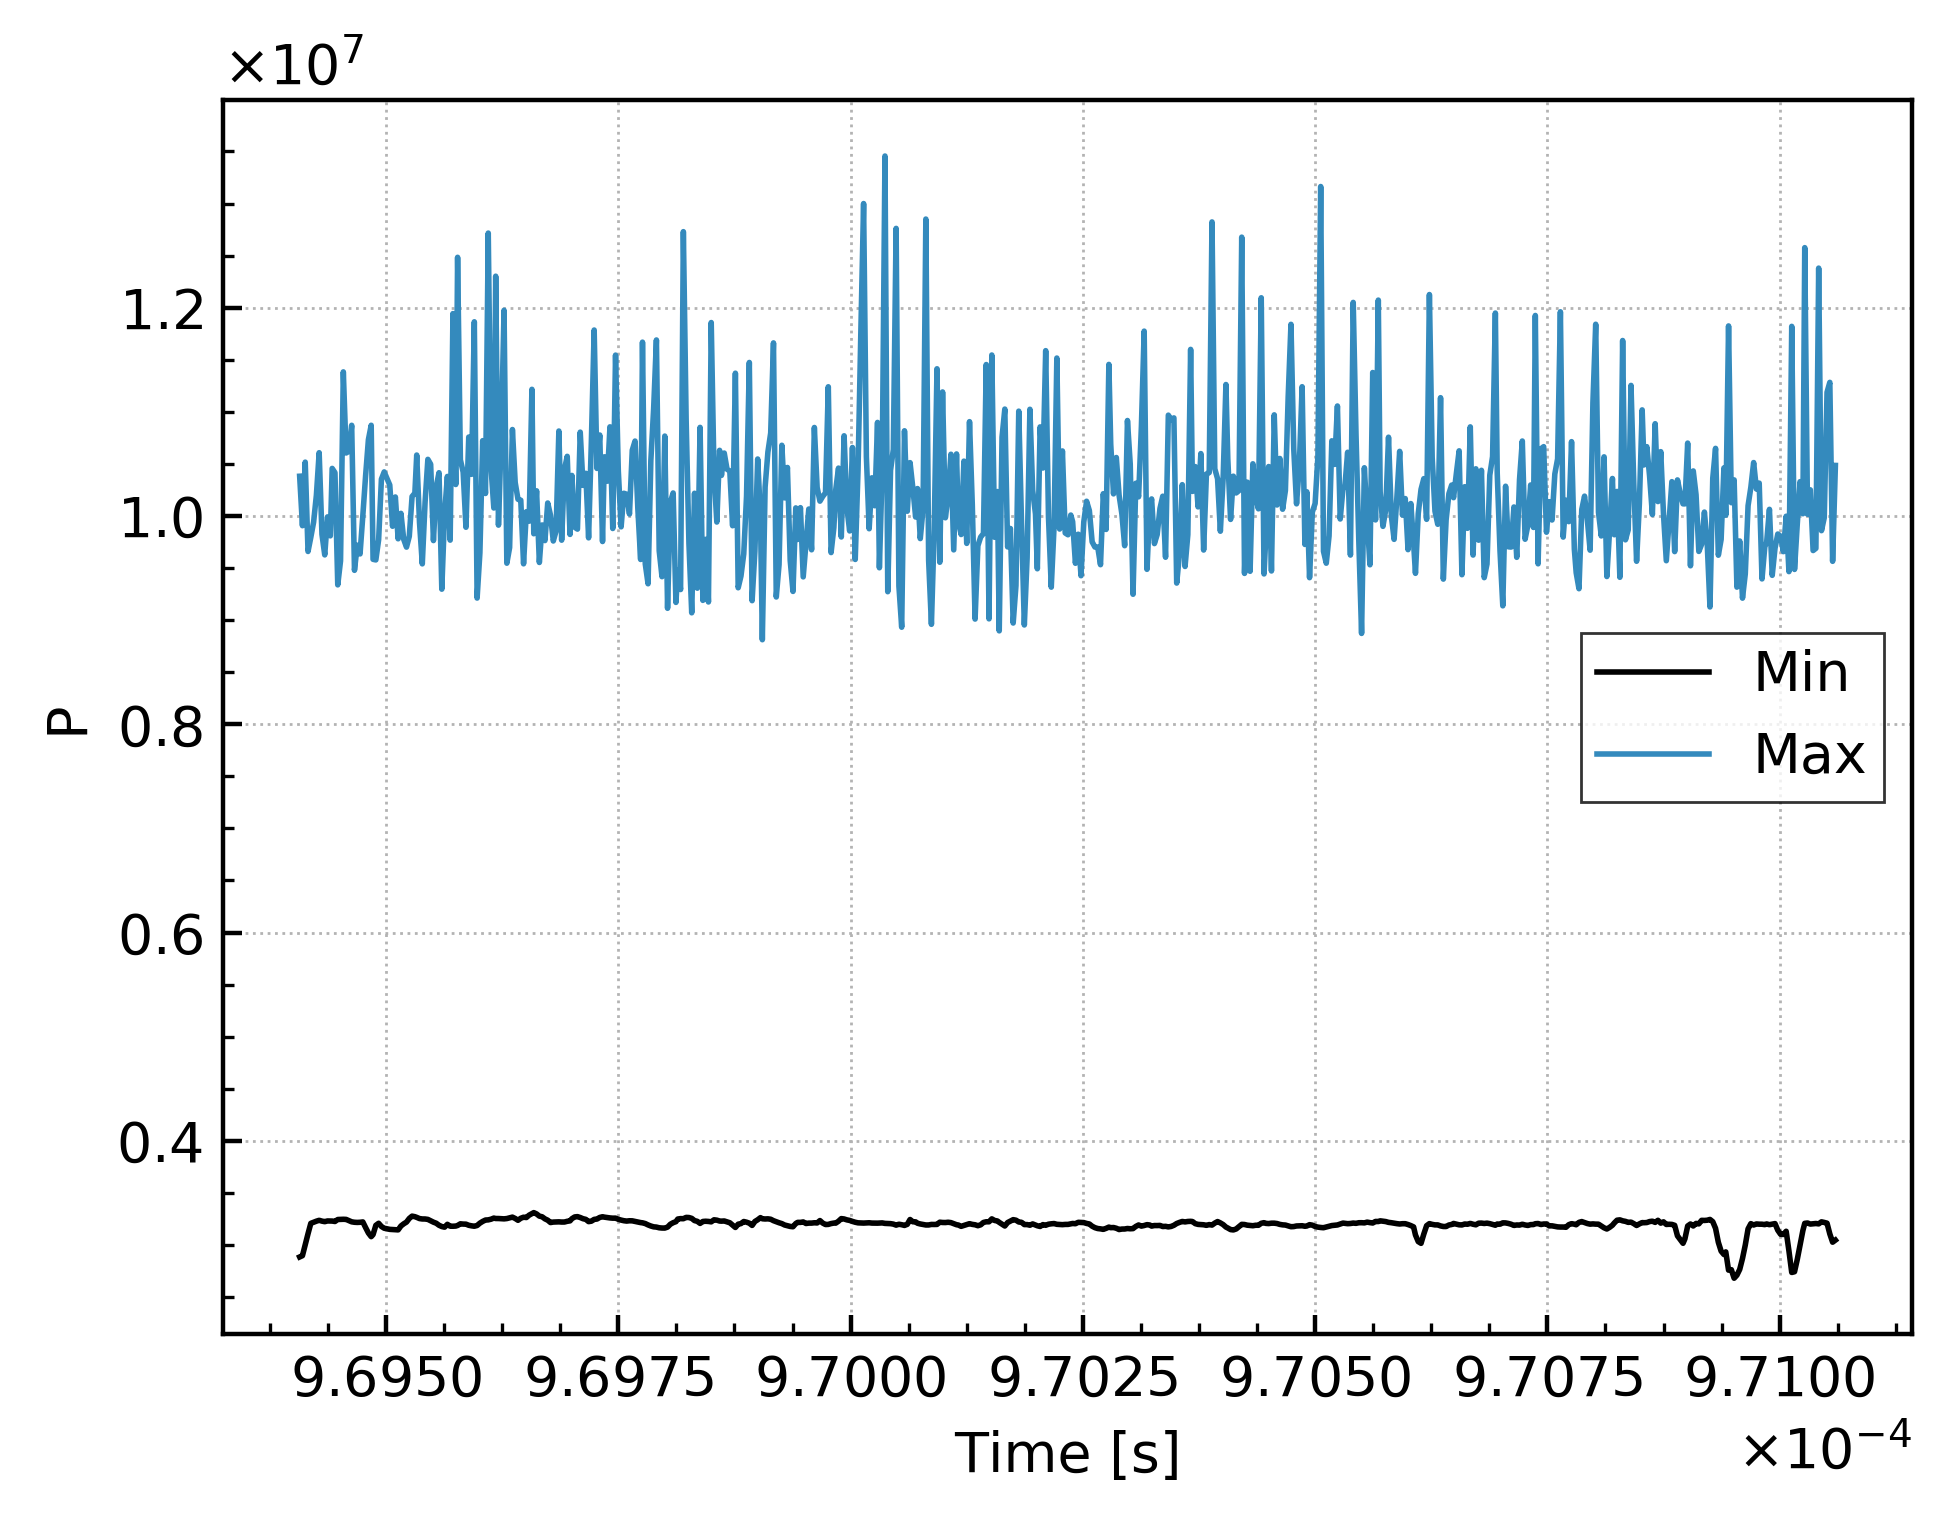
- The only mandatory argument is the
.csvor log file. If only this argument is given, the generted plots will be as the follwing: - for the range values (min and max):
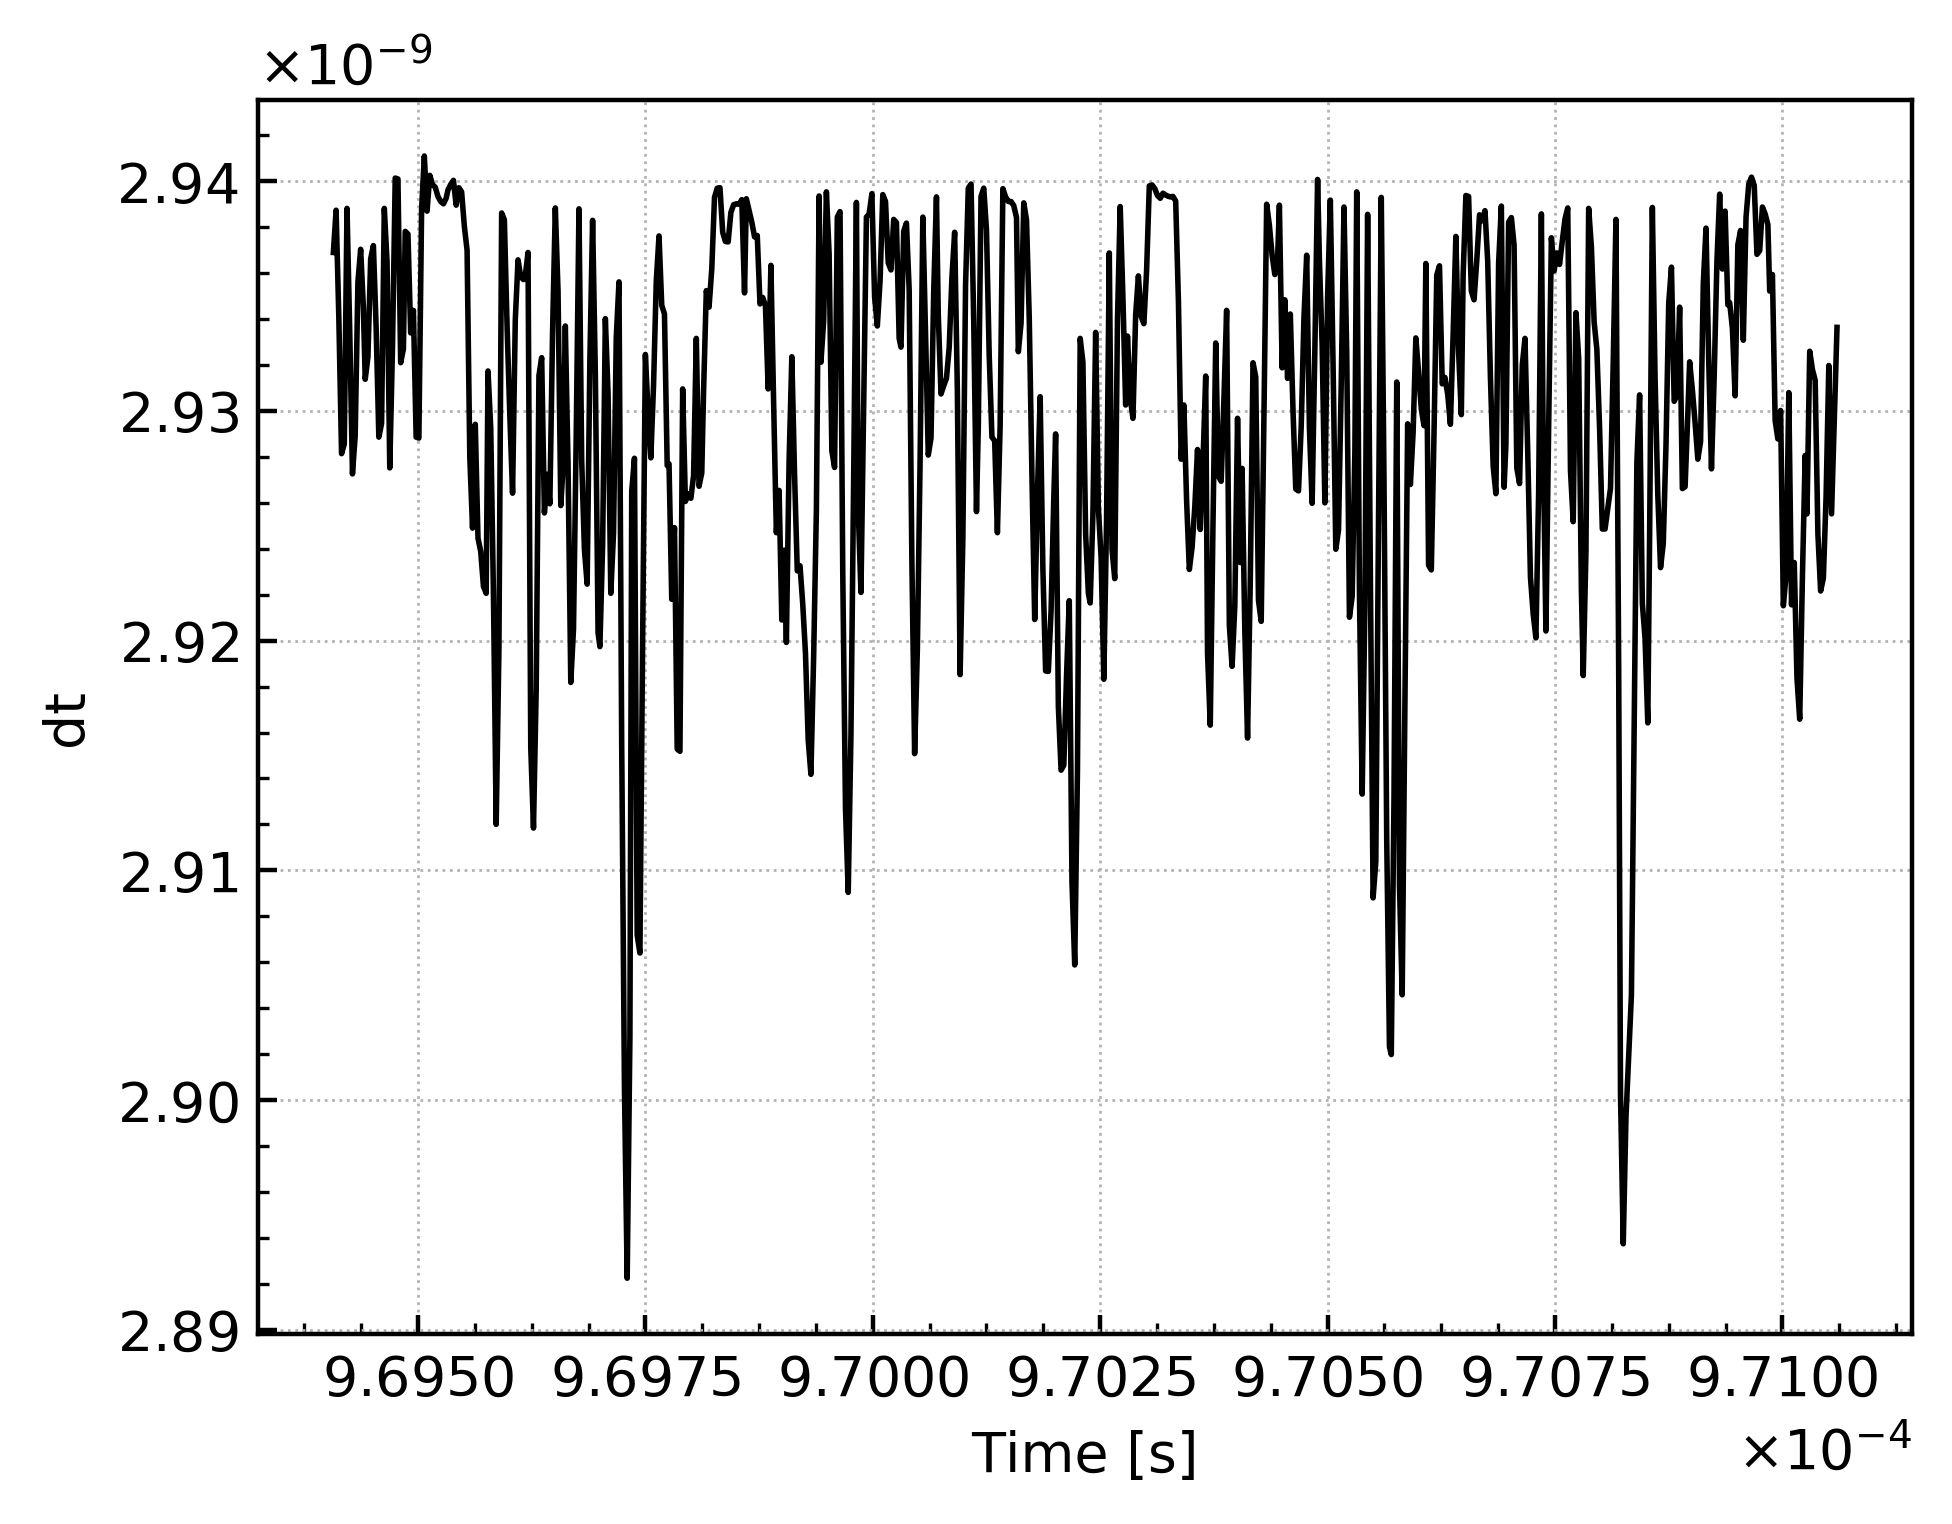
- for the single valued:
- if the optional argument
savefig=Trueis given, the plots will be saved in a folder calledLogFiguresin the working directory - if the optional argument
ext=pdfis given, the figures will be saved as pdf. The default value isext.png. - if the optional argument
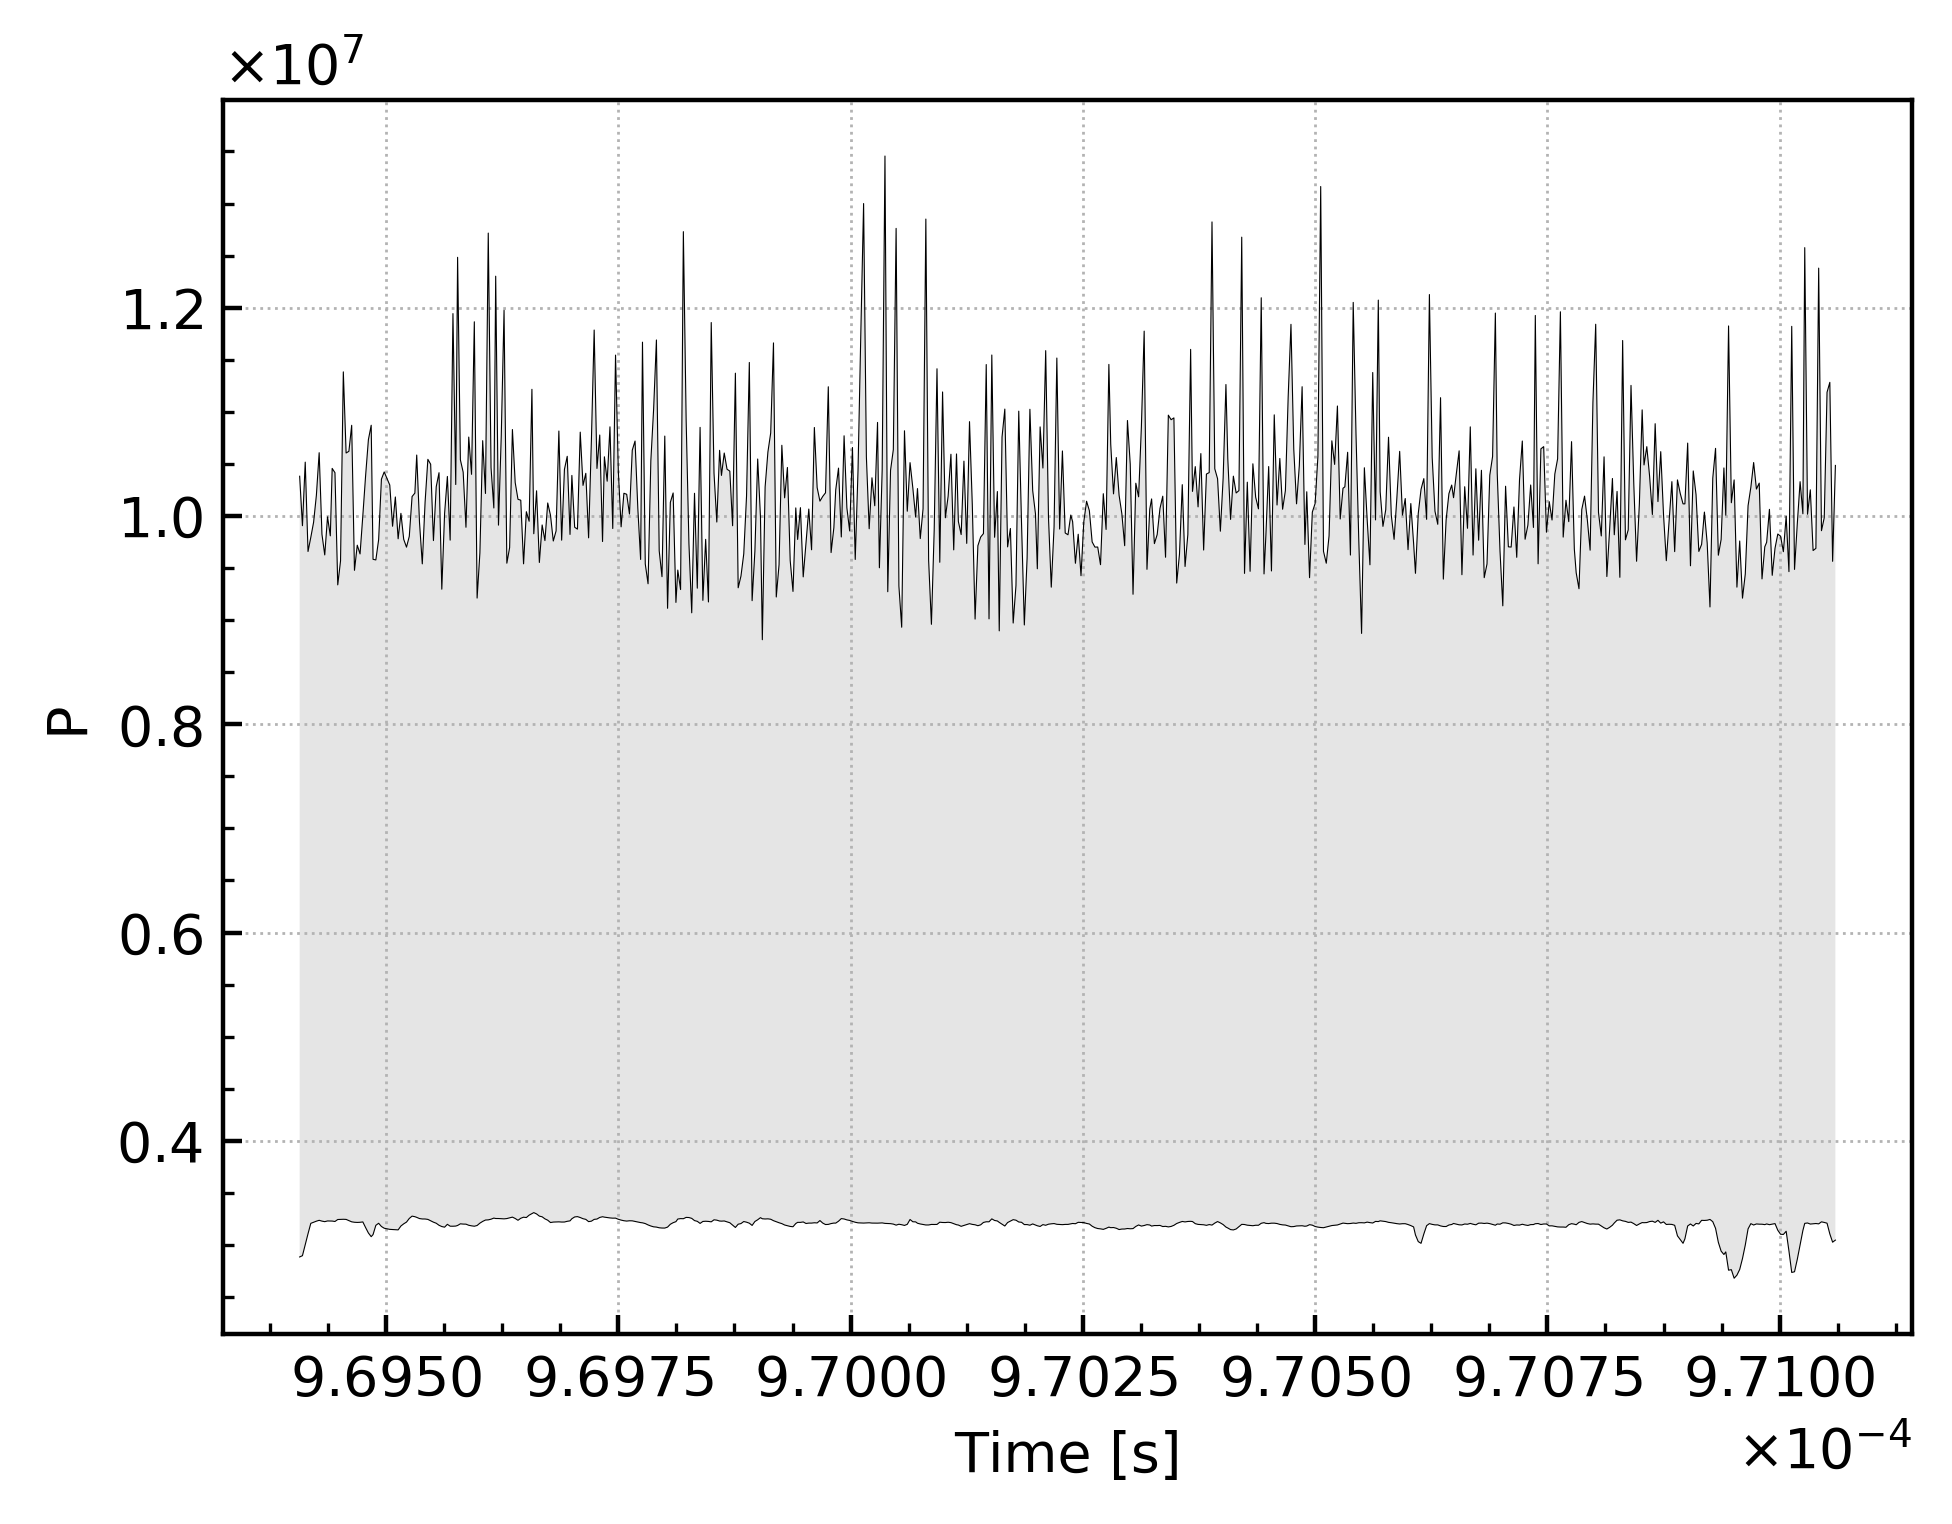
fill=Trueis given, the following range plots will be generated:
- if the optional argument
show=Trueis given, the figures generated will be displayed on your screen


Here is an example of a python script calling the packages:
#!/path_to_my_python_interpreter

import glob
import charlesxlogminmax.plot_min_max as plt_minmax

# Boolean options (True/ False or 1/0)
SHOW = 1
SAVEFIG = 1

# Use glob to find the file corresponding to the pattern "log_.*"
# The pattern should be changed by the user to find his log file.
log_file = glob.glob('log_*')[-1]

# Plotting
print("\nPlotting CharlesX log file %s" % log_file)
plt_minmax.plot_log_data(log_file, show=SHOW, savefig=SAVEFIG, ext='png')

print("Plotting done.")
print("Exiting.")