Each weekly edition of Data Is Plural features five useful/interesting datasets (or groups of related datasets). This repository contains statistics for each published edition, derived from TinyLetter's undocumented API.
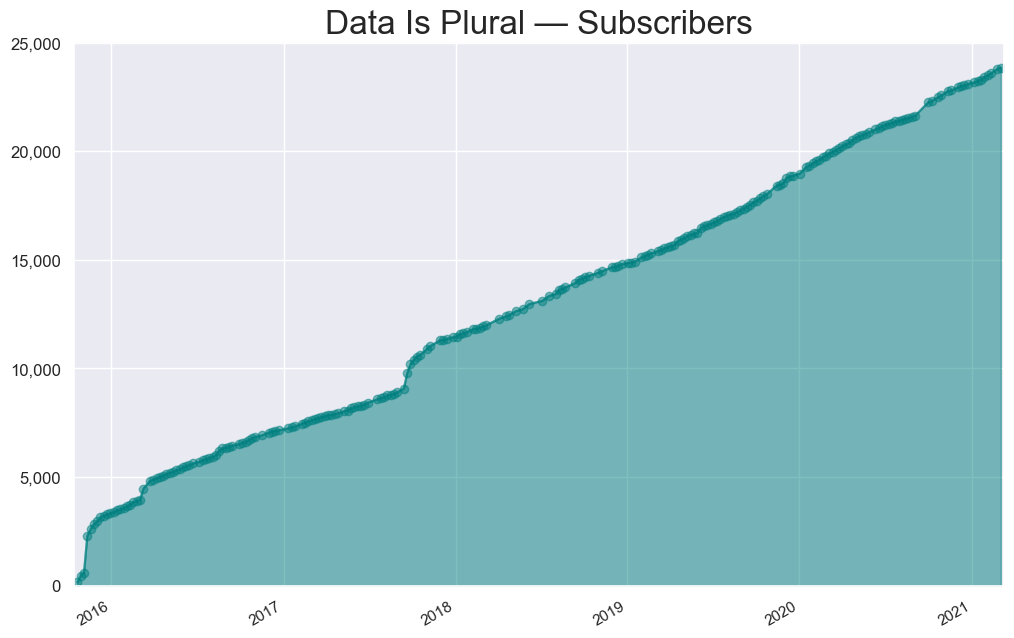
This autogenerated chart tracks the number of subscribers who received each edition:
-
November 2015 spike coincided with announcements on NICAR-L and Hacker News.
-
March 2016 spike coincided with a nice Poynter article about the newsletter.
-
September 2017 spike coincided with DIP being mentioned in Fast Company's "9 Newsletters To Make You Smarter" and in Paul Bradshaw's list of newsletters about data.
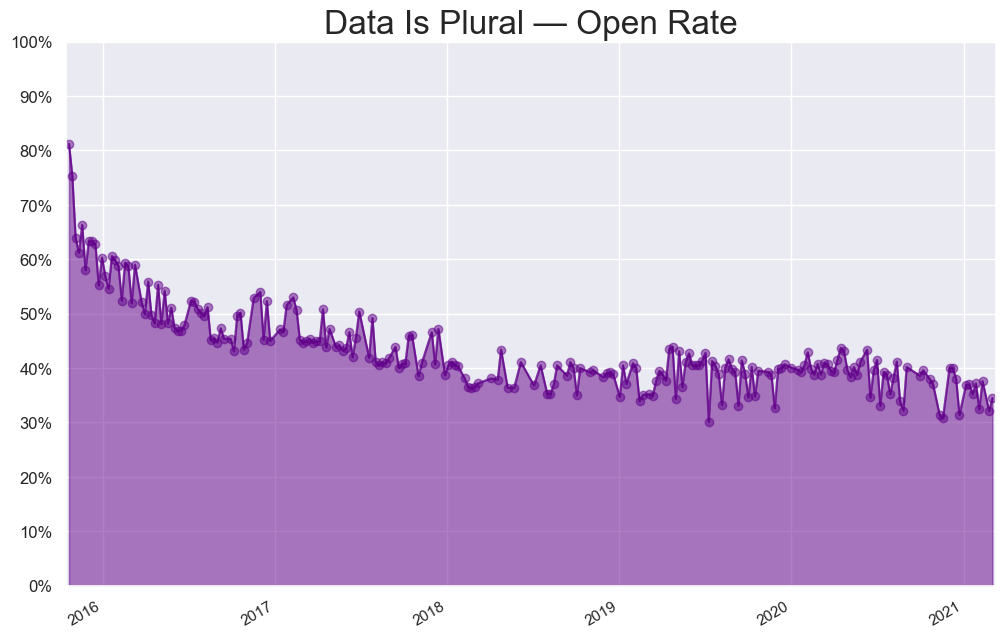
This autogenerated chart tracks each edition's "open rate" — the percentage of subscribers whom TinyLetter detected as having opened the newsletter:
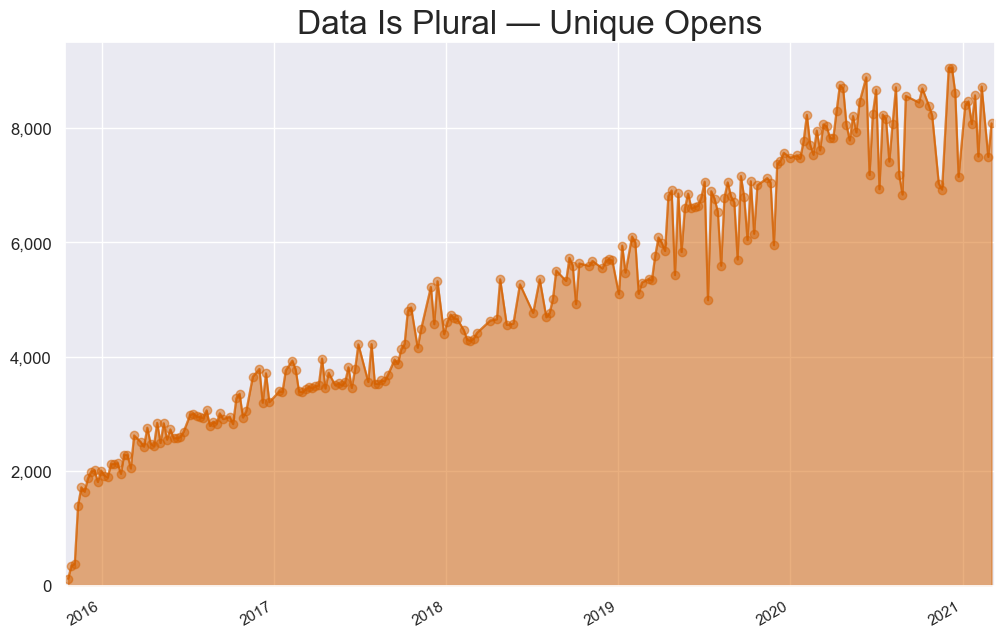
This autogenerated chart tracks each edition's total "unique opens" — the number of subscribers whom TinyLetter detected as having opened the newsletter:
You can explore the raw data here. It contains the following fields:
idstubsubjectsent_atsent_at_datesend_countstats.total_opensstats.total_clicksstats.unique_opensstats.unique_clicksstats.open_ratestats.click_ratestats.soft_bouncesstats.hard_bouncesstats.spam_complaintsstats.unsubs
See anything interesting? Let me know! (Contact information here.)


